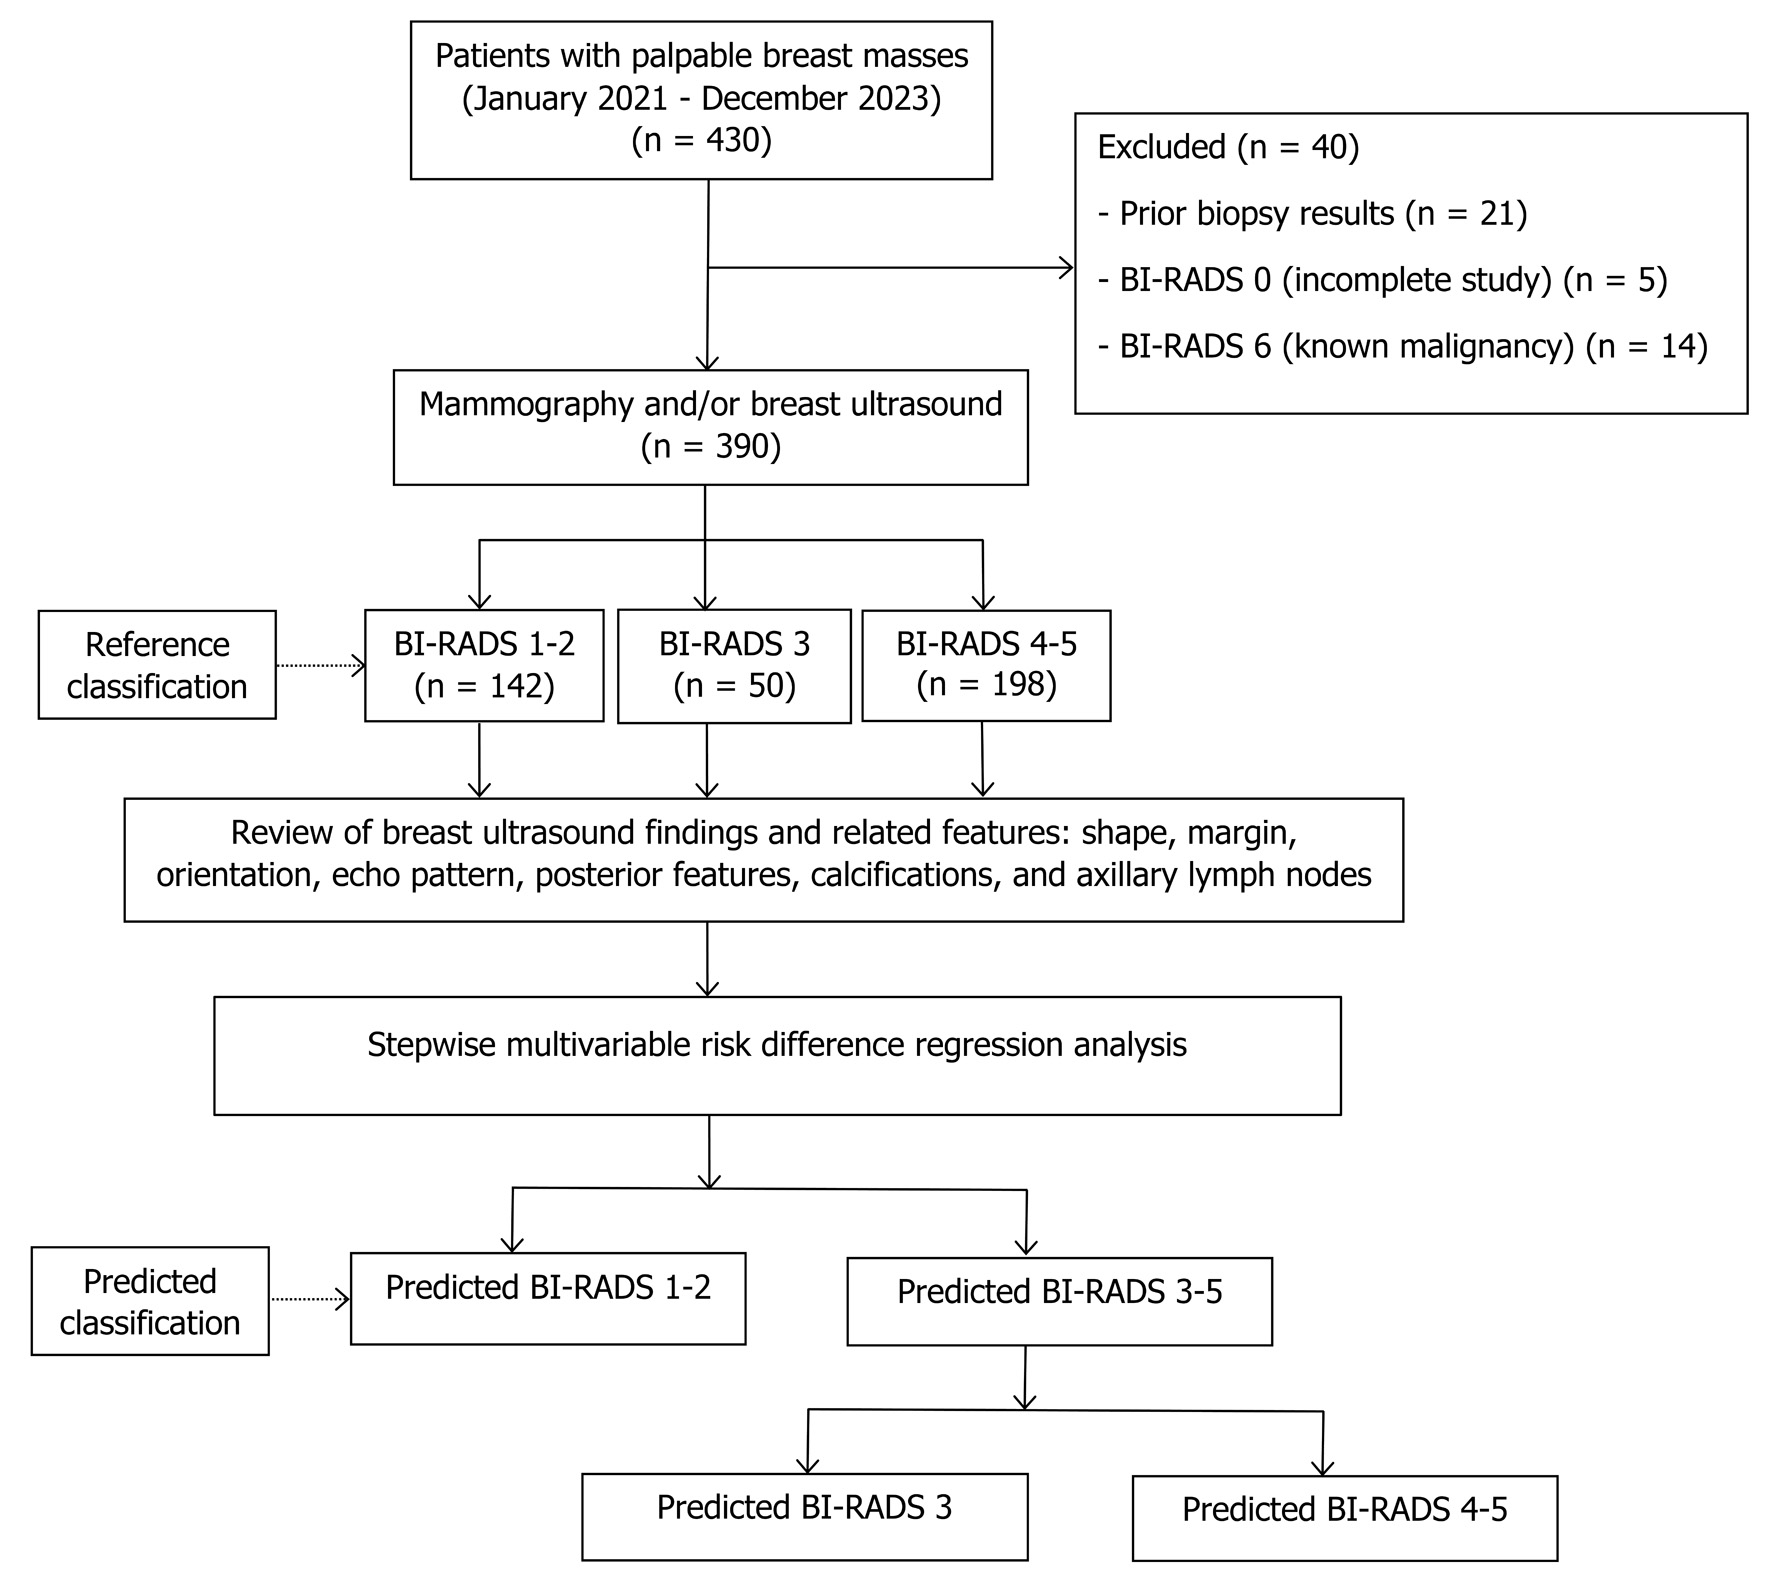
↓ Figure 1. Study flow diagram. BI-RADS: Breast
Imaging Reporting and Data System.
| Journal of Clinical Medicine Research, ISSN 1918-3003 print, 1918-3011 online, Open Access |
| Article copyright, the authors; Journal compilation copyright, J Clin Med Res and Elmer Press Inc |
| Journal website https://jocmr.elmerjournals.com |
Original Article
Volume 18, Number 1, January 2026, pages 50-61
Predicting Breast Imaging-Reporting and Data System Classification of Palpable Breast Masses Using Ultrasound to Prioritize Mammography Queues
Figures

Tables
| Reference classification (ACR BI-RADS fifth edition) | Likelihood of cancer | Management | Predicted classification | Chance of malignancy |
|---|---|---|---|---|
| ACR: American College of Radiology; BI-RADS: Breast Imaging Reporting and Data System. | ||||
| BI-RADS 1 (negative); BI-RADS 2 (benign) | Essentially 0% | Routine screening | Predicted BI-RADS 1–2 | Low |
| BI-RADS 3 (probably benign) | > 0% but ≤ 2% | Short-interval follow-up (6 months) | Predicted BI-RADS 3 | Medium |
| BI-RADS 4 (suspicious) | > 2% to < 95% | Tissue diagnosis | Predicted BI-RADS 4–5 | High |
| BI-RADS 5 (highly suggestive of malignancy) | ≥ 95% | |||
| Variables | BI-RADS 1–2 (n = 142), n (%) | BI-RADS 3 (n = 50), n (%) | BI-RADS 4–5 (n = 198), n (%) | P value |
|---|---|---|---|---|
| BI-RADS: Breast Imaging Reporting and Data System; SD: standard deviation; None: no mass. | ||||
| Age (years), mean ± SD | 49.7 ± 9.6 | 50.4 ± 11.1 | 58.7 ± 12.8 | 0.001 |
| Ultrasound findings | ||||
| Shape | ||||
| None | 28 (19.7) | 0 (0) | 0 (0) | < 0.001 |
| Oval | 111 (78.2) | 47 (94.0) | 46 (23.2) | |
| Round | 1 (0.7) | 2 (4.0) | 9 (4.5) | |
| Irregular | 2 (1.4) | 1 (2.0) | 143 (72.2) | |
| Margin | ||||
| None | 28 (19.7) | 0 (0) | 0 (0) | < 0.001 |
| Circumscribed | 114 (80.3) | 48 (96.0) | 40 (20.2) | |
| Angular | 0 (0) | 0 (0) | 19 (9.6) | |
| Microlobulated | 0 (0) | 0 (0) | 27 (14.1) | |
| Indistinct | 0 (0) | 2 (4.0) | 62 (31.3) | |
| Spiculated | 0 (0) | 0 (0) | 50 (25.3) | |
| Orientation | ||||
| None | 28 (19.7) | 0 (0) | 0 (0) | < 0.001 |
| Parallel | 114 (80.1) | 49 (98.0) | 120 (60.6) | |
| Not parallel | 0 (0) | 1 (2.0) | 78 (39.4) | |
| Echo pattern | ||||
| None | 28 (19.7) | 0 (0) | 0 (0) | < 0.001 |
| Anechoic | 104 (73.2) | 8 (16.0) | 0 (0) | |
| Hyperechoic | 0 (0) | 2 (4.0) | 0 (0) | |
| Hypoechoic | 10 (7.0) | 37 (74.0) | 114 (57.6) | |
| Isoechoic | 0 (0) | 2 (4.0) | 1 (0.5) | |
| Heterogeneous | 0 (0) | 1 (2.0) | 67 (33.8) | |
| Complex cystic-solid | 0 (0) | 0 (0) | 16 (8.1) | |
| Posterior features | ||||
| None | 28 (19.7) | 0 (0) | 0 (0) | < 0.001 |
| No posterior features | 28 (19.7) | 43 (86.0) | 94 (47.5) | |
| Enhancement | 86 (61.6) | 7 (14.0) | 78 (49.4) | |
| Shadowing | 0 (0) | 0 (0) | 25 (12.6) | |
| Combined pattern | 0 (0) | 0 (0) | 1 (0.5) | |
| Calcifications | ||||
| None | 28 (19.7) | 0 (0) | 0 (0) | < 0.001 |
| No calcifications | 114 (80.3) | 50 (100) | 117 (59.1) | |
| Calcifications in a mass | 0 (0) | 0 (0) | 80 (40.4) | |
| Intraductal calcifications | 0 (0) | 0 (0) | 1 (0.5) | |
| Axillary lymph nodes | ||||
| None | 35 (13.0) | 0 (0) | 0 (0) | < 0.001 |
| Normal | 106 (36.7) | 48 (16.6) | 135 (46.7) | |
| Abnormal | 0 (0) | 0 (0) | 57 (28.7) | |
| Predictors | Risk difference | 95% CI | P value |
|---|---|---|---|
| BI-RADS: Breast Imaging Reporting and Data System; CI: confidence interval; None: no mass. | |||
| Shape | |||
| None | Baseline | Baseline | Baseline |
| Oval | 1.06 | 0.89, 1.24 | < 0.001 |
| Round | 1.30 | 1.05, 1.54 | < 0.001 |
| Irregular | 1.08 | 0.94, 1.23 | < 0.001 |
| Margin | |||
| None | Baseline | Baseline | Baseline |
| Circumscribed | −0.11 | −0.22, 0.01 | 0.069 |
| Angular | −0.00 | −0.11, 0.11 | 0.980 |
| Microlobulated | −0.01 | −0.11, 0.09 | 0.840 |
| Indistinct | −0.01 | −0.09, 0.07 | 0.801 |
| Echo pattern | |||
| None | Baseline | Baseline | Baseline |
| Anechoic | −0.89 | −1.00, −0.78 | < 0.001 |
| Hyperechoic | −0.07 | −0.39, 0.24 | 0.651 |
| Hypoechoic | −0.10 | −0.20, 0.01 | 0.081 |
| Isoechoic | −0.03 | −0.28, 0.23 | 0.833 |
| Heterogeneous | −0.06 | −0.17, 0.06 | 0.329 |
| Predictors | Risk difference | 95% CI | P value |
|---|---|---|---|
| BI-RADS: Breast Imaging Reporting and Data System; CI: confidence interval; None: no mass. | |||
| Shape | |||
| None | Baseline | Baseline | Baseline |
| Round | 0.50 | 0.21, 0.79 | 0.001 |
| Irregular | 0.15 | 0.01, 0.28 | 0.030 |
| Margin | |||
| None | Baseline | Baseline | Baseline |
| Angular | 0.40 | 0.22, 0.57 | < 0.001 |
| Microlobulated | 0.36 | 0.19, 0.53 | < 0.001 |
| Indistinct | 0.35 | 0.21, 0.49 | < 0.001 |
| Spiculated | 0.39 | 0.23, 0.55 | < 0.001 |
| Echo pattern | |||
| None | Baseline | Baseline | Baseline |
| Hypoechoic | 0.67 | 0.26, 1.07 | 0.001 |
| Isoechoic | 0.30 | −0.21, 0.81 | 0.249 |
| Heterogeneous | 0.81 | 0.40, 1.22 | < 0.001 |
| Complex cystic-solid | 1.06 | 0.64, 1.49 | < 0.001 |
| Process | Parameters | Apparent performance | Bootstrap performance |
|---|---|---|---|
| AuROC: area under the receiver operating characteristic curve; CITL: calibration-in-the-large; E:O ratio: expected-to-observed outcomes ratio; NA: not applicable. | |||
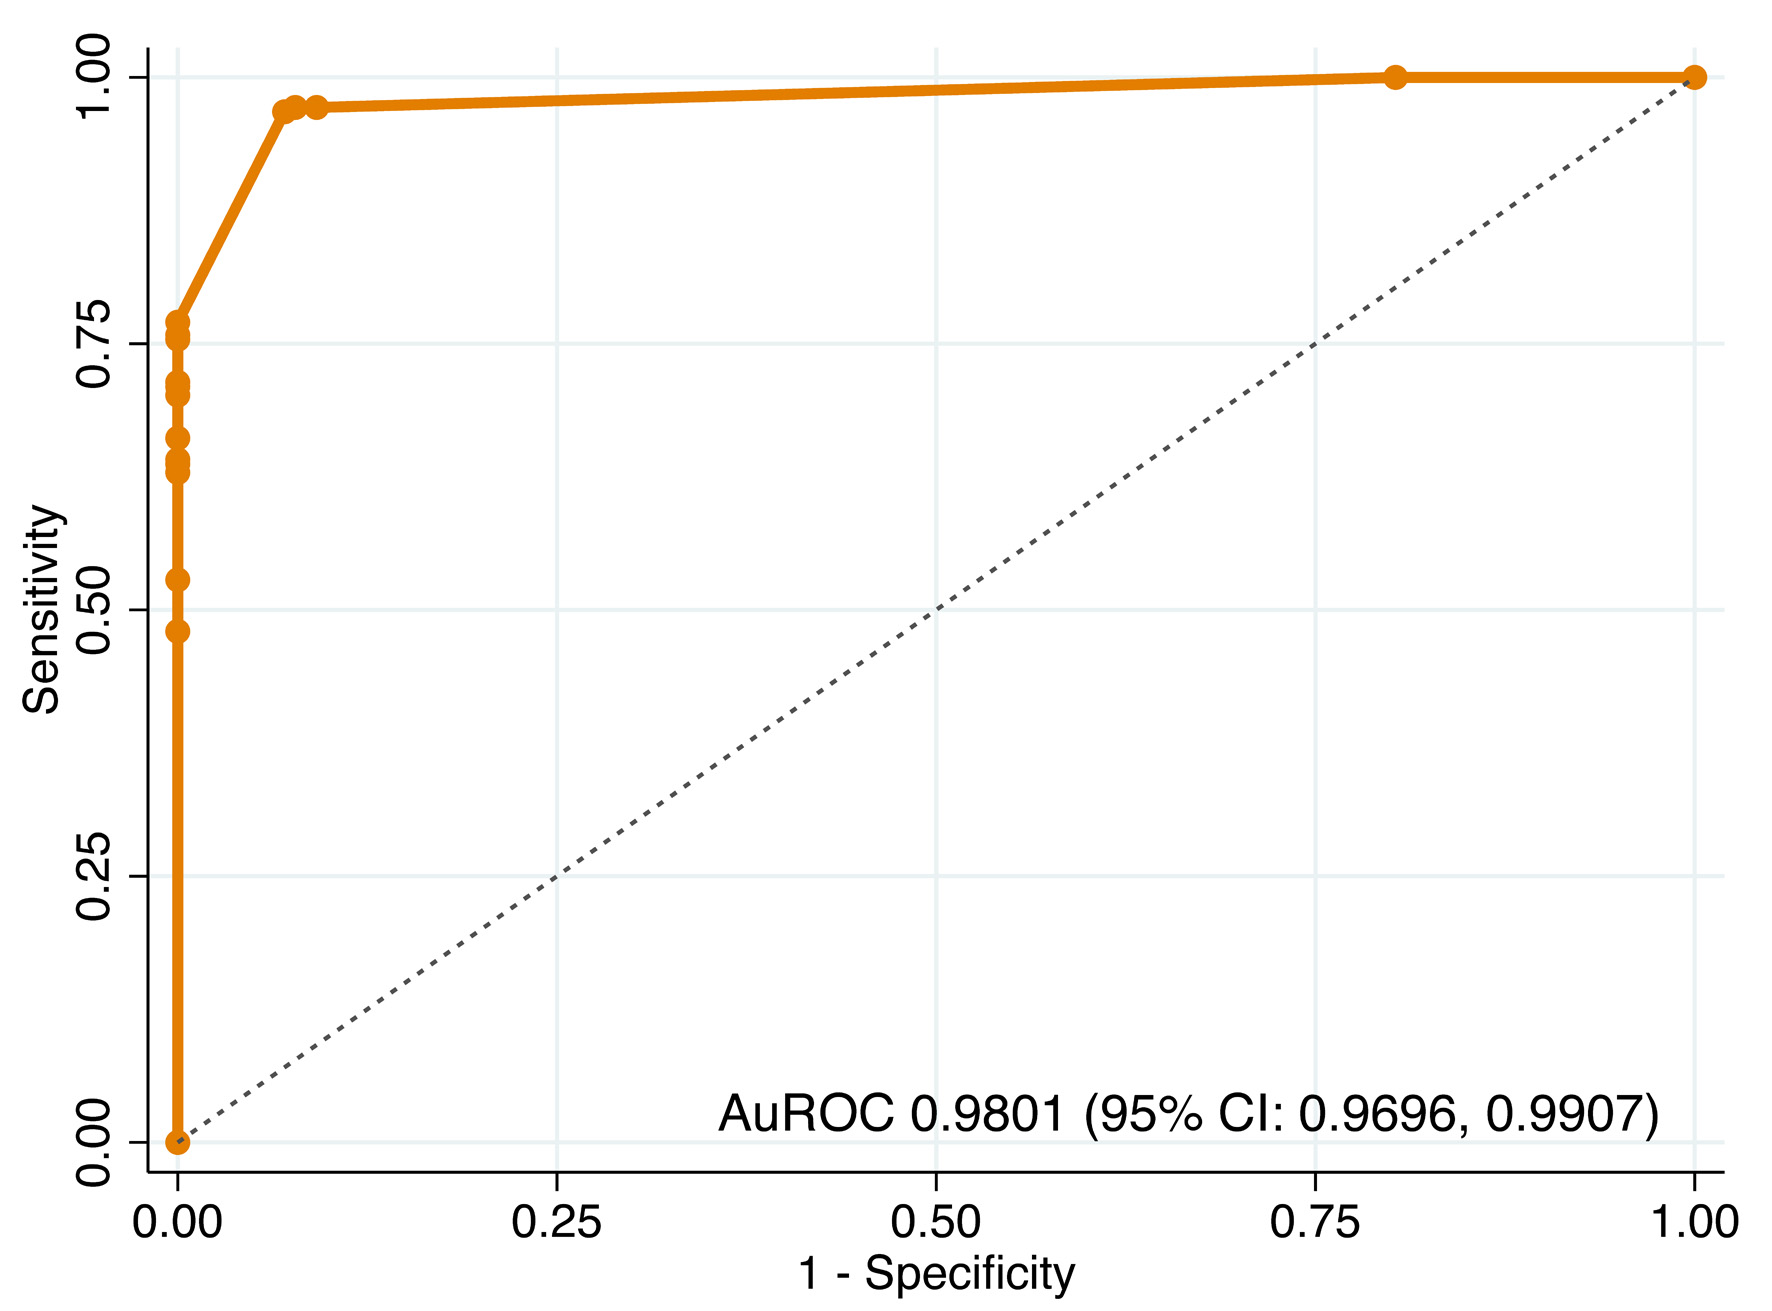
| Step 1 | AuROC | 0.9801 (0.9696, 0.9907) | 0.9800 (0.9710, 0.9910) |
| Slope | 1.0000 (0.8390, 1.1610) | 0.9800 (0.8230, 1.1450) | |
| E:O ratio | 1.0000 | 1.0010 (0.9720, 1.0410) | |
| CITL | −0.0000 (−0.4850, 0.4850) | −0.0240 (−0.6580, 0.5700) | |
| Bootstrap shrinkage | NA | 0.9800 | |
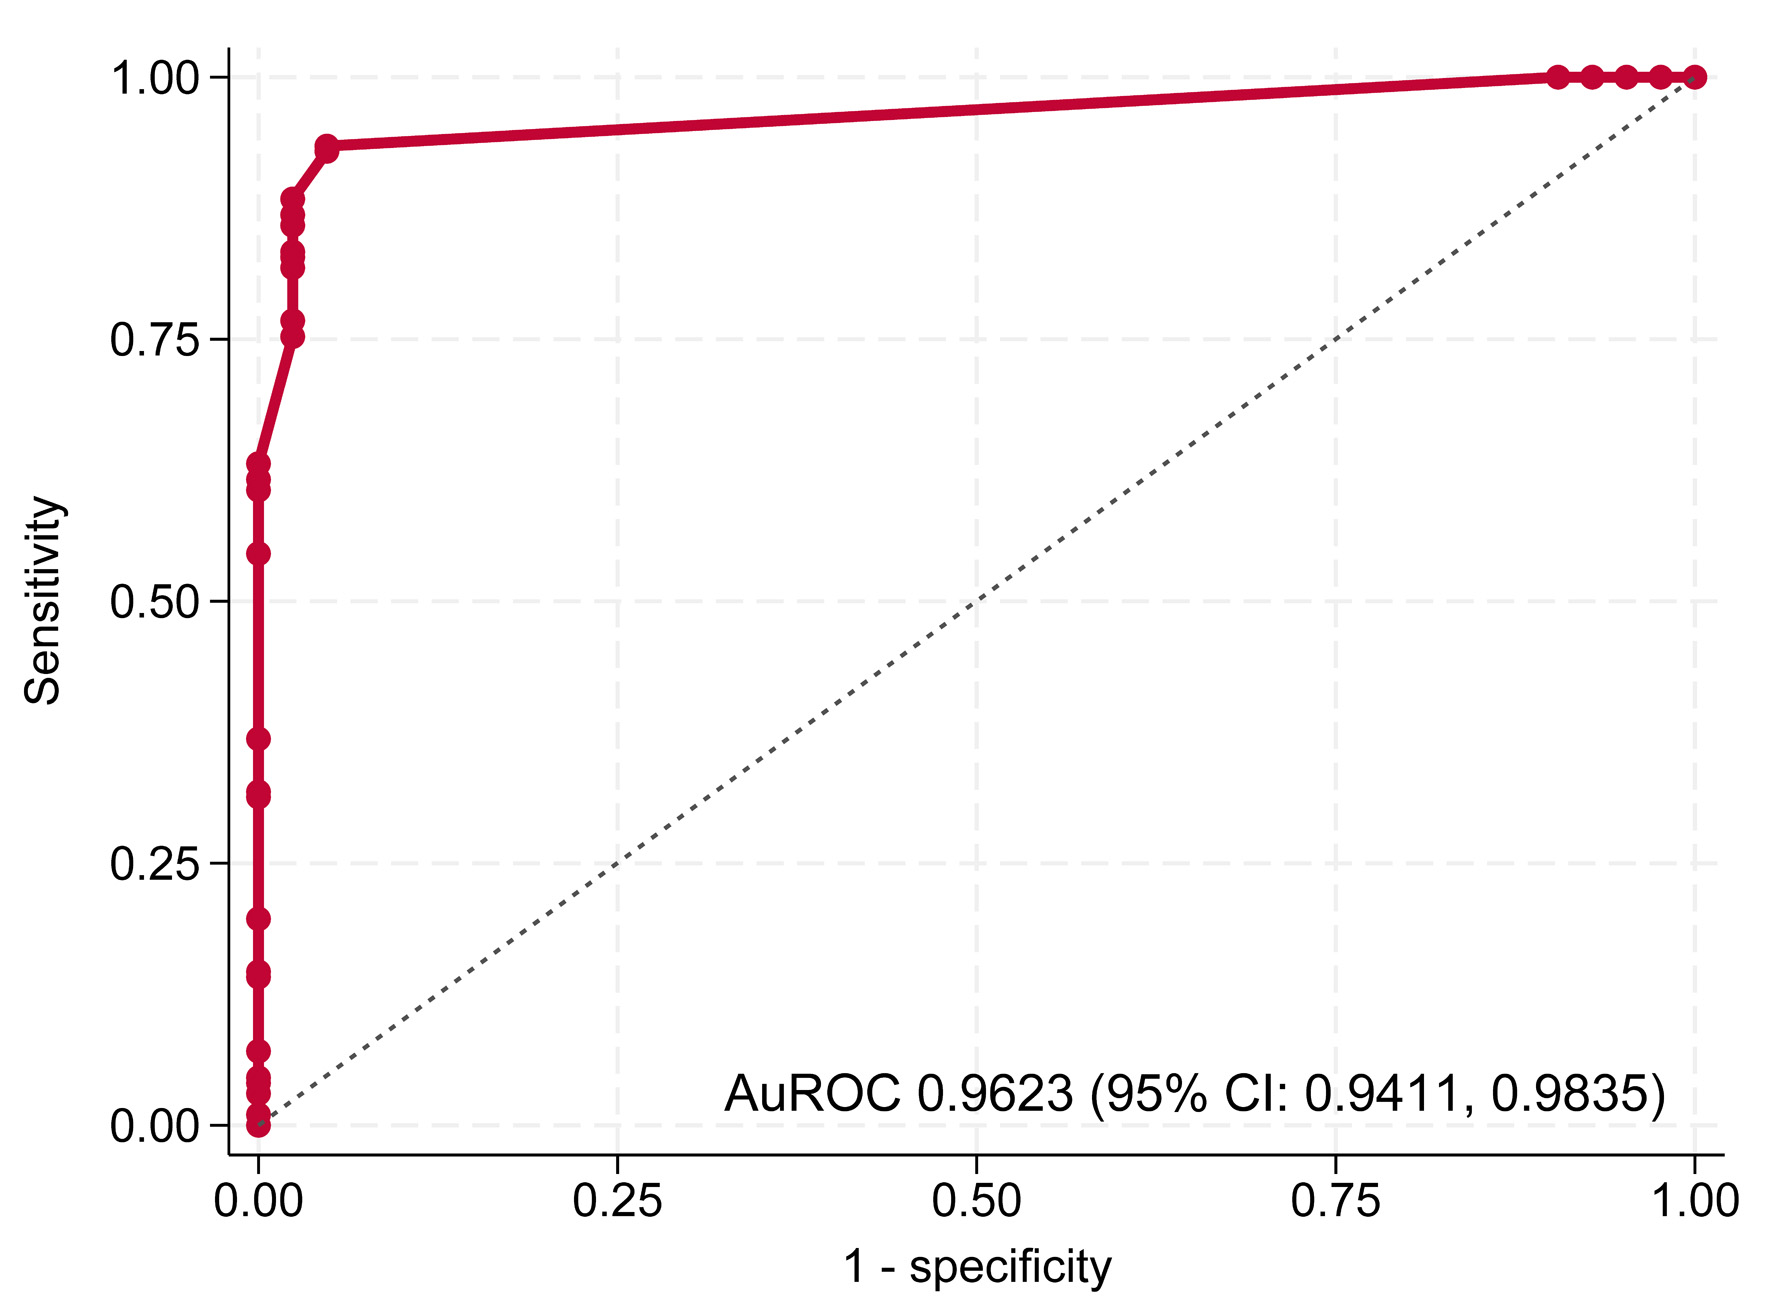
| Step 2 | AuROC | 0.9623 (0.9411, 0.9835) | 0.9630 (0.9420, 0.9900) |
| Slope | 1.0000 (0.7110, 1.2890) | 0.8960 (0.0000, 1.2830) | |
| E:O ratio | 1.0000 | 0.9190 (0.2500, 1.0240) | |
| CITL | 0.0000 (−0.5810, 0.5810) | 0.0700 (−0.4270, 0.8750) | |
| Bootstrap shrinkage | NA | 0.8960 | |
| Predicted classification | Reference classification | Total | ||
|---|---|---|---|---|
| BI-RADS 1–2 (n = 142) | BI-RADS 3 (n = 50) | BI-RADS 4–5 (n = 198) | ||
| BI-RADS: Breast Imaging Reporting and Data System. | ||||
| Predicted BI-RADS 1–2 | 132 (33.9%) | 8 (2.0%) | 0 (0%) | 140 (35.9%) |
| Predicted BI-RADS 3 | 10 (2.5%) | 41 (10.5%) | 26 (6.7%) | 77 (19.7%) |
| Predicted BI-RADS 4–5 | 0 (0%) | 1 (0.3%) | 172 (44.1%) | 173 (44.4%) |
| Total | 142 (36.4%) | 50 (12.8%) | 198 (50.8%) | 390 (100%) |
| Process | Method | Patients (n) | AuROC | 95% CI |
|---|---|---|---|---|
| AuROC: area under the receiver operating characteristic curve; CI: confidence interval. | ||||
| Step 1 | Overall model | 390 | 0.9801 | 0.9695, 0.9907 |
| Mammography-based interpretation alone | 172 | 0.9945 | 0.9866, 1.0000 | |
| Step 2 | Overall model | 240 | 0.9623 | 0.9411, 0.9835 |
| Mammography-based interpretation alone | 163 | 0.9876 | 0.9707, 1.0000 | |
| Process | Linear combination | Predicted group | Chance of malignancy | Queue | Waiting time |
|---|---|---|---|---|---|
| BI-RADS: Breast Imaging Reporting and Data System. | |||||
| Step 1 | < 0.625 | BI-RADS 1–2 | Low | Normal | Standard queue |
| ≥ 0.625 | BI-RADS 3–5 | Proceed to step 2 evaluation | |||
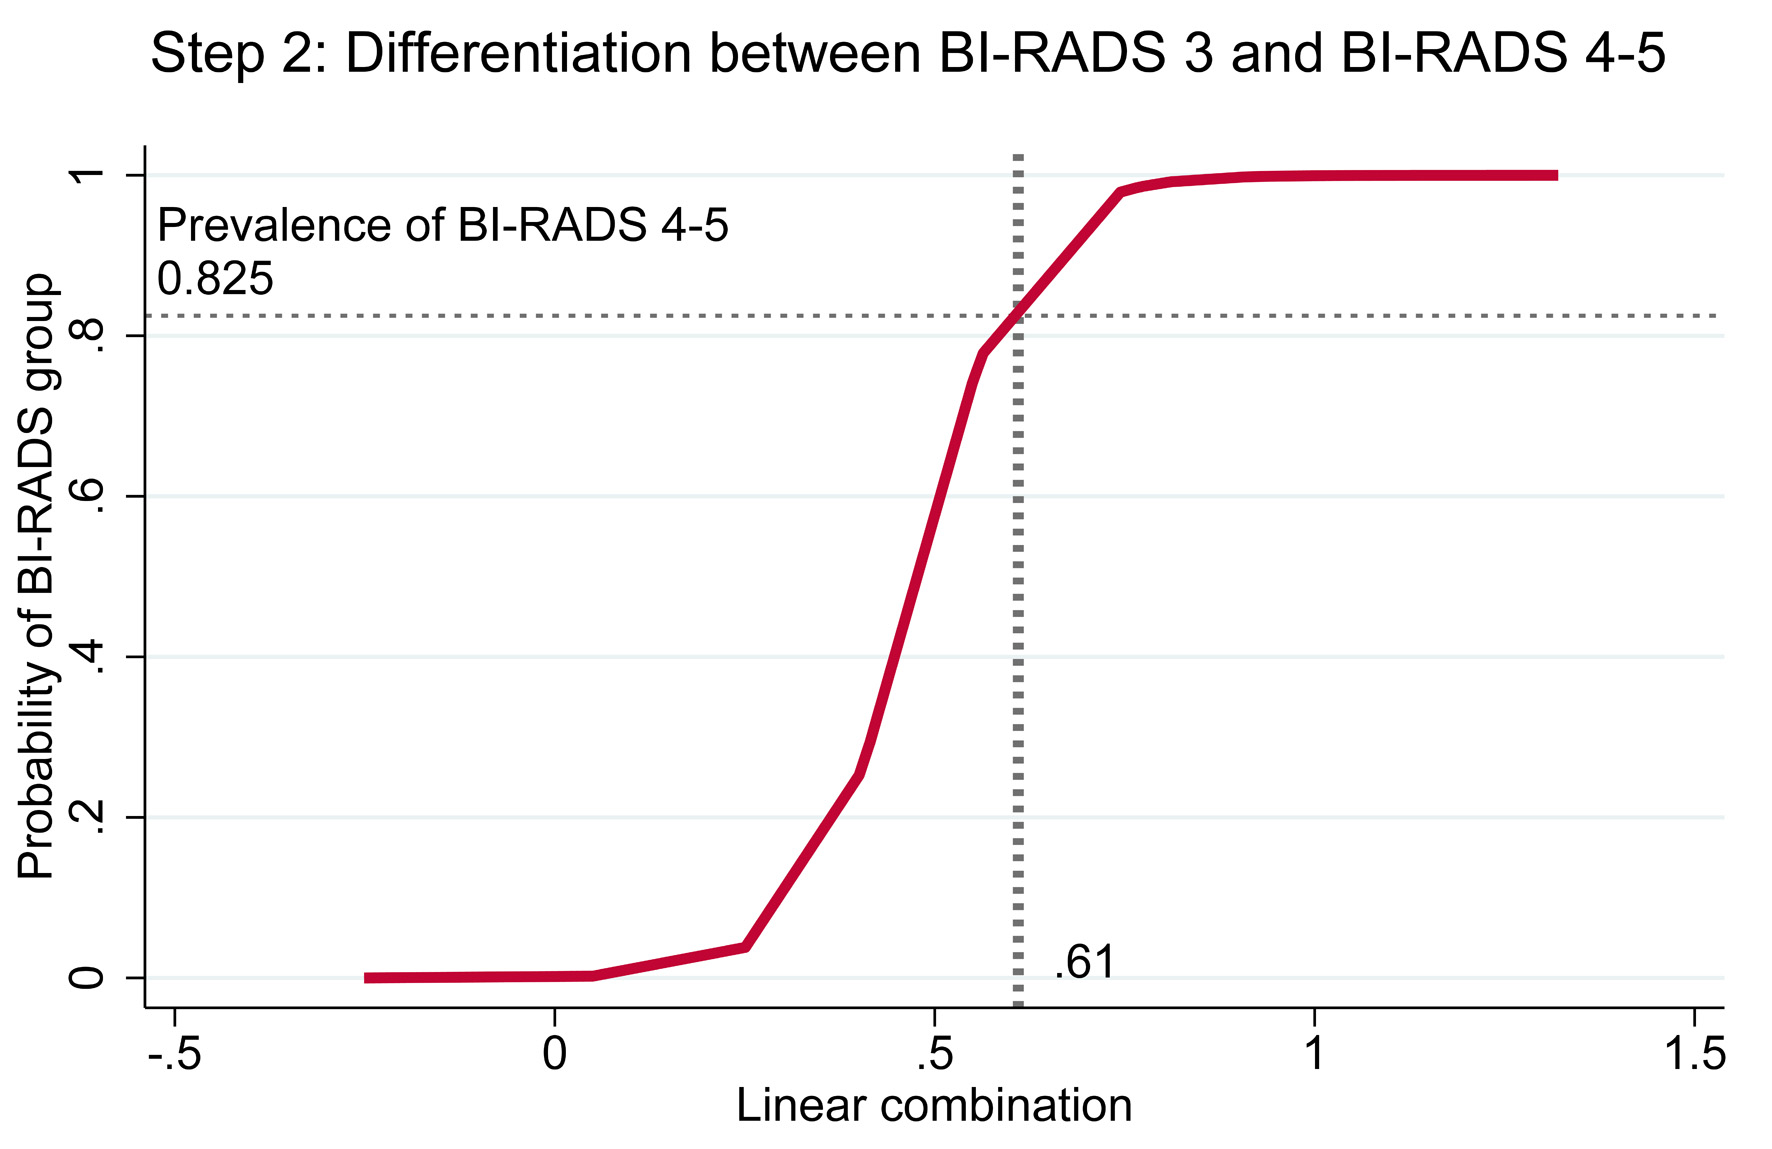
| Step 2 | < 0.610 | BI-RADS 3 | Medium | Semi-urgent | Within 4 - 8 weeks |
| ≥ 0.610 | BI-RADS 4–5 | High | Urgent | Within 4 weeks | |