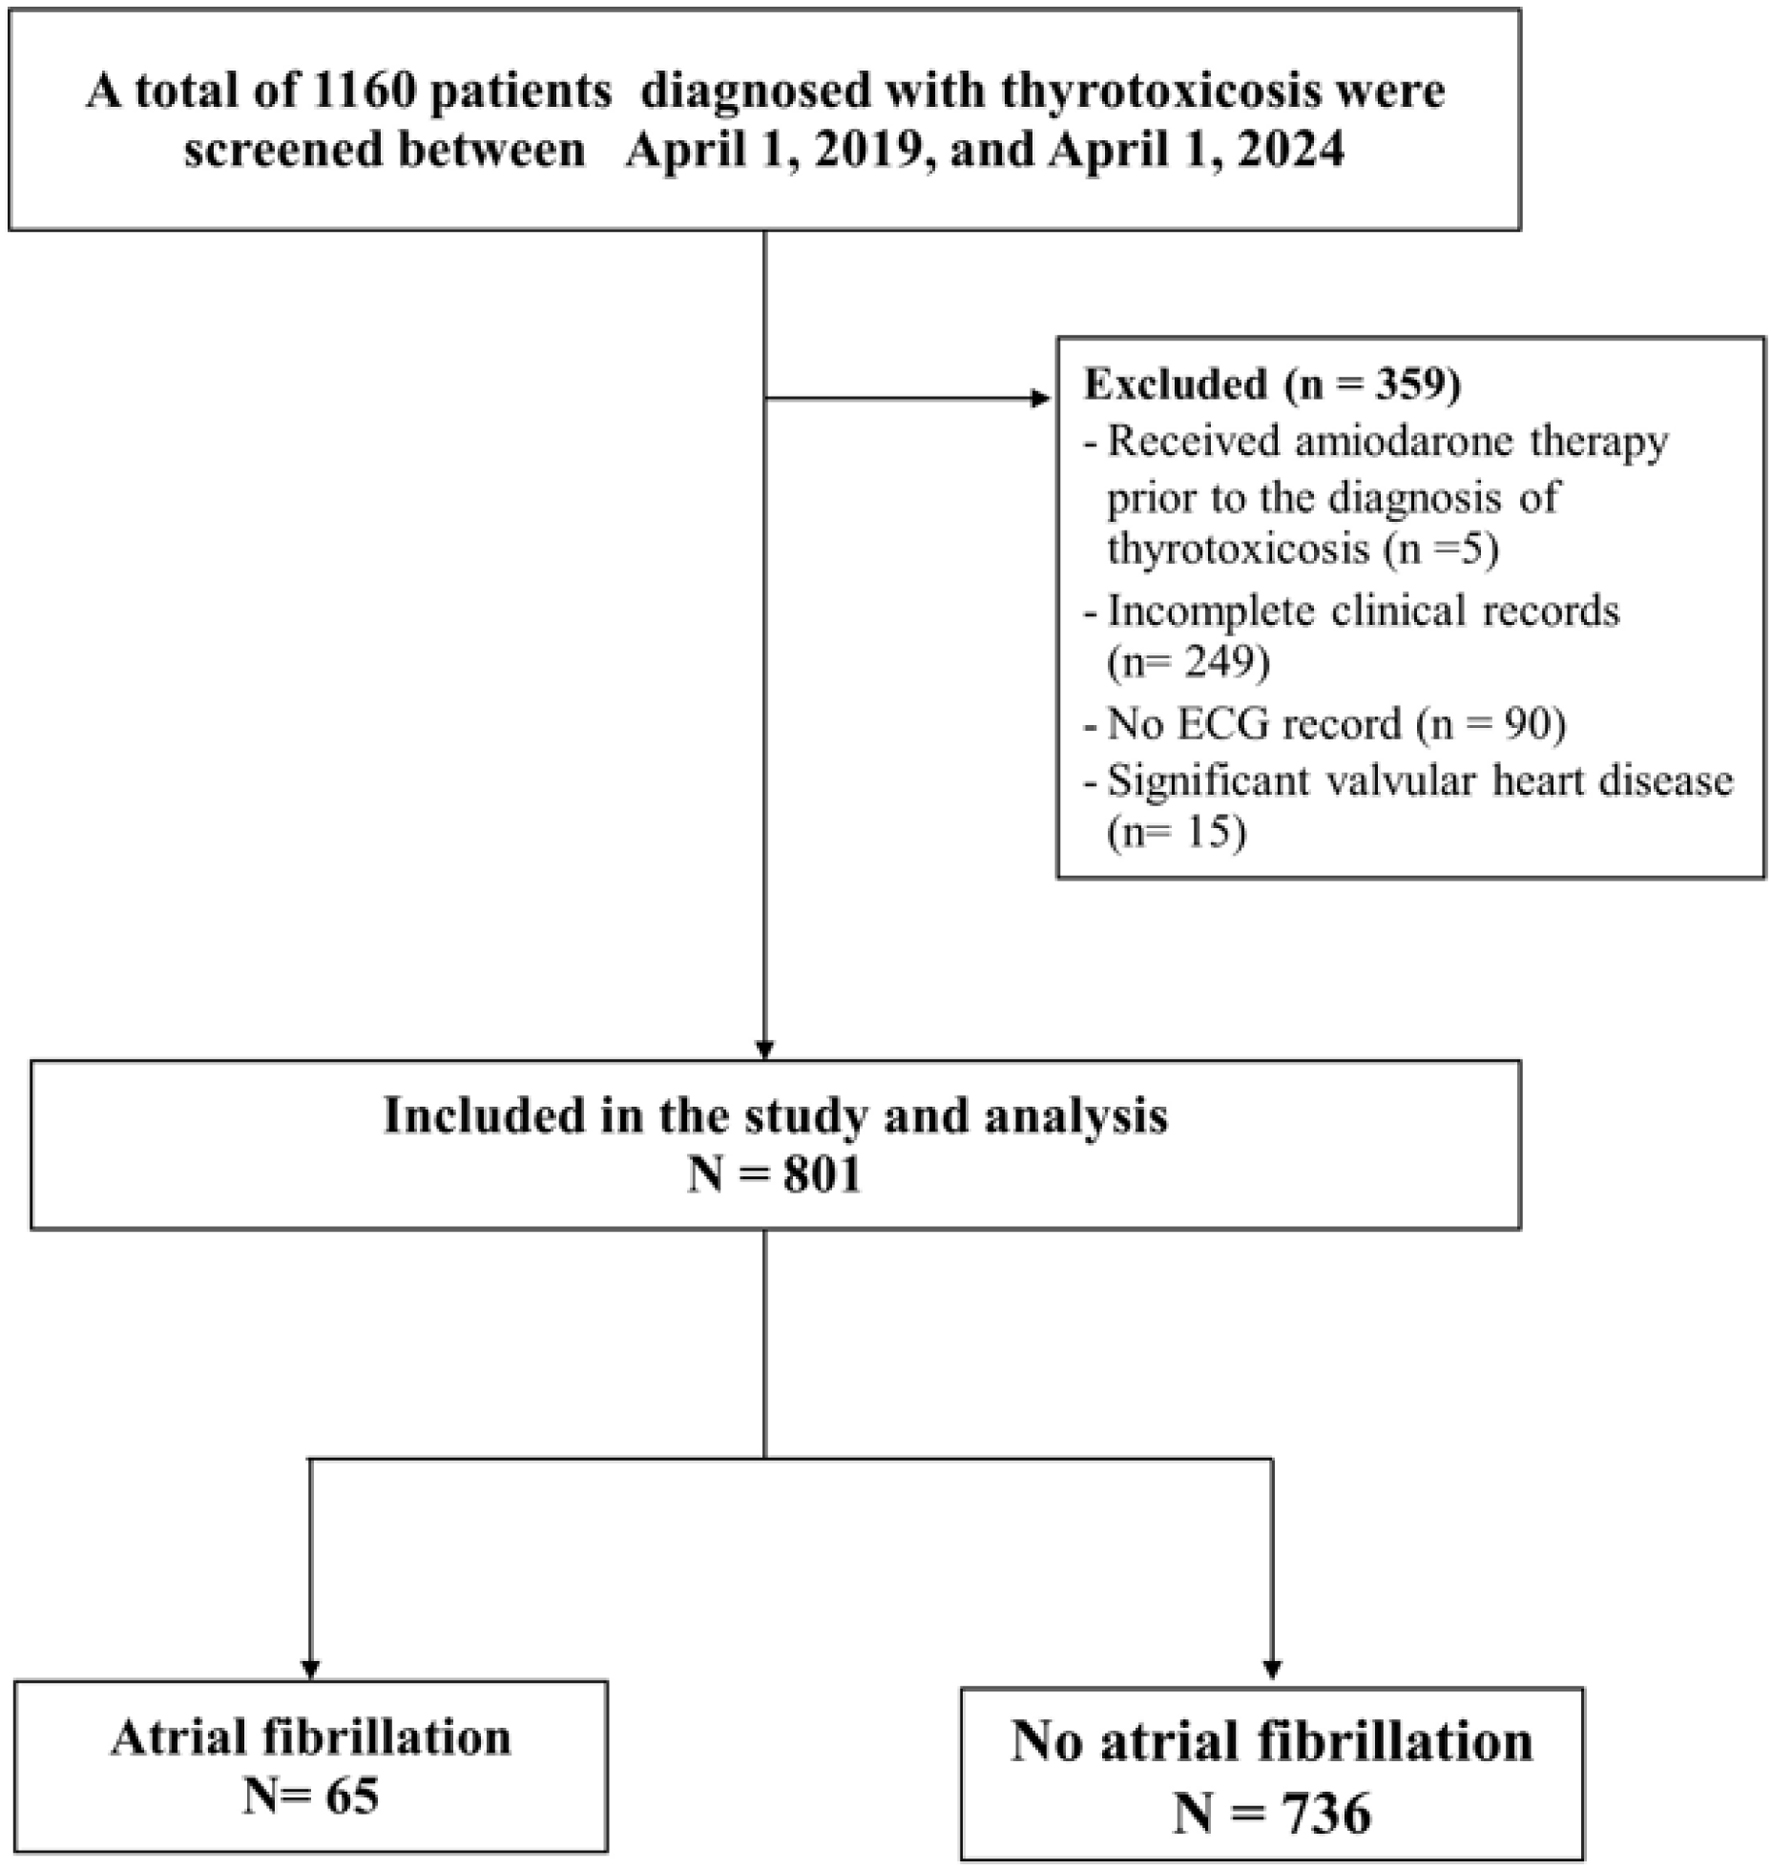
↓ Figure 1. Flow diagram of patient selection. A
total of 1,160 patients with thyrotoxicosis were screened, exceeding the minimum required sample size,
and 801 were included in the final analysis.
| Journal of Clinical Medicine Research, ISSN 1918-3003 print, 1918-3011 online, Open Access |
| Article copyright, the authors; Journal compilation copyright, J Clin Med Res and Elmer Press Inc |
| Journal website https://jocmr.elmerjournals.com |
Original Article
Volume 17, Number 12, December 2025, pages 716-725
Atrial Fibrillation in the Context of Thyrotoxicosis: Prevalence and Clinical Determinants
Figures
Tables
| Baseline characteristics | AF (n = 65) | Non-AF (n = 736) | P-value |
|---|---|---|---|
| AF: atrial fibrillation; SD: standard deviation. | |||
| Sex, n (%) | < 0.001 | ||
| Female | 34 (52.31) | 592 (80.43) | |
| Male | 31 (47.69) | 144 (19.57) | |
| Age at thyrotoxicosis diagnosis (years), mean ± SD | 52 ± 15.35 | 36 ± 15.38 | < 0.001 |
| Body mass index, n (%) | 0.177 | ||
| Underweight (< 18.5 kg/m2) | 7 (10.77) | 119 (16.21) | |
| Normal (18.5 - 22.9 kg/m2) | 26 (40.00) | 347 (47.28) | |
| Overweight (23.0 - 27.4 kg/m2) | 22 (33.85) | 199 (27.11) | |
| Obese (> 27.5 kg/m2) | 10 (15.38) | 69 (9.40) | |
| Systolic pressure at diagnosis, mean ± SD | 132 ± 20.51 | 128 ± 15.95 | 0.054 |
| Diastolic pressure at diagnosis, mean ± SD | 76 ± 13.34 | 73 ± 11.42 | 0.023 |
| Heart rate at diagnosis, mean ± SD | 97 ± 24.19 | 100 ± 20.58 | 0.179 |
| Coronary artery disease, n (%) | 2 (3.08) | 8 (1.09) | 0.192 |
| Chronic kidney disease, n (%) | < 0.001 | ||
| Stage 1 | 24 (36.92) | 233 (31.16) | |
| Stage 2 | 16 (24.62) | 93 (12.61) | |
| Stage 3 | 6 (9.23) | 21 (2.85) | |
| Stage 4-5 | 2 (3.08) | 2 (0.27) | |
| Cerebrovascular disease, n (%) | 11 (16.92) | 6 (0.82) | < 0.001 |
| Dyslipidemia, n (%) | 19 (29.23) | 78 (10.60) | < 0.001 |
| Diabetes mellitus, n (%) | 14 (21.54) | 38 (5.16) | < 0.001 |
| Heart failure, n (%) | 10 (15.38) | 4 (0.54) | < 0.001 |
| Hypertension, n (%) | 27 (41.54) | 86 (11.68) | < 0.001 |
| History of thyroid crisis, n (%) | 20 (30.77) | 12 (1.63) | < 0.001 |
| Etiology | 0.573 | ||
| Graves’ disease | 60 (92.31) | 629 (85.46) | |
| Drug-induced thyroiditis | 1 (1.54) | 3 (0.41) | |
| Hashimoto thyroiditis | 0 (0) | 12 (1.63) | |
| Thyroid adenoma | 1 (1.54) | 10 (1.36) | |
| Thyroid cancer | 0 (0) | 1 (0.14) | |
| Thyroid multinodular goiter | 0 (0) | 9 (1.22) | |
| Thyroid nodule | 0 (0) | 23 (3.13) | |
| TSH-producing adenoma | 0 (0) | 1 (0.14) | |
| Gestational transient thyrotoxicosis | 0 (0) | 1 (0.14) | |
| Unknown | 3 (4.62) | 47 (6.39) | |
| Laboratory parameters | AF (n = 65) | Non-AF (n = 736) | P-value |
|---|---|---|---|
| AF: atrial fibrillation; BUN: blood urea nitrogen; eGFR: estimated glomerular filtration rate; FT3: free triiodothyronine; FT4: free thyroxine; HbA1c: glycated hemoglobin; TSH: thyroid-stimulating hormone; SD: standard deviation. | |||
| Hct (%), mean ± SD | 40.13 ± 6.52 | 39.48 ± 4.15 | 0.3017 |
| Hb (g/dL), mean ± SD | 13.05 ± 2.28 | 12.80 ± 1.49 | 0.267 |
| HbA1C (%), mean ± SD | 5.95 ± 0.89 | 5.87 ± 0.97 | 0.660 |
| BUN (mg/dL), mean ± SD | 16.25 ± 11.28 | 12.32 ± 5.67 | 0.001 |
| Creatinine (mg/dL), mean ± SD | 1.11 ± 1.54 | 0.72 ± 0.25 | < 0.001 |
| eGFR (mL/min), mean ± SD | 84.77 ± 29.30 | 101.29 ± 26.49 | < 0.001 |
| TSH (µIU/mL), mean ± SD | 0.02 ± 0.08 | 0.03 ± 0.24 | 0.763 |
| FT4 (ng/mL), mean ± SD | 4.10 ± 2.09 | 4.19 ± 2.23 | 0.771 |
| FT3 (ng/mL), mean ± SD | 11.37 ± 8.48 | 14.16 ± 9.76 | 0.027 |
| Sodium (mmol/L), mean ± SD | 139.20 ± 3.66 | 139.10 ± 2.71 | 0.801 |
| Potassium (mmol/L), mean ± SD | 3.92 ± 0.61 | 4.12 ± 2.25 | 0.593 |
| Chloride (mmol/L), mean ± SD | 104.04 ± 4.45 | 104.35 ± 3.31 | 0.543 |
| Bicarbonate (mmol/L), mean ± SD | 23.39 ± 2.88 | 24.07 ± 3.51 | 0.118 |
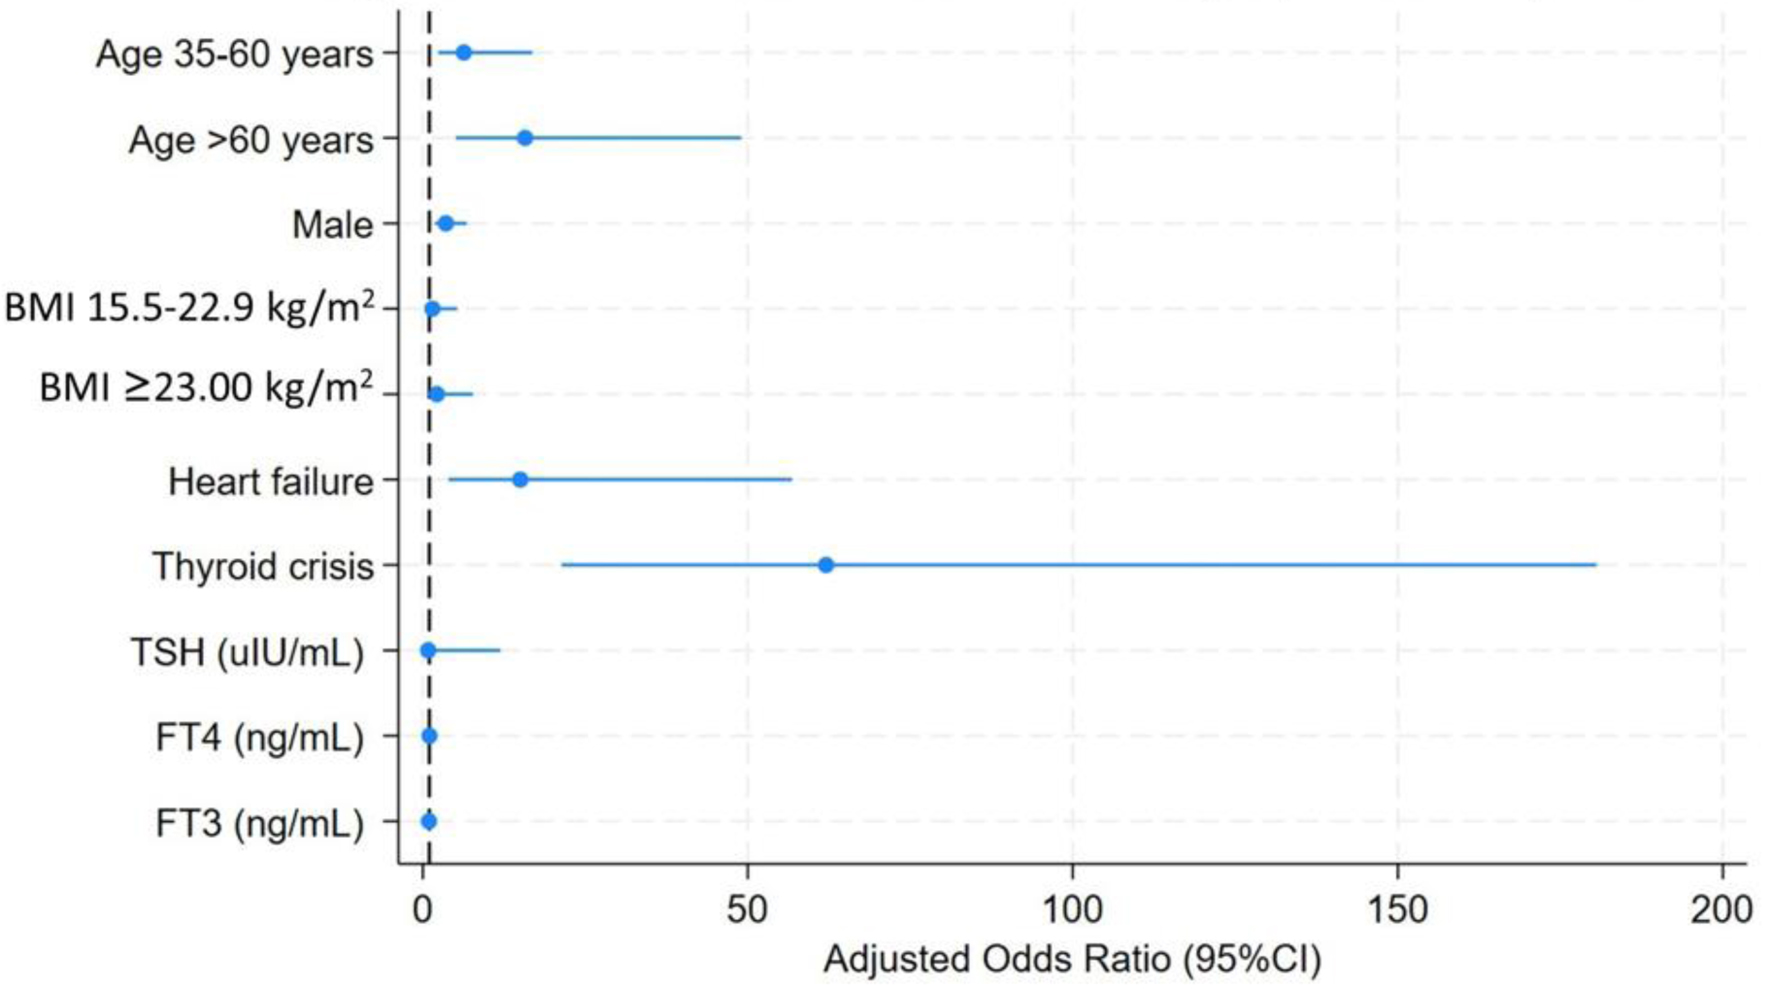
| Prognostic factors | Crude OR (95% CI) | Adjusted OR (95% CI) | P-value (adjusted model) |
|---|---|---|---|
| Adjusted odds ratios were derived from a full multivariable logistic regression model including all clinically relevant covariates (age group, sex, BMI, diabetes mellitus, hypertension, heart failure, thyroid crisis, TSH, FT4, and FT3). The final P-values presented in the table correspond to the adjusted model. BMI: body mass index; CI: confidence interval; FT3: free triiodothyronine; FT4: free thyroxine; OR: odds ratio; TSH: thyroid-stimulating hormone. | |||
| Age of diagnosis (years) | |||
| < 35 | 1 | 1 | |
| 35 - 60 | 5.35 (2.55 - 11.24) | 5.48 (2.03 - 14.83) | 0.001 |
| > 60 | 13.07 (5.61 - 30.47) | 11.39 (3.43 - 37.76) | < 0.001 |
| Male | 3.75 (2.23 - 6.30) | 3.38 (1.70 - 6.30) | < 0.001 |
| BMI (kg/m2) | |||
| < 18.5 | 1 | 1 | |
| 15.5 - 22.9 | 1.24 (0.53 - 2.94) | 1.55 (0.42 - 5.68) | 0.506 |
| ≥ 23.00 | 1.98 (0.85 - 4.61) | 2.11 (0.59 - 7.60) | 0.253 |
| Diabetes mellitus | 5.04 (2.57 - 9.91) | 1.87 (0.77 - 4.55) | 0.169 |
| Hypertension | 5.37 (3.12 - 9.24) | 1.1.53 (0.72 - 3.26) | 0.272 |
| Heart failure | 33.27 (10.10 - 109.53) | 11.25 (2.85 - 44.54) | 0.001 |
| Thyroid crisis | 26.81 (12.34 - 58.29) | 61.84 (21.89 - 181.32) | < 0.001 |
| TSH (µIU/mL) | 0.77 (0.14 - 4.21) | 0.90 (0.06 - 12.86) | 0.938 |
| FT4 (ng/mL) | 0.98 (0.88 - 1.10) | 1.04 (0.83 - 1.30) | 0.740 |
| FT3 (ng/mL) | 0.97 (0.94 - 0.99) | 0.95 (0.90 - 1.01) | 0.085 |