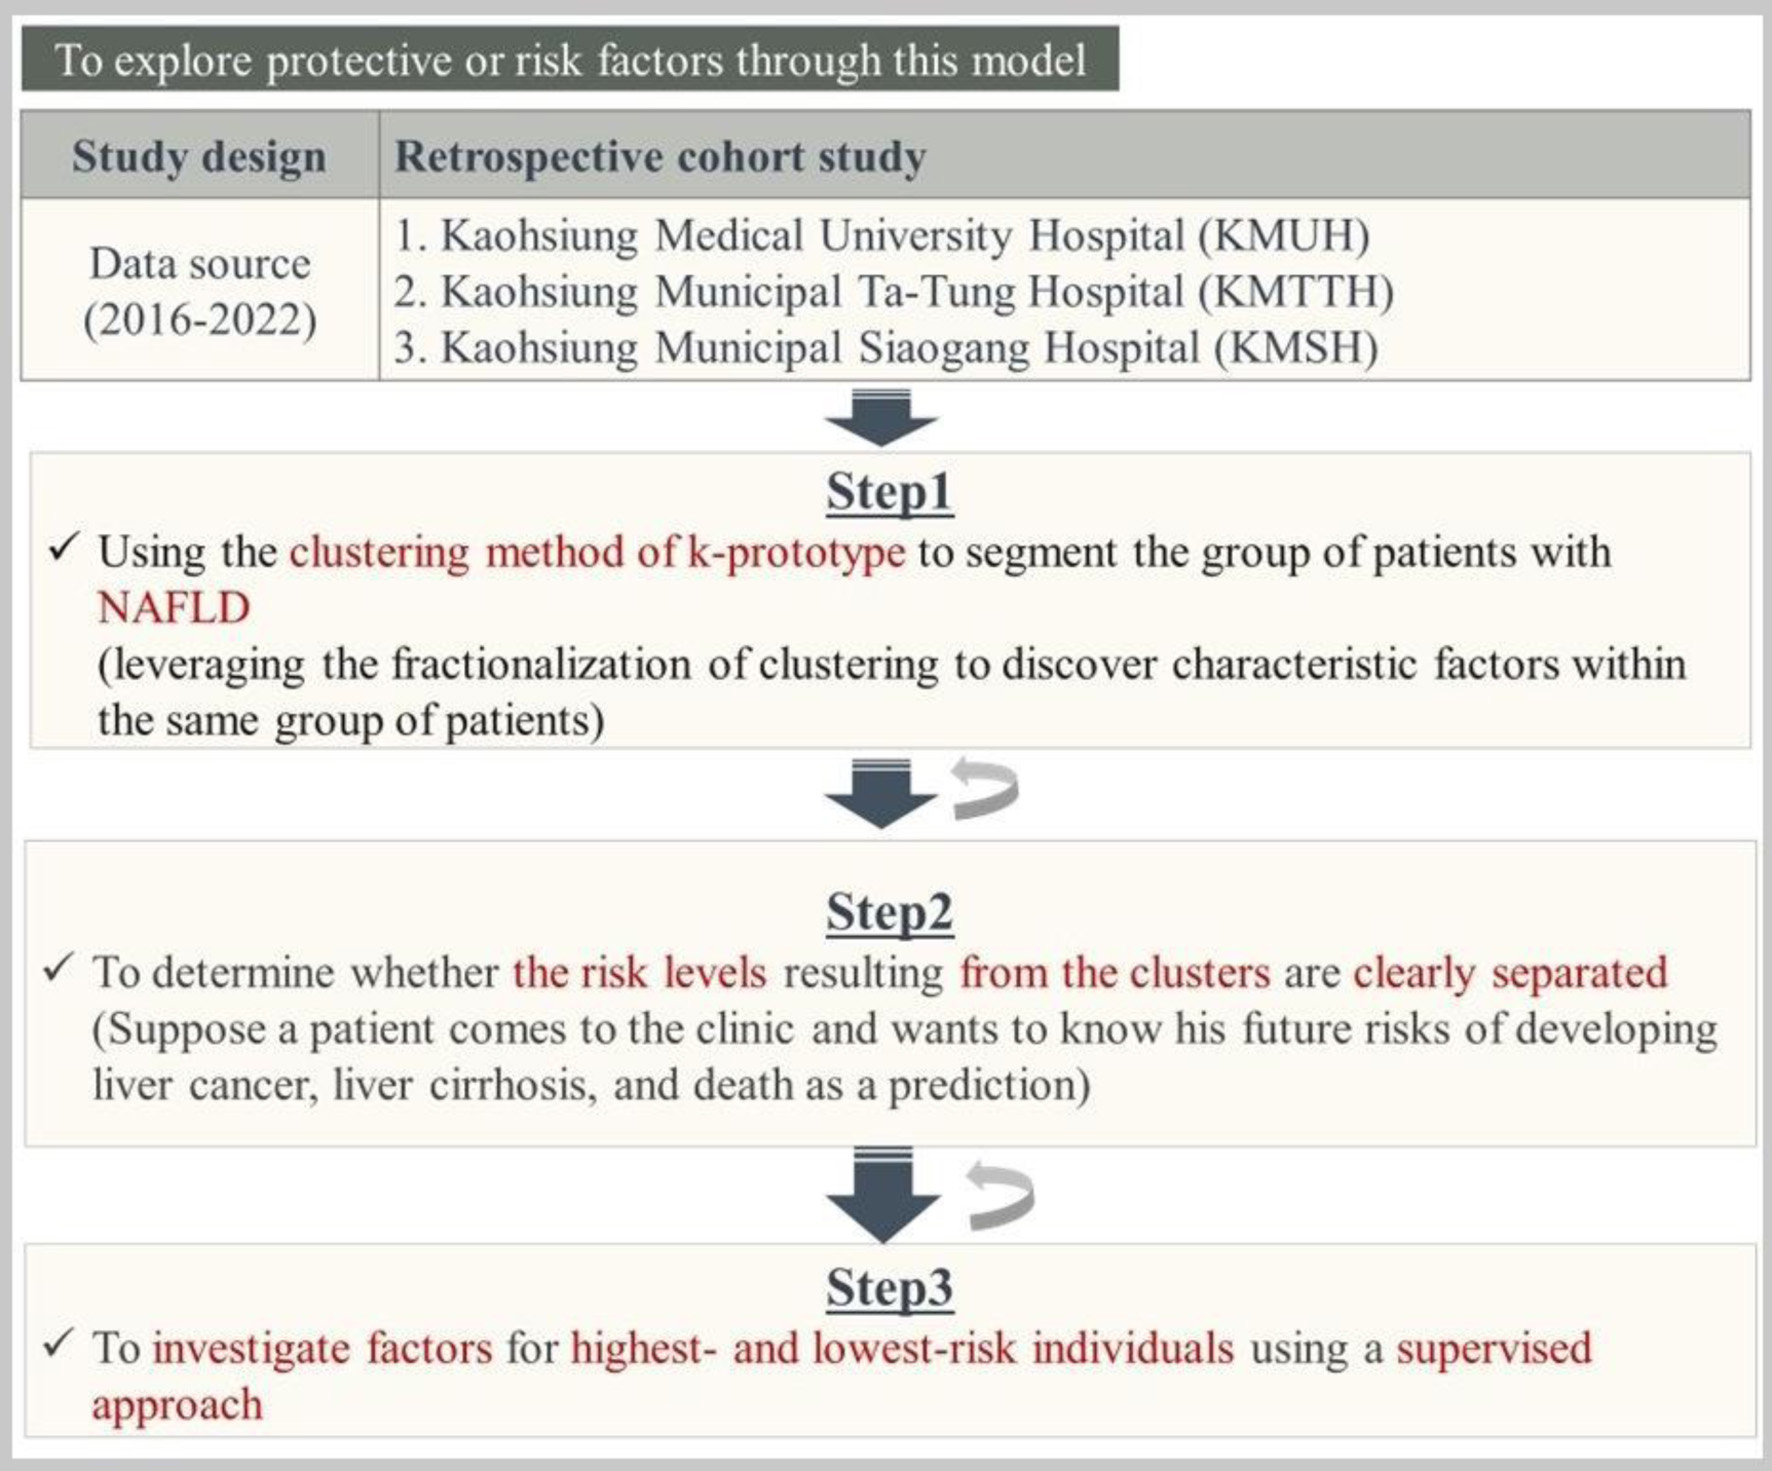
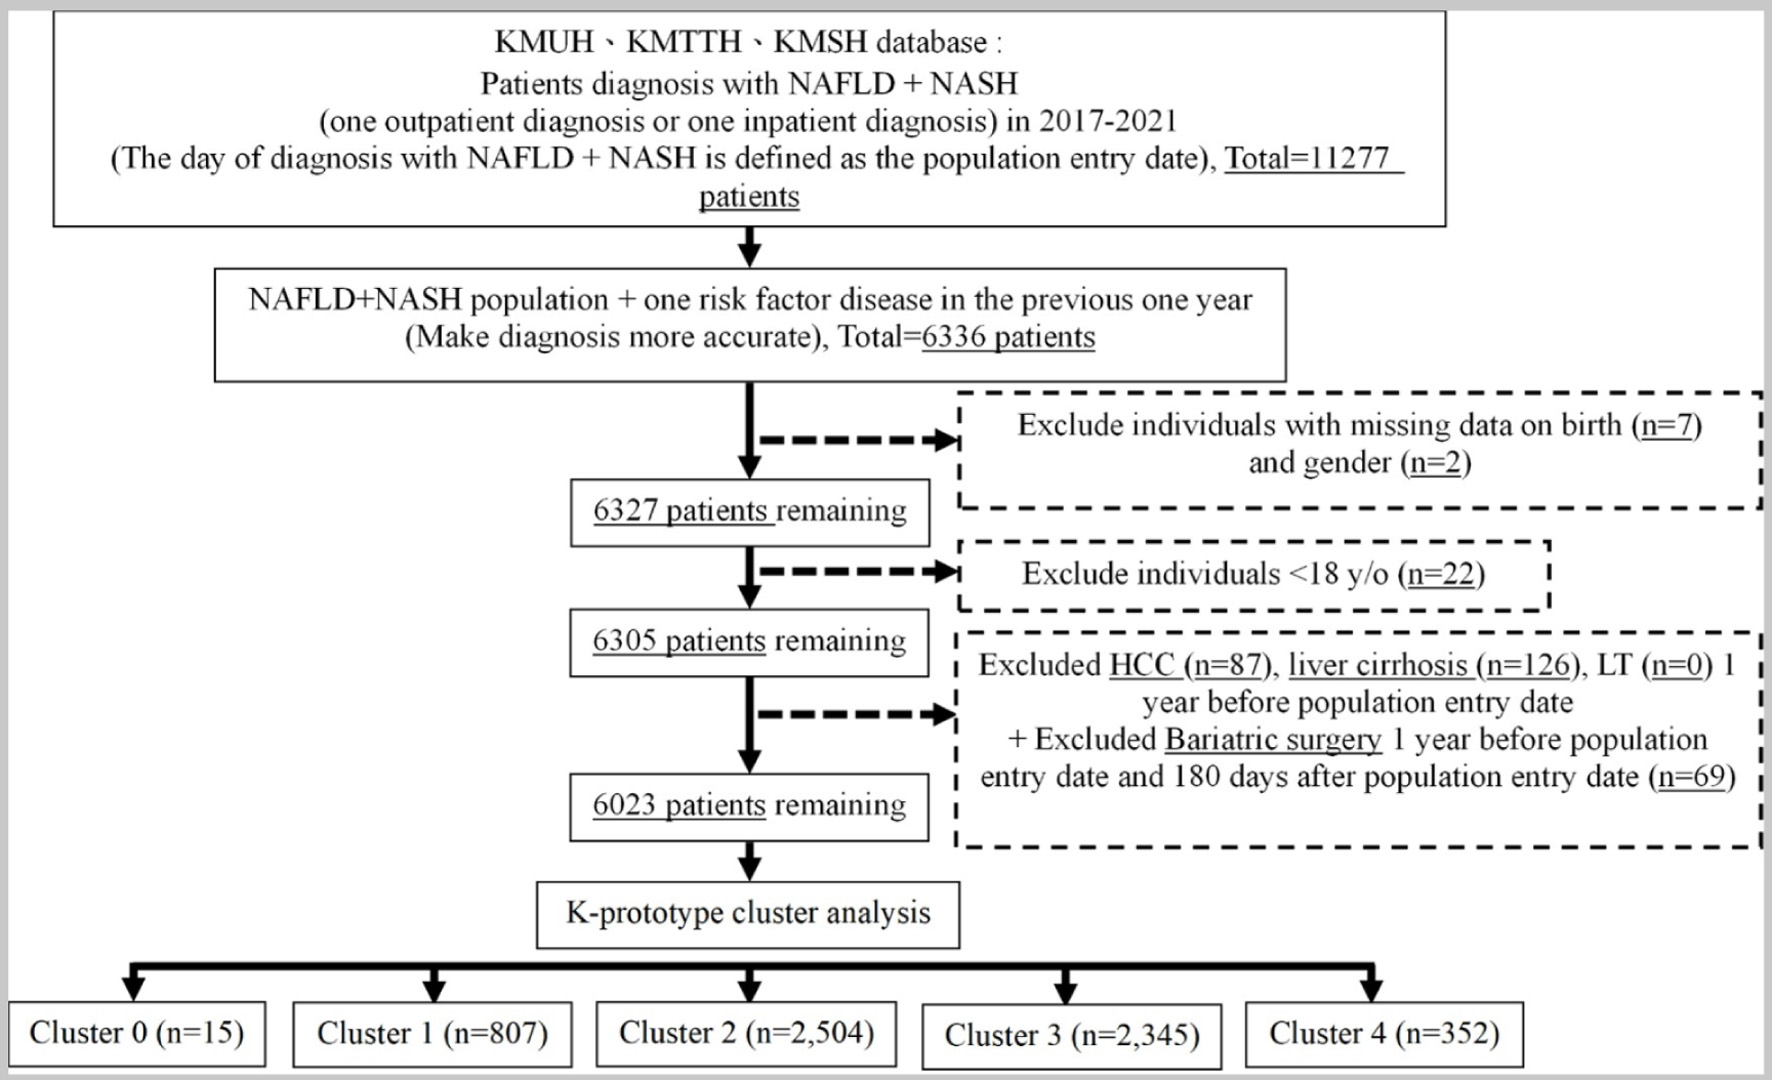
↓ Figure 1. The overall of the study methods.
| Journal of Clinical Medicine Research, ISSN 1918-3003 print, 1918-3011 online, Open Access |
| Article copyright, the authors; Journal compilation copyright, J Clin Med Res and Elmer Press Inc |
| Journal website https://jocmr.elmerjournals.com |
Original Article
Volume 18, Number 2, February 2026, pages 83-98
Investigating Factors Influencing Disease Progression in Patients With Non-Alcoholic Fatty Liver Disease
Figures
Tables
| Clinical endpoints | Clusters | Number of events | Follow-upa | Incidence rateb | Hazard ratio (95% CI) | |
|---|---|---|---|---|---|---|
| Crude | P-value | |||||
| aFollow-ups were presented by person-years. bIncidence rates were presented by per 10,000 person-years. CI: confidence interval; HCC: hepatocellular carcinoma; LC: liver cirrhosis. | ||||||
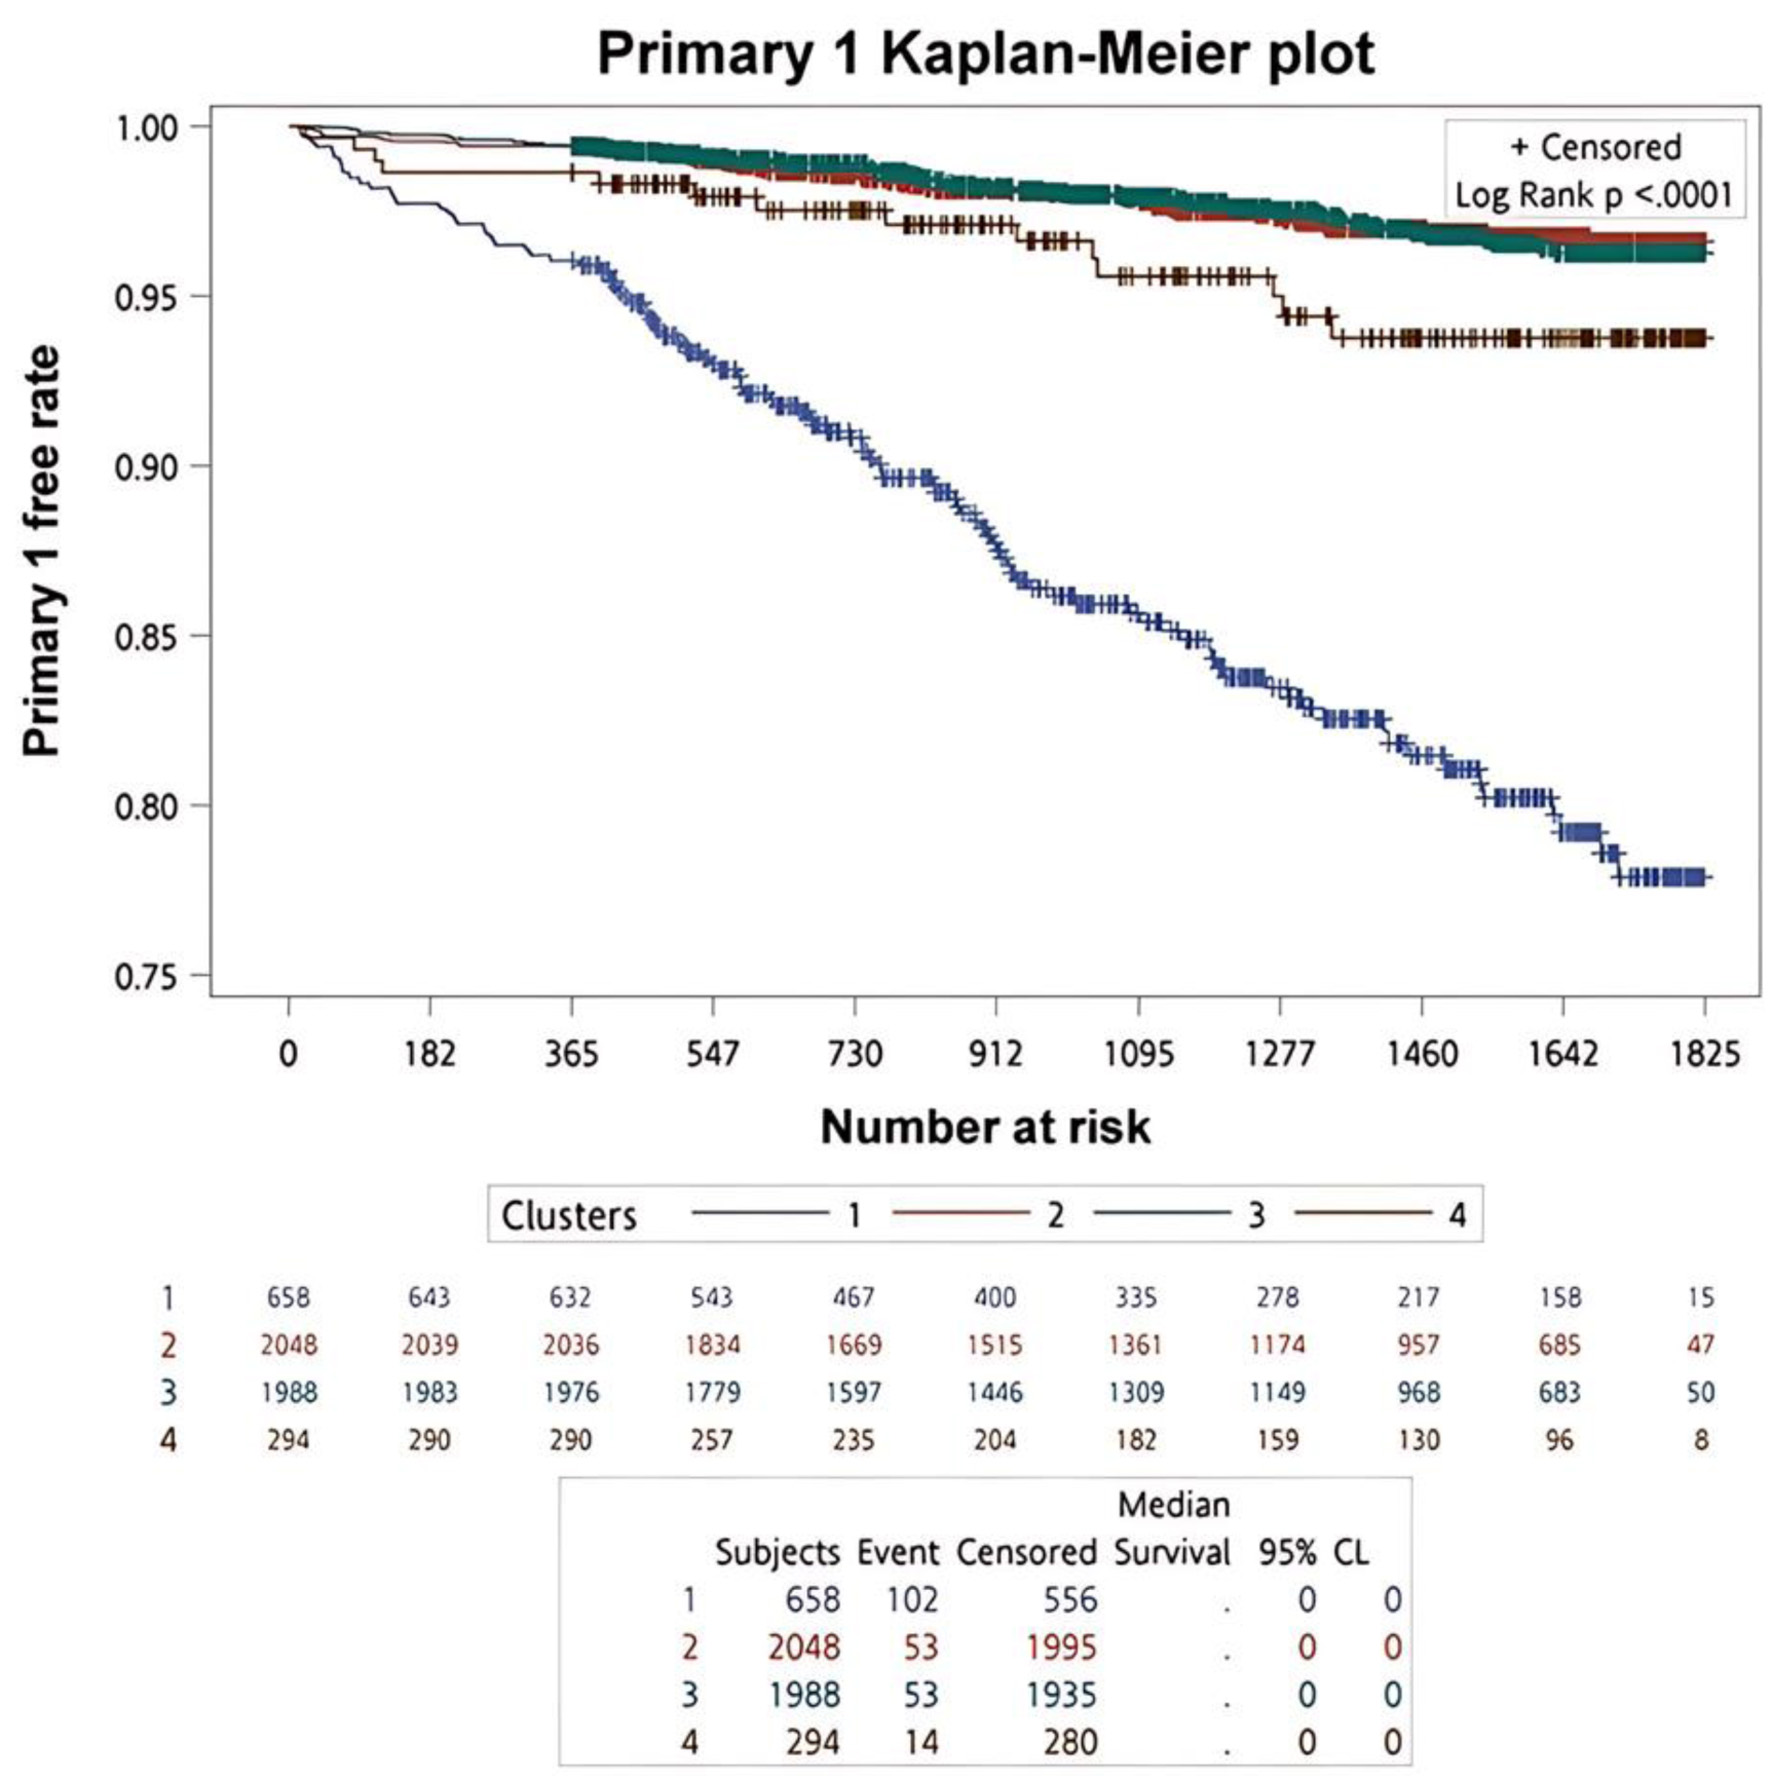
| Primary 1 | 2 | 53 | 7,171 | 73.91 | 1.000 (Reference) | - |
| 1 | 102 | 2,006 | 508.47 | 6.918 (4.963, 9.645) | < 0.0001 | |
| 3 | 53 | 7,001 | 75.70 | 1.027 (0.702, 1.502) | 0.8920 | |
| 4 | 14 | 1,002 | 139.72 | 1.896 (1.052, 3.417) | 0.0332 | |
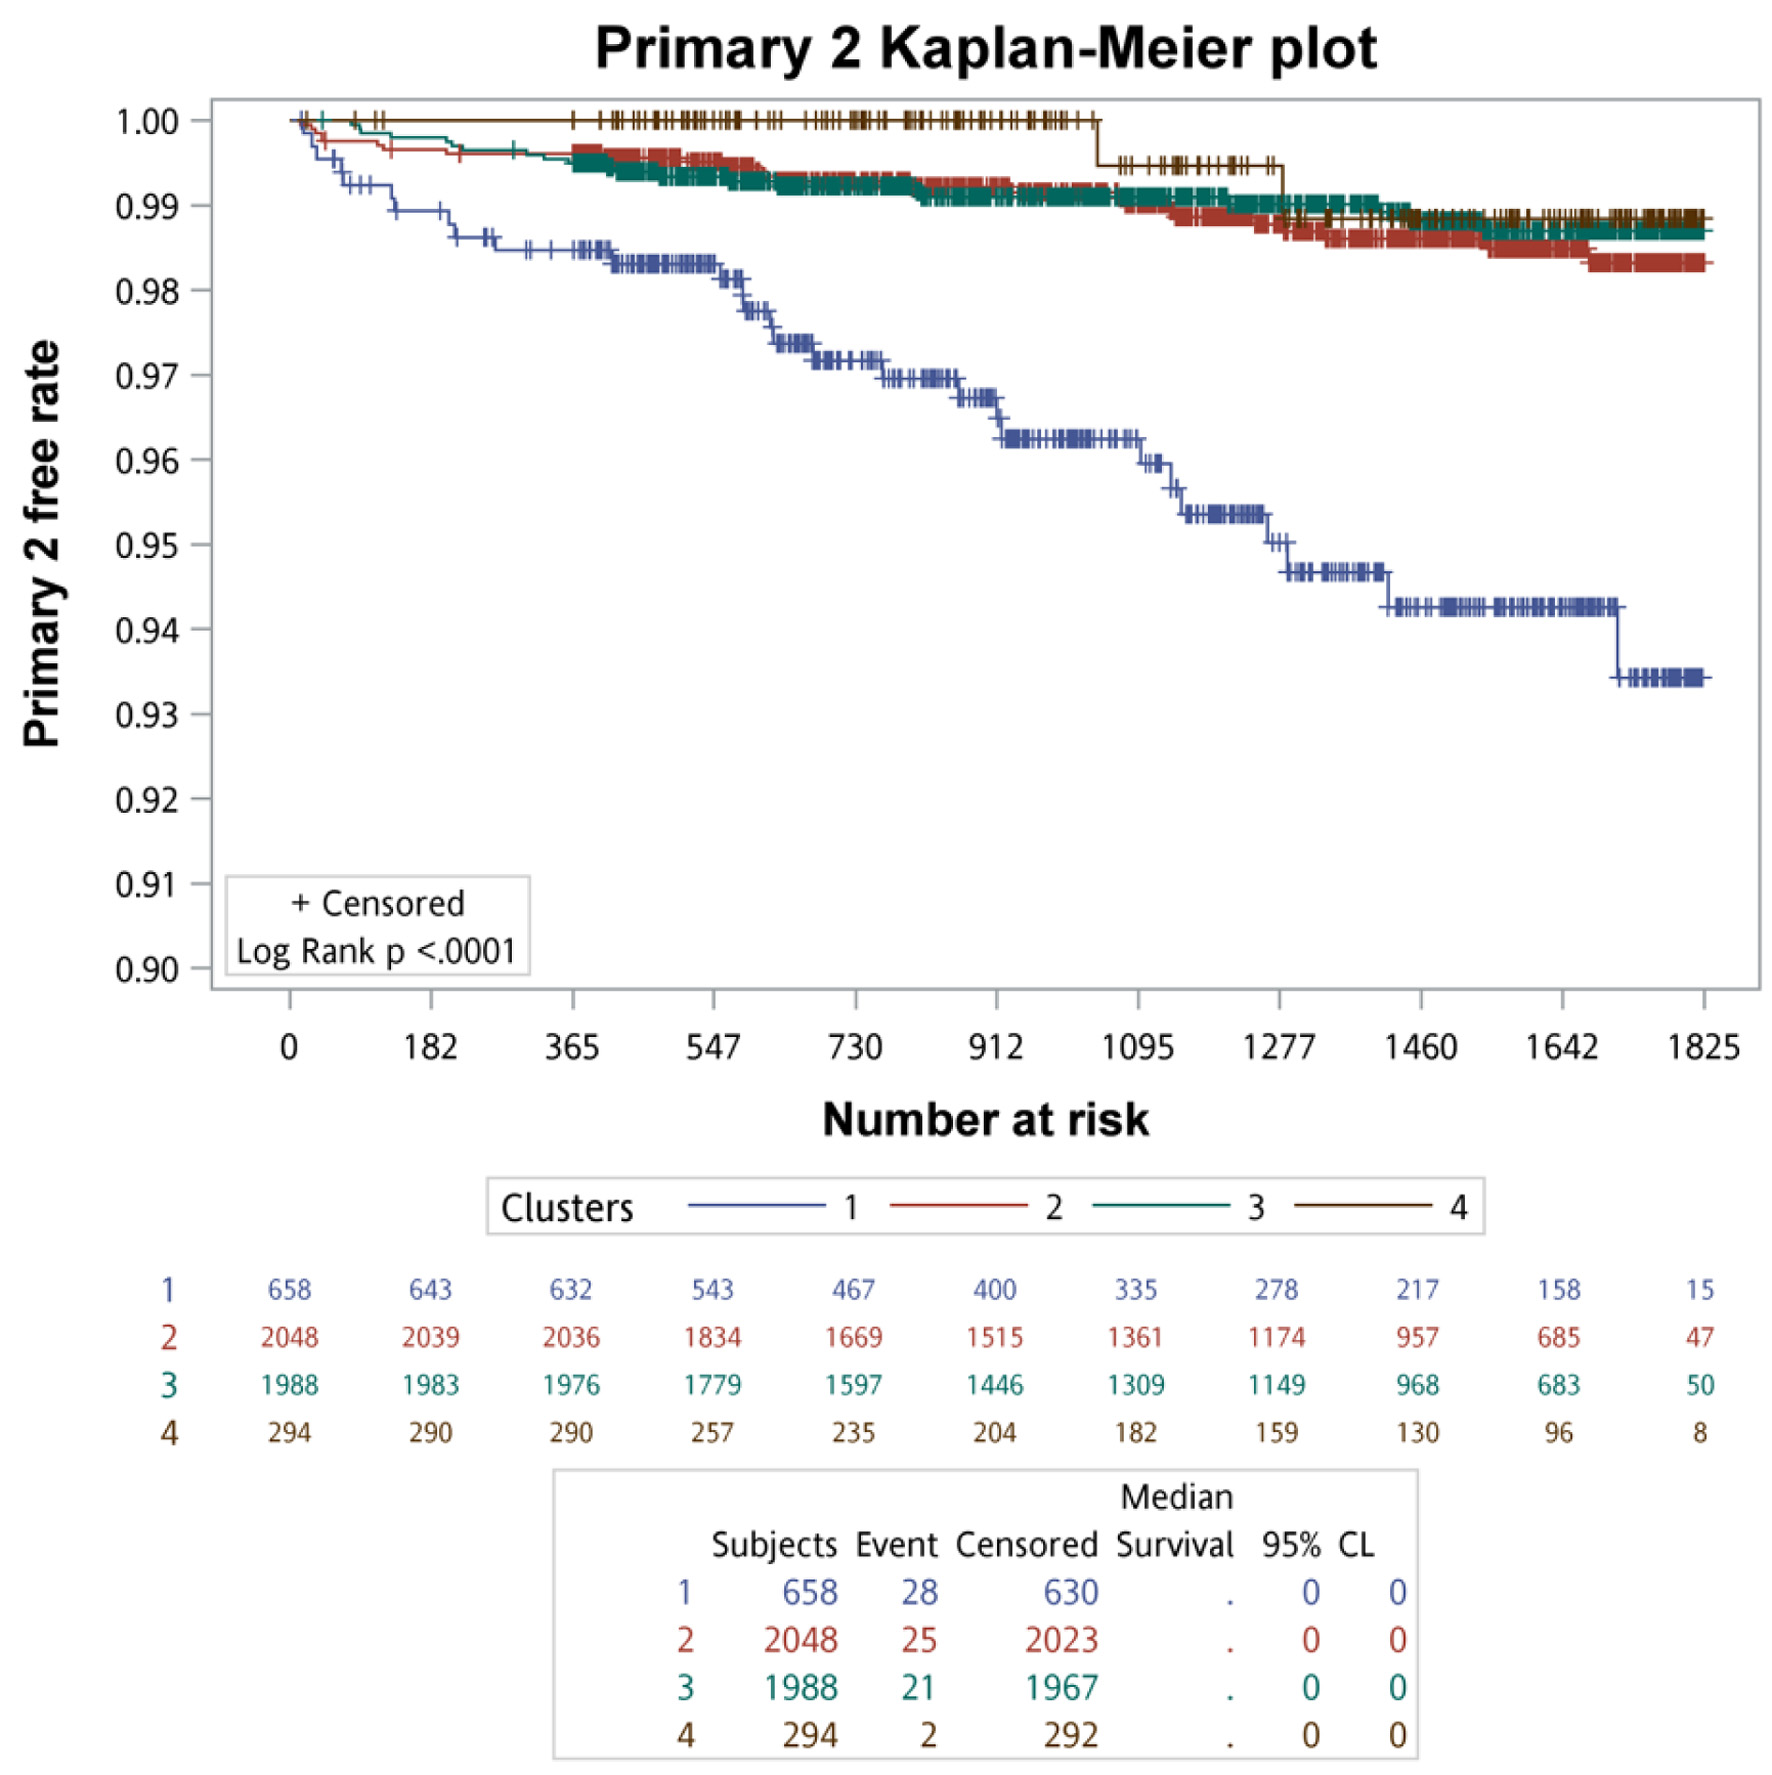
| Primary 2 | 2 | 25 | 7,171 | 34.86 | 1.000 (Reference) | - |
| 1 | 28 | 2,006 | 139.58 | 3.964 (2.310, 6.803) | < 0.0001 | |
| 3 | 21 | 7,001 | 30.00 | 0.861 (0.482, 1.539) | 0.6143 | |
| 4 | 2 | 1,002 | 19.96 | 0.572 (0.135, 2.414) | 0.4467 | |
| LC | 2 | 19 | 7,171 | 26.50 | 1.000 (Reference) | - |
| 1 | 18 | 2,006 | 89.73 | 3.320 (1.741, 6.331) | 0.0003 | |
| 3 | 14 | 7,001 | 20.00 | 0.756 (0.379, 1.507) | 0.4262 | |
| 4 | 2 | 1,002 | 19.96 | 0.750 (0.175, 3.219) | 0.6987 | |
| HCC | 2 | 6 | 7,210 | 8.32 | 1.000 (Reference) | - |
| 1 | 12 | 2,024 | 59.29 | 7.097 (2.661, 18.928) | < 0.0001 | |
| 3 | 8 | 7,032 | 11.38 | 1.370 (0.475, 3.950) | 0.5596 | |
| 4 | 1 | 1,00 | 9.97 | 1.200 (0.145, 9.972) | 0.8657 | |
| All-cause mortality | 2 | 32 | 7,219 | 44.33 | 1.000 (Reference) | - |
| 1 | 85 | 2,049 | 414.84 | 9.554 (6.360, 14.350) | < 0.0001 | |
| 3 | 33 | 7,052 | 46.80 | 1.056 (0.650, 1.718) | 0.8249 | |
| 4 | 13 | 1,005 | 129.35 | 2.934 (1.540, 5.589) | 0.0011 | |
| Liver-associated mortality | 2 | 2 | 7,219 | 2.77 | 1.000 (Reference) | - |
| 1 | 4 | 2,049 | 19.52 | 7.459 (1.364, 40.786) | 0.0204 | |
| 3 | 0 | 7,052 | 0.00 | NA | NA | |
| 4 | 0 | 1,005 | 0.00 | NA | NA | |
| Full model | Cluster 1 (n = 658) | Cluster 2 (n = 2,048) | Variables type | Odds ratio, 95% CI | P-value | Estimate (β) |
|---|---|---|---|---|---|---|
| Odds ratios for continuous variables are presented using clinically meaningful increments (e.g., per 10 units) to enhance clinical interpretability (except for hemoglobin (g/dL), for which a one-unit increment may be clinically substantial). BUN: blood urea nitrogen; CI: confidence interval; CRP: C-reactive protein; eGFR: estimated glomerular filtration rate; Hgb: hemoglobin; LDL-C: low-density lipoprotein cholesterol; PTTp: partial thromboplastin time, plasma; RDW-SD: red cell distribution width-standard deviation. | ||||||
| Intercept | 12.3011 | |||||
| Age (years) | 67.9 (59.70, 75.90) | 55.3 (43.65, 63.9) | Explanatory | 1.77 (1.51, 2.10) | < 0.0001 | 0.0576 |
| Chronic kidney disease | 137 (20.82) | 39 (1.90) | Explanatory | 4.521 (2.028, 10.074) | 0.0002 | 1.5086 |
| Other urinary system disease | 172 (26.14) | 49 (2.39) | Explanatory/exploratory | 6.894 (3.285, 14.470) | < 0.0001 | 1.9307 |
| Sodium chloride | 473 (71.88) | 378 (18.46) | Unknown/exploratory | 10.497 (6.750, 16.325) | < 0.0001 | 2.3511 |
| Metformin | 228 (34.65) | 307 (14.99) | Explanatory | 3.877 (2.382, 6.311) | < 0.0001 | 1.3551 |
| PTTp (s) | 27.75 (26.56, 29.58) | 27.62 (26.87, 28.70) | Explanatory/exploratory | 7.31 (3.98, 13.35) | < 0.0001 | 0.1988 |
| LDL-C (mg/dL) | 92.95 (71.00, 111.20) | 108.86 (92.45, 125.45) | Explanatory/exploratory | 0.75 (0.69, 0.82) | < 0.0001 | −0.0282 |
| pCO2 (mm Hg) | 40.98 (38.00, 43.80) | 42.24 (39.86, 44.44) | Explanatory/exploratory | 0.23 (0.15, 0.36) | < 0.0001 | −0.1475 |
| Glucose level (mg/dL) | 123 (104, 159) | 109 (101, 124) | Explanatory/exploratory | 1.23 (1.16, 1.29) | < 0.0001 | 0.0203 |
| CRP (mg/L) | 11.06 (3.18, 33.27) | 8.81 (3.59, 19.56) | Explanatory | 1.16 (1.08, 1.26) | < 0.0001 | 0.0152 |
| Total protein (mg/dL) | 17.8 (10.68, 34.56) | 16.42 (10.6, 30.2) | Explanatory/exploratory | 1.04 (1.01, 1.06) | 0.0026 | 0.00358 |
| Lymphocyte (%) | 21.83 (14.60, 27.20) | 27.34 (23.44, 30.96) | Explanatory/exploratory | 0.21 (0.15, 0.29) | < 0.0001 | −0.1564 |
| Hgb (g/dL) | 12.20 (11.00, 13.10) | 14.23 (13.50, 15.10) | Explanatory/exploratory | 0.175 (0.140, 0.220) | < 0.0001 | −1.7410 |
| RDW-SD (fL) | 43.40 (41.80, 45.60) | 42.25 (41.00, 43.52) | Explanatory/exploratory | 9.91 (4.66, 21.1) | < 0.0001 | 0.2298 |
| BUN (mg/dL) | 17.10 (13.00, 24.30) | 14.11 (12.22, 16.40) | Explanatory/exploratory | 2.79 (1.98, 3.87) | < 0.0001 | 0.1023 |
| eGFR (mL/min/1.73 m2) | 70.20 (48.80, 88.90) | 90.75 (77.30, 104.70) | Explanatory/exploratory | 0.78 (0.73, 0.85) | < 0.0001 | −0.0238 |
| Urine creatinine (mg/dL) | 108.68 (79.44, 143.70) | 126.28 (101.08, 151.46) | Explanatory/exploratory | 0.90 (0.86, 0.95) | < 0.0001 | −0.0100 |
| Variables | Variables type | Odds ratio, 95% CI | P-value | Estimate (β) |
|---|---|---|---|---|
| Odds ratios for continuous variables are presented using clinically meaningful increments (e.g., per 10 units) to enhance clinical interpretability (except for hemoglobin (g/dL), for which a one-unit increment may be clinically substantial). BUN: blood urea nitrogen; CKD: chronic kidney disease; CRP: C-reactive protein; eGFR: estimated glomerular filtration rate; Hgb: hemoglobin; LDL-C: low-density lipoprotein cholesterol; PTTp: partial thromboplastin time, plasma; RDW-SD: red cell distribution width-standard deviation. | ||||
| Intercept | 15.8739 | |||
| Age (years) | Explanatory | 1.77 (1.51, 2.10) | < 0.0001 | 0.0576 |
| CKD | Explanatory | 4.521 (2.028, 10.074) | 0.0002 | 0.7543 |
| Other urinary system disease | Explanatory/exploratory | 6.894 (3.285, 14.470) | < 0.0001 | 0.9653 |
| Sodium chloride | Unknown/exploratory | 10.497 (6.750, 16.325) | < 0.0001 | 1.1756 |
| Metformin | Explanatory | 3.877 (2.382, 6.311) | < 0.0001 | 0.6776 |
| PTTp (s) | Explanatory/exploratory | 7.31 (3.98, 13.35) | < 0.0001 | 0.1988 |
| LDL-C (mg/dL) | Explanatory/exploratory | 0.75 (0.69, 0.82) | < 0.0001 | −0.0282 |
| pCO2 (mm Hg) | Explanatory/exploratory | 0.23 (0.15, 0.36) | < 0.0001 | −0.1475 |
| Glucose level (mg/dL) | Explanatory/exploratory | 1.23 (1.16, 1.29) | < 0.0001 | 0.0203 |
| CRP (mg/L) | Explanatory | 1.16 (1.08, 1.26) | < 0.0001 | 0.0152 |
| Total protein (mg/dL) | Explanatory/exploratory | 1.04 (1.01, 1.06) | 0.0026 | 0.00358 |
| Lymphocyte (%) | Explanatory/exploratory | 0.21 (0.15, 0.29) | < 0.0001 | −0.1564 |
| Hgb (g/dL) | Explanatory/exploratory | 0.175 (0.140, 0.220) | < 0.0001 | −1.7410 |
| RDW-SD (fL) | Explanatory/exploratory | 9.91 (4.66, 21.1) | < 0.0001 | 0.2298 |
| BUN (mg/dL) | Explanatory/exploratory | 2.79 (1.98, 3.87) | < 0.0001 | 0.1023 |
| eGFR (mL/min/1.73 m2) | Explanatory/exploratory | 0.78 (0.73, 0.85) | < 0.0001 | −0.0238 |
| Urine creatinine (mg/dL) | Explanatory/exploratory | 0.90 (0.86, 0.95) | < 0.0001 | −0.0100 |
| New clusters (seven clusters) | Old clusters (five clusters) | |||||
|---|---|---|---|---|---|---|
| 0 | 1 | 2 | 3 | 4 | Total | |
| 0 | 11 | 0 | 0 | 0 | 0 | 11 |
| 0.18 | 0 | 0 | 0 | 0 | 0.18 | |
| 100 | 0 | 0 | 0 | 0 | ||
| 100 | 0 | 0 | 0 | 0 | ||
| 1 | 0 | 16 | 1,846 | 139 | 13 | 2,014 |
| 0 | 0.27 | 30.93 | 2.33 | 0.22 | 33.74 | |
| 0 | 0.79 | 91.66 | 6.9 | 0.65 | ||
| 0 | 2.04 | 73.99 | 5.97 | 3.71 | ||
| 2 | 0 | 0 | 0 | 0 | 315 | 315 |
| 0 | 0 | 0 | 0 | 5.28 | 5.28 | |
| 0 | 0 | 0 | 0 | 100 | ||
| 0 | 0 | 0 | 0 | 90 | ||
| 3 | 0 | 71 | 1 | 3 | 1 | 76 |
| 0 | 1.19 | 0.02 | 0.05 | 0.02 | 1.27 | |
| 0 | 93.42 | 1.32 | 3.95 | 1.32 | ||
| 0 | 9.03 | 0.04 | 0.13 | 0.29 | ||
| 4 | 0 | 505 | 173 | 193 | 8 | 879 |
| 0 | 8.46 | 2.9 | 3.23 | 0.13 | 14.73 | |
| 0 | 57.45 | 19.68 | 21.96 | 0.91 | ||
| 0 | 64.25 | 6.93 | 8.29 | 2.29 | ||
| 5 | 0 | 176 | 412 | 883 | 7 | 1,478 |
| 0 | 2.95 | 6.9 | 14.79 | 0.12 | 24.76 | |
| 0 | 11.91 | 27.88 | 59.74 | 0.47 | ||
| 0 | 22.39 | 16.51 | 37.95 | 2 | ||
| 6 | 0 | 18 | 63 | 1109 | 6 | 1,196 |
| 0 | 0.3 | 1.06 | 18.58 | 0.1 | 20.04 | |
| 0 | 1.51 | 5.27 | 92.73 | 0.5 | ||
| 0 | 2.29 | 2.53 | 47.66 | 1.71 | ||
| Total | 11 | 786 | 2495 | 2327 | 350 | 5,969 |
| 0.18 | 13.17 | 41.8 | 38.98 | 5.86 | 100 | |