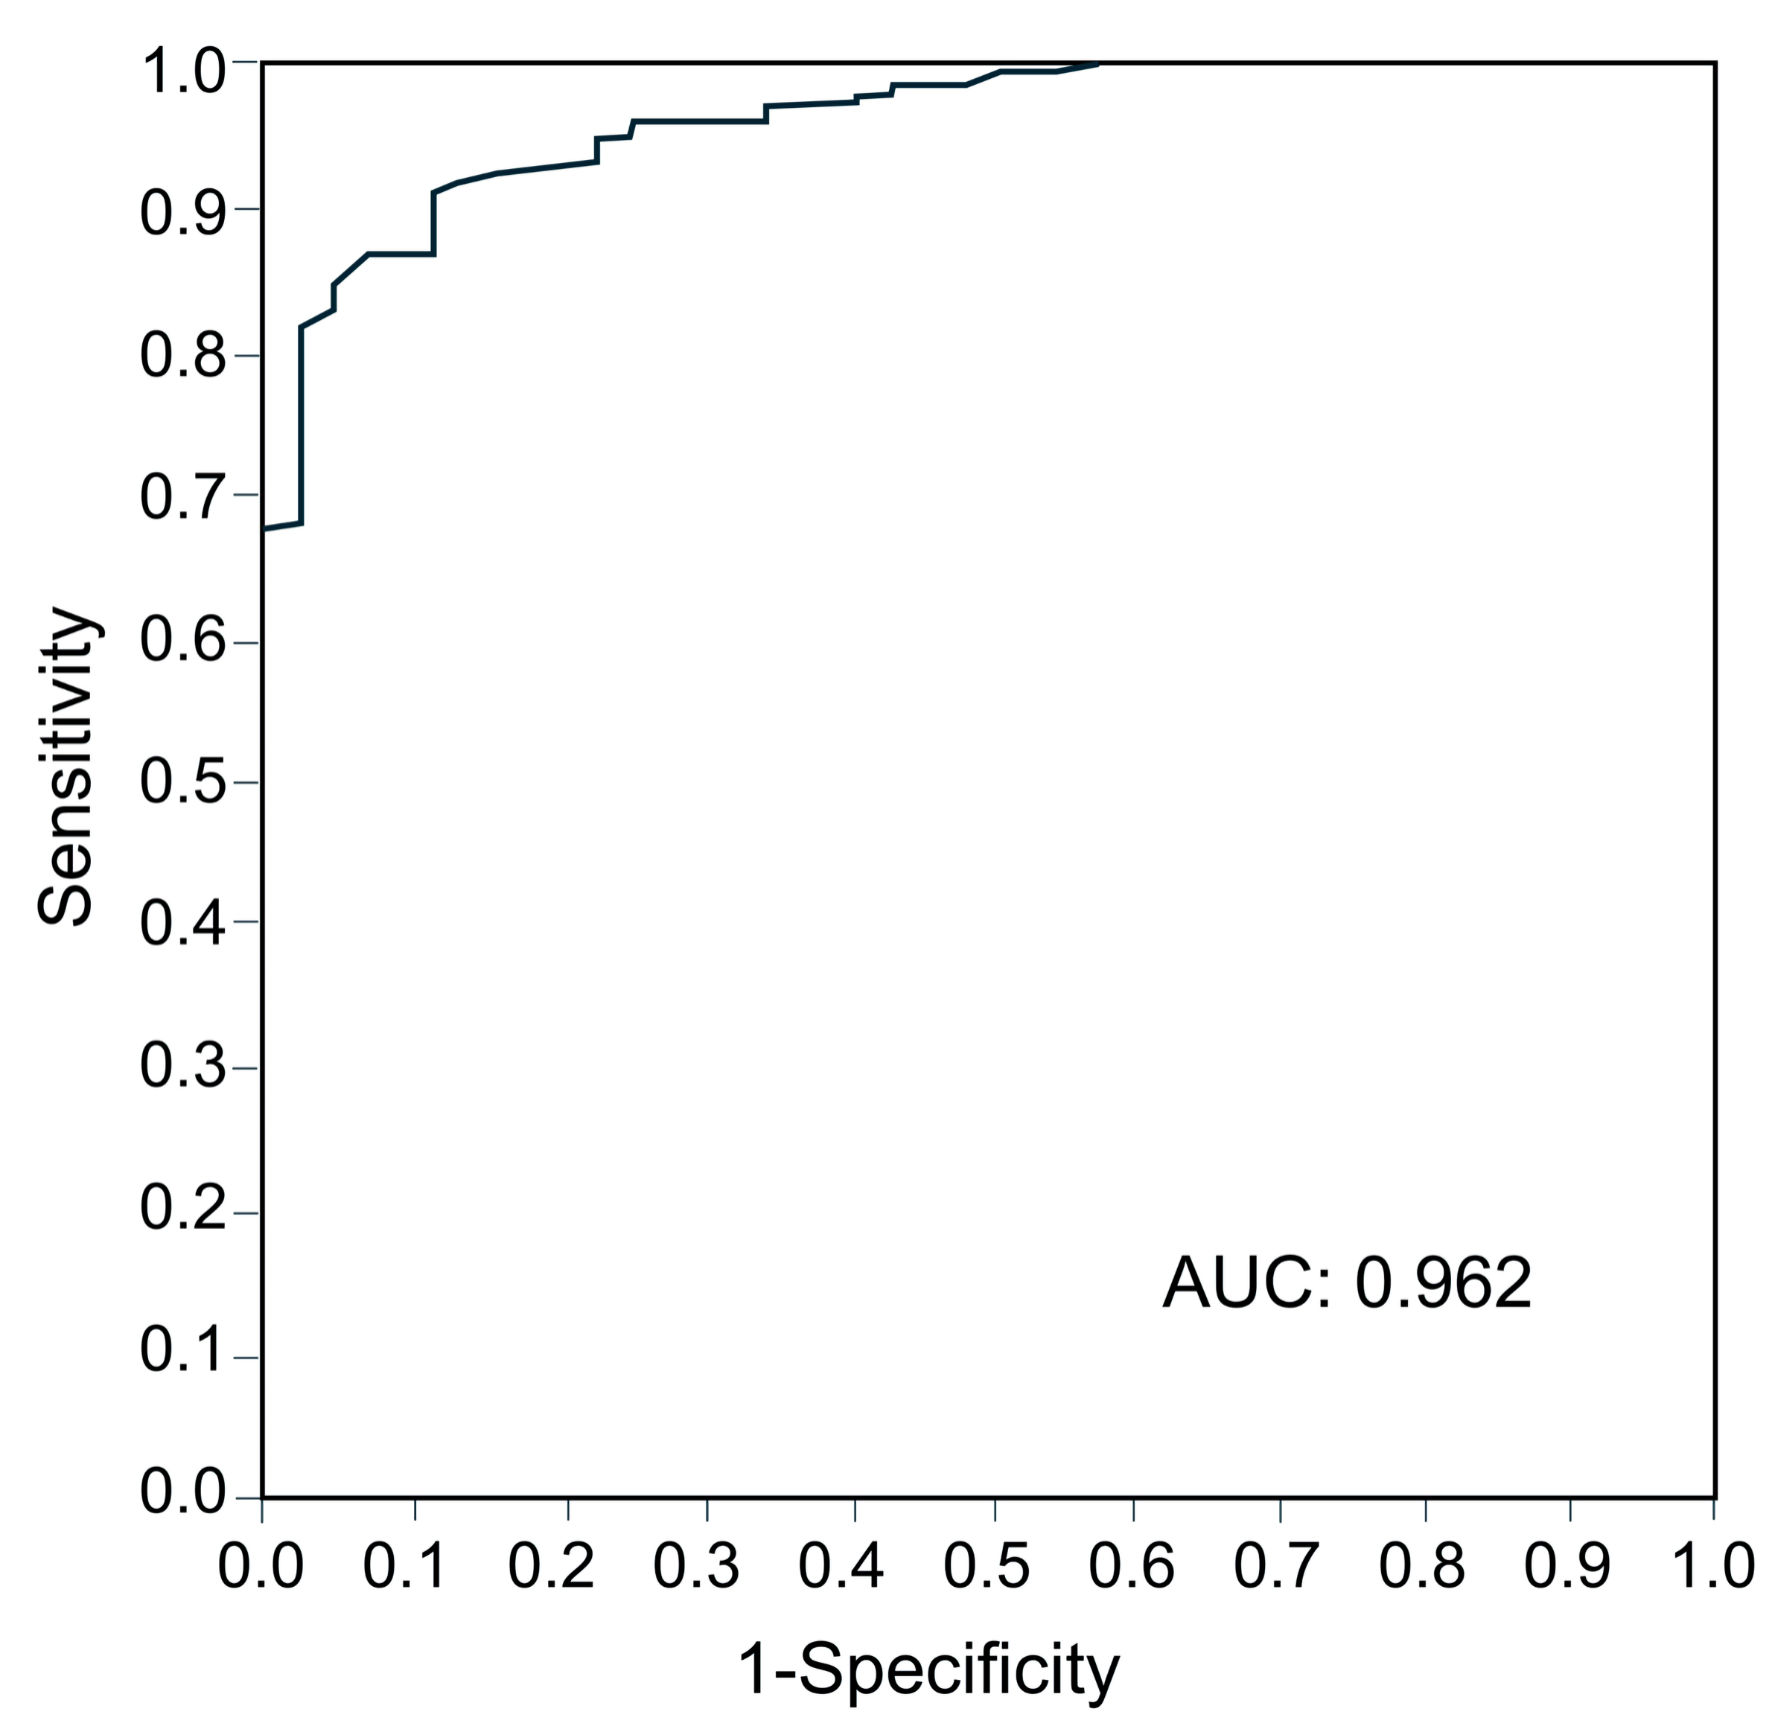
↓ Figure 1. Area under the receiver operating
characteristic curve for calculating the cutoff value of SFS for schizophrenia. AUC: area under the
curve; SFS: Social Functioning Scale.
| Journal of Clinical Medicine Research, ISSN 1918-3003 print, 1918-3011 online, Open Access |
| Article copyright, the authors; Journal compilation copyright, J Clin Med Res and Elmer Press Inc |
| Journal website https://jocmr.elmerjournals.com |
Original Article
Volume 18, Number 1, January 2026, pages 1-8
Assessment of Social Functioning in Patients With Schizophrenia and Their First-Degree Relatives
Figures
Tables
| Total (n = 256) | SCZ (n = 44) | FR (n = 26) | HC (n = 186) | P | |
|---|---|---|---|---|---|
| SCZ: schizophrenia; FR: first-degree relatives; HC: healthy controls; JART: Japan Adult Reading Test, SFS: Social Functioning Scale. | |||||
| Sex (male), n (%) | 96 (37.5%) | 17 (38.6%) | 6 (23.1%) | 73 (39.2%) | 0.2761 |
| Age (years), mean ± SD | 48.0 ± 16.0 | 52.7 ± 13.7 | 68.3 ± 11.1 | 44.0 ± 14.6 | < 0.0001 |
| Educational history (years), mean ± SD | 13.5 ± 2.2 | 12.3 ± 2.0 | 12.4 ± 1.8 | 13.9 ± 2.1 | < 0.0001 |
| JART50, mean ± SD | 106.3 ± 9.2 | 98.3 ± 11.5 | 105.0 ± 10.3 | 108.3 ± 7.2 | < 0.0001 |
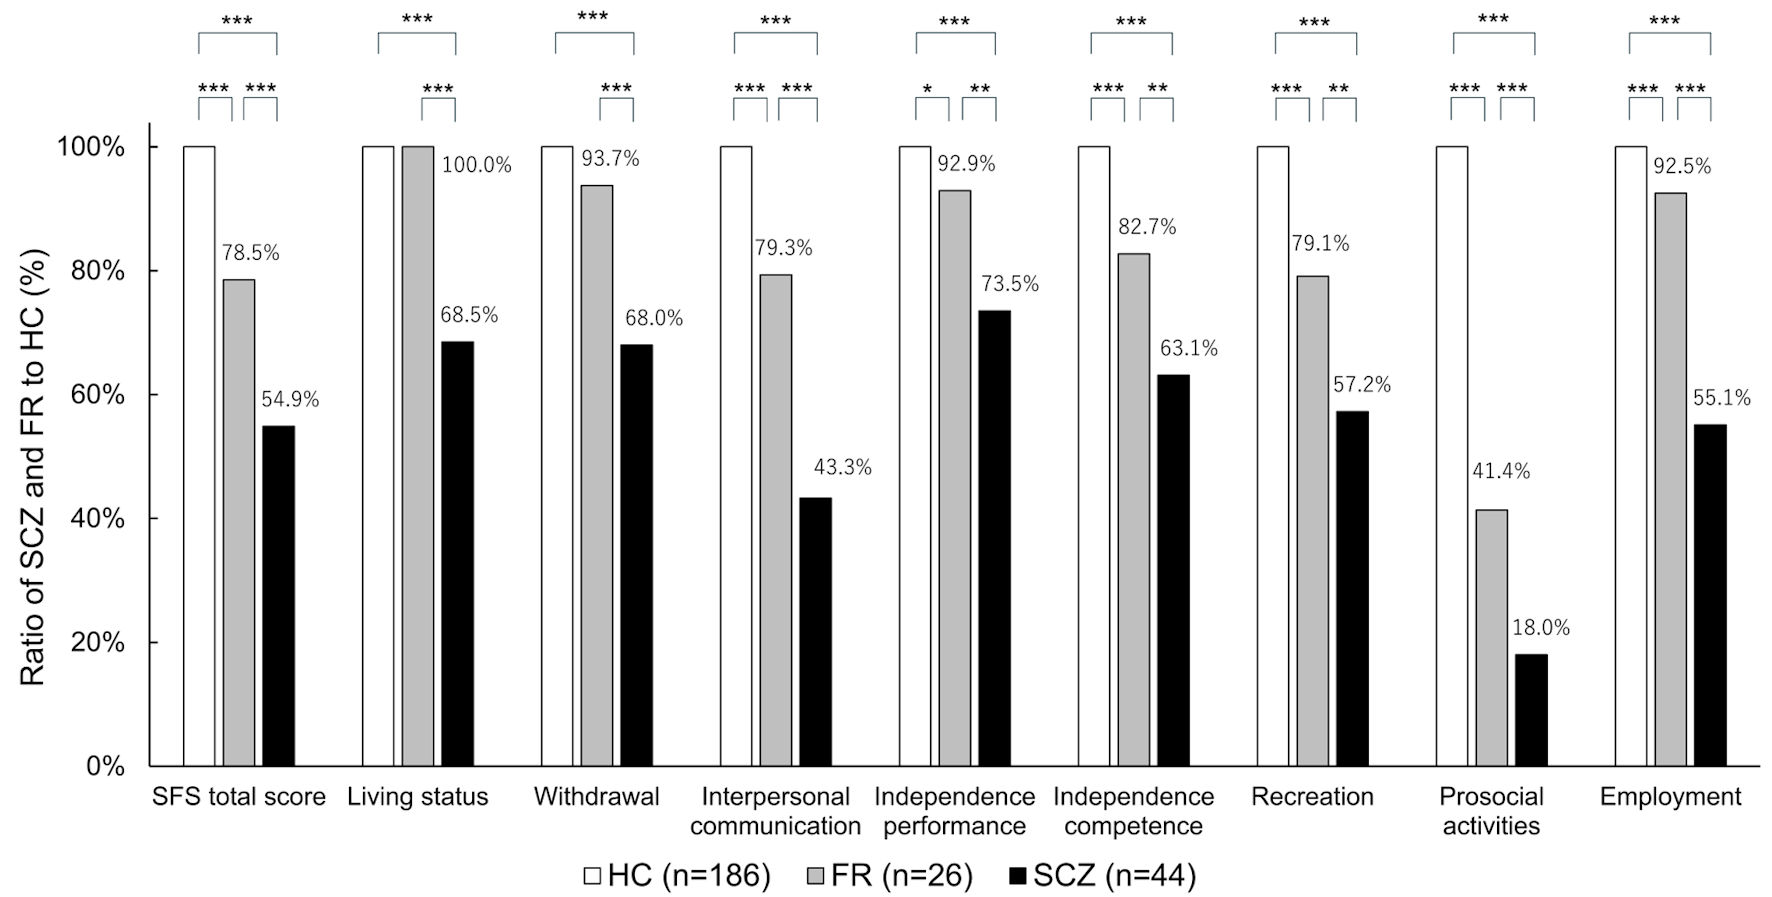
| SFS total score, mean ± SD | 149.2 ± 36.2 | 90.9 ± 36.5 | 130.1 ± 24.6 | 165.7 ± 16.8 | < 0.0001 |
| Estimate | SE | t value | P | |
|---|---|---|---|---|
| Model: P < 0.0001, R2 = 0.700. ANCOVA: analysis of covariance; HC: healthy controls; FR: first-degree relatives; SCZ: schizophrenia; SE: standard error; JART: Japan Adult Reading Test. | ||||
| Group (HC) | 29.71 | 2.32 | 12.8 | < 0.0001 |
| Group (FR) | –1.21 | 3.25 | –0.37 | 0.711 |
| Group (SCZ) | –28.5 | 2.88 | –9.9 | < 0.0001 |
| Age | –0.12 | 0.09 | –1.25 | 0.2113 |
| Educational history | 1.95 | 0.66 | 2.97 | 0.0033 |
| JART50 | 0.40 | 0.18 | 2.23 | 0.0269 |
| Sex (male) | –3.38 | 1.34 | –2.52 | 0.0123 |
| Sex (female) | 3.38 | 1.34 | 2.52 | 0.0123 |
| Difference in SFS total score ± SE | P | |
|---|---|---|
| ANCOVA: analysis of covariance; SCZ: schizophrenia; FR: first-degree relatives; HC: healthy controls. | ||
| Difference between SCZ and FR | –27.3 ± 5.7 | 0.0067 |
| Difference between FR and HC | –30.9 ± 4.9 | 0.0004 |
| Difference between SCZ and HC | –58.2 ± 4.1 | < 0.0001 |
| SCZ (n = 44) | Other than SCZ (n = 212) | Sensitivity | Specificity | |
|---|---|---|---|---|
| SCZ: schizophrenia; Other than SCZ: first-degree relatives and healthy controls; SFS: Social Functioning Scale total score. | ||||
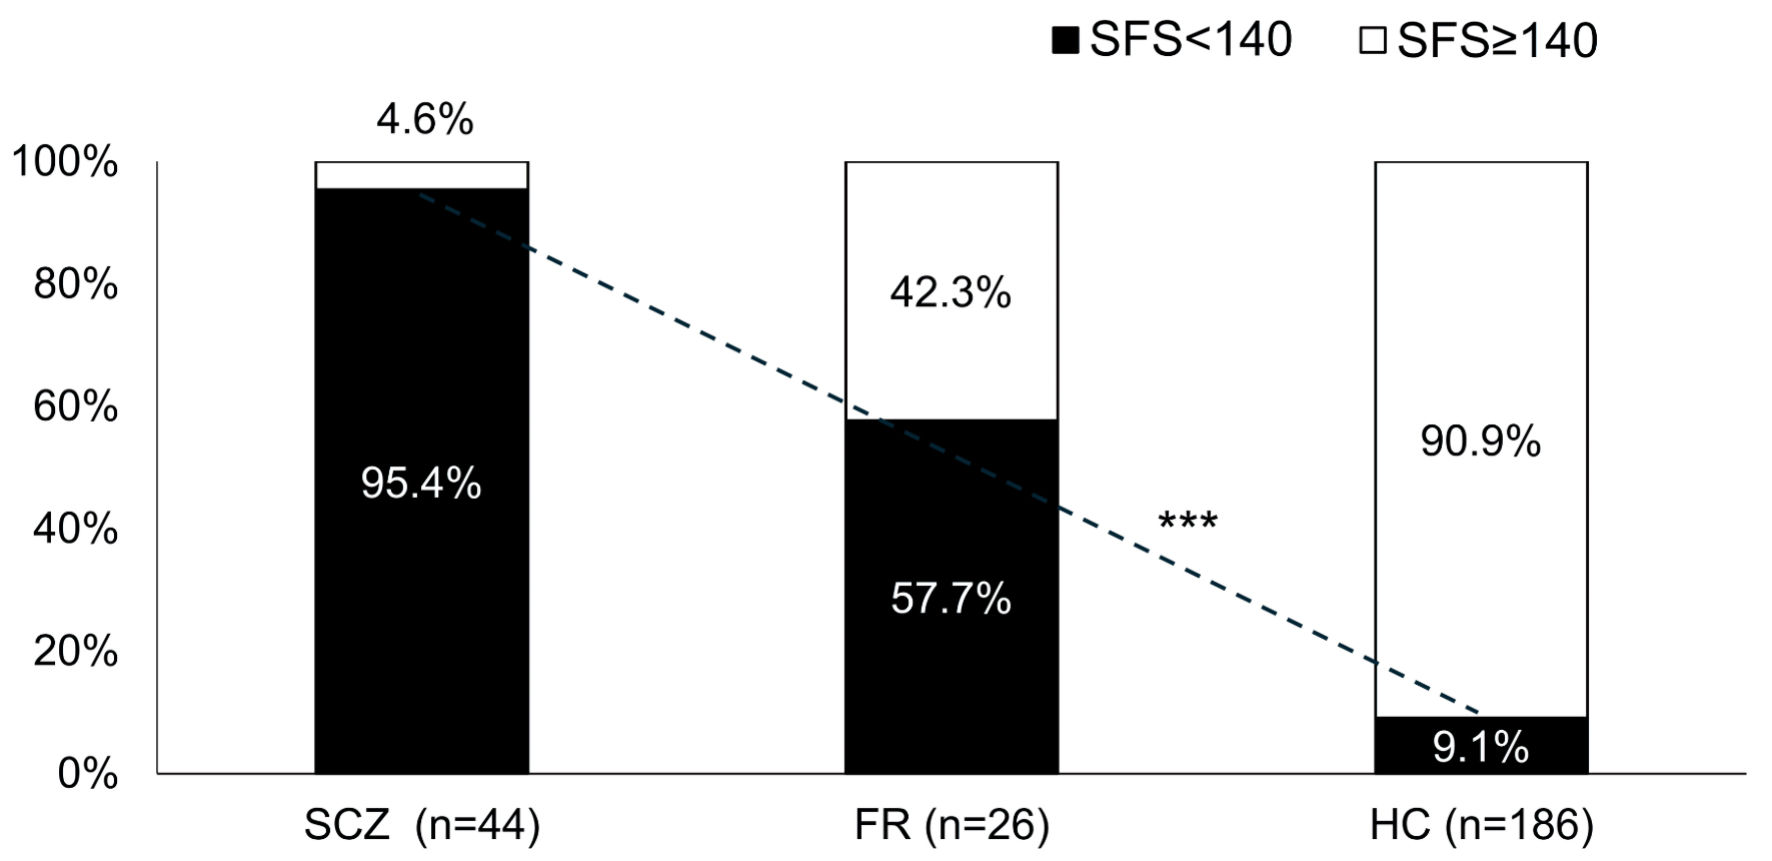
| SFS < 140 | 42 (95.5%) | 32 (15.1%) | 0.954 | 0.849 |
| SFS ≥ 140 | 2 (4.5%) | 180 (84.9%) | ||