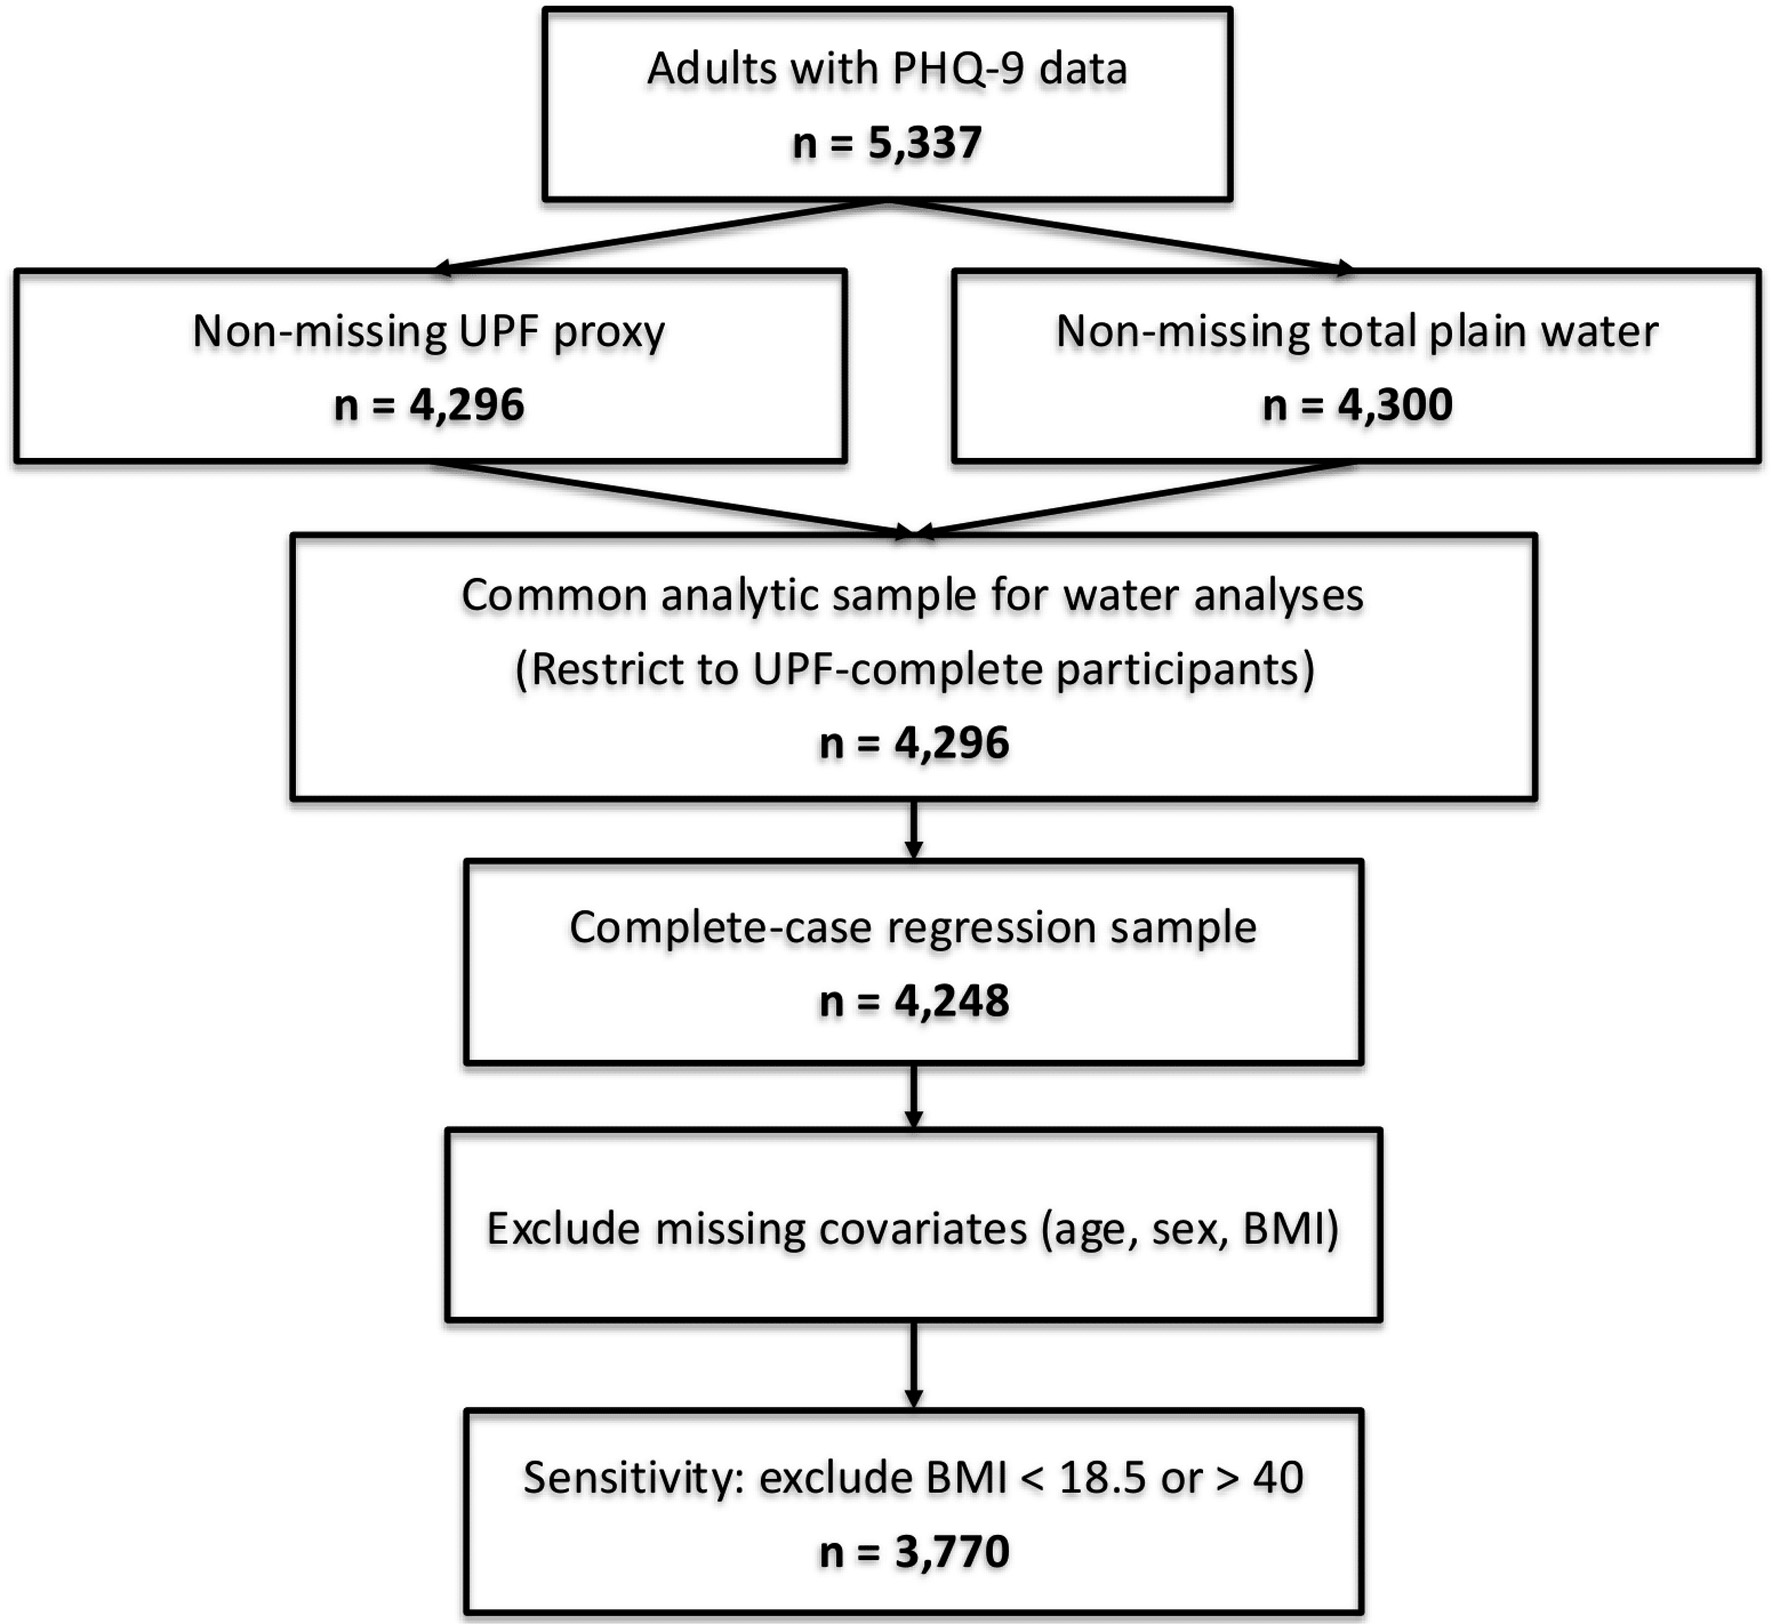
↓ Figure 1. STROBE flow diagram (NHANES
2021–2023).
| Journal of Clinical Medicine Research, ISSN 1918-3003 print, 1918-3011 online, Open Access |
| Article copyright, the authors; Journal compilation copyright, J Clin Med Res and Elmer Press Inc |
| Journal website https://jocmr.elmerjournals.com |
Original Article
Volume 18, Number 2, February 2026, pages 107-119
Dietary Behavior and Risk of Depression: Effects of Ultra-Processed Food and Water Intake in a National Sample of the United States
Figures
Tables
| Variable | Participants (n = 4,248) |
|---|---|
| BMI: body mass index; CI: confidence interval; n: number of subjects; PHQ-9: Patient Health Questionnaire-9; UPF: ultra-processed food. | |
| Age (years), mean (CI) | 50.8 (50.2–51.5) |
| Cigarette smoking, % (CI) | 14.1 (11.9–16.3) |
| Alcohol drinking, % (CI) | 18.5 (16.6–20.3) |
| Gender (males), % (CI) | 43.8 (42.4–45.4) |
| BMI (kg/m2), mean (CI) | 30.1 (29.8–30.5) |
| PHQ-9 score, mean (CI) | 3.61 (3.50–3.73) |
| PHQ-9–based depression prevalence, % (CI) | 10.9 (10.0–11.8) |
| UPF intake: % daily calories from added sugar, mean (CI) | 4.81 (4.74–4.88) |
| Water intake (g/day), mean (CI) | 2,743 (2,652–2,835) |
| UPF quartile | Unweighted frequency (n, %) | Weighted frequency (n, %) | Water quartile | Unweighted frequency (n, %) | Weighted frequency (n, %) |
|---|---|---|---|---|---|
| n: number of subjects; UPF: ultra-processed food. | |||||
| 1 | 1,134 (26.4) | 36,144,482 (27.9) | 1 | 966 (22.5) | 26,910,211 (20.7) |
| 2 | 1,079 (25.1) | 32,235,216 (24.9) | 2 | 1,063 (24.7) | 30,063,451 (23.2) |
| 3 | 1,069 (24.9) | 31,326,899 (24.2) | 3 | 1,061 (24.7) | 33,138,565 (25.5) |
| 4 | 1,014 (23.6) | 29,974,104 (23.1) | 4 | 1,210 (28.1) | 39,731,508 (30.6) |
| Total | 4,296 | 129,680,701 (100) | Total | 4,300 | 129,843,735 (100) |
| UPF quartile | Depression (%) | Water quartile | Depression (%) |
|---|---|---|---|
| PHQ-9: Patient Health Questionnaire-9; UPF: ultra-processed food. | |||
| 1 | 10.7 | 1 | 15.4 |
| 2 | 8.7 | 2 | 9.0 |
| 3 | 10.7 | 3 | 10.2 |
| 4 | 15.4 | 4 | 10.9 |
| Predictor | β estimate | t value | P value |
|---|---|---|---|
| aStandardized β = +0.19 in sensitivity model. bRounded to 0.00 from SPSS output. BMI: body mass index; PHQ-9: Patient Health Questionnaire-9; UPF: ultra-processed food. | |||
| UPF intake | +0.17a | 4.51 | < 0.0001 |
| Water intake (g/day) | 0.00b | –3.23 | 0.0012 |
| Age (years) | –0.04 | –9.39 | < 0.0001 |
| Male (sex) | –0.79 | –5.00 | < 0.0001 |
| BMI (kg/m2) | +0.05 | 3.98 | < 0.0001 |
| UPF × water intake interaction | –0.07 | –2.38 | 0.017 |
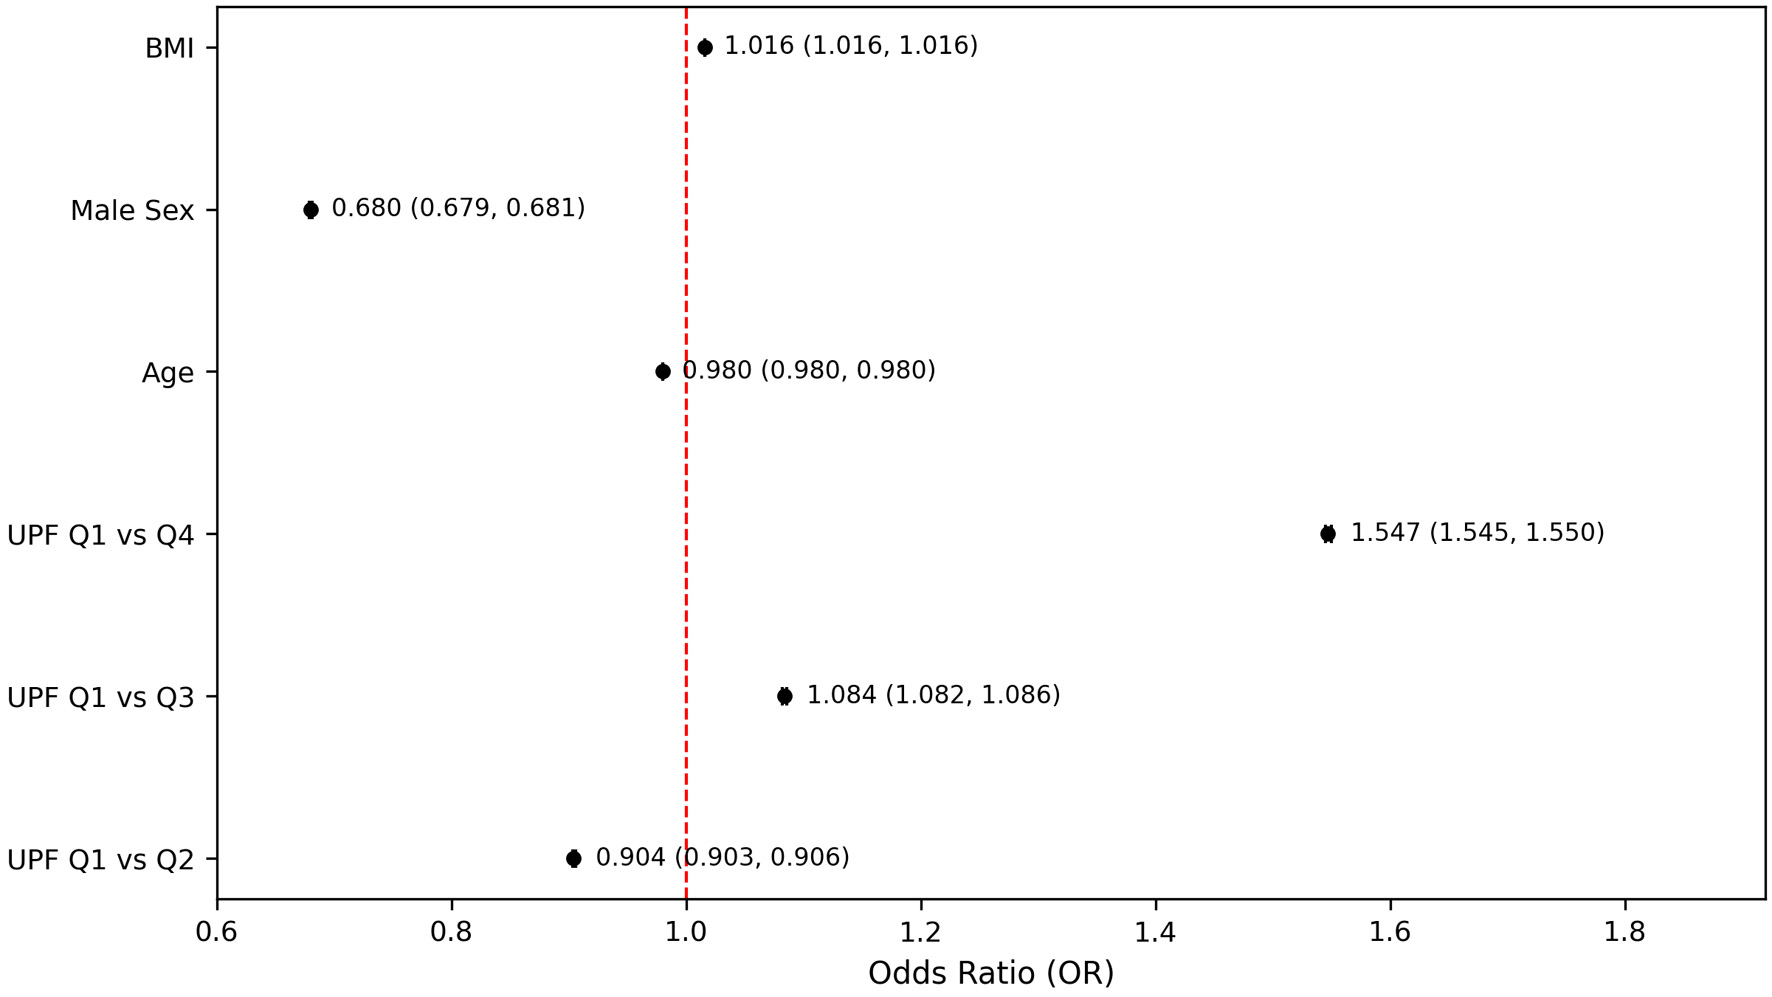
| Variable | P-value | OR (Exp(B)) | 95% CI |
|---|---|---|---|
| BMI: body mass index; CI: confidence interval; OR: odds ratio; UPF: ultra-processed food. | |||
| Age | < 0.001 | 0.978 | 0.978–0.978 |
| Male (vs. female) | < 0.001 | 0.618 | 0.617–0.619 |
| BMI | < 0.001 | 1.021 | 1.020–1.021 |
| Drinking alcohol vs. no alcohol | < 0.001 | 0.640 | 0.638–0.641 |
| Smoking status | |||
| Never vs. current | < 0.001 | 2.365 | 2.361–2.369 |
| Never vs. former | < 0.001 | 1.257 | 1.255–1.259 |
| UPF quartile | |||
| Q2 vs. Q1 | < 0.001 | 0.926 | 0.925–0.928 |
| Q3 vs. Q1 | < 0.001 | 1.115 | 1.113–1.117 |
| Q4 vs. Q1 | < 0.001 | 1.493 | 1.491–1.495 |
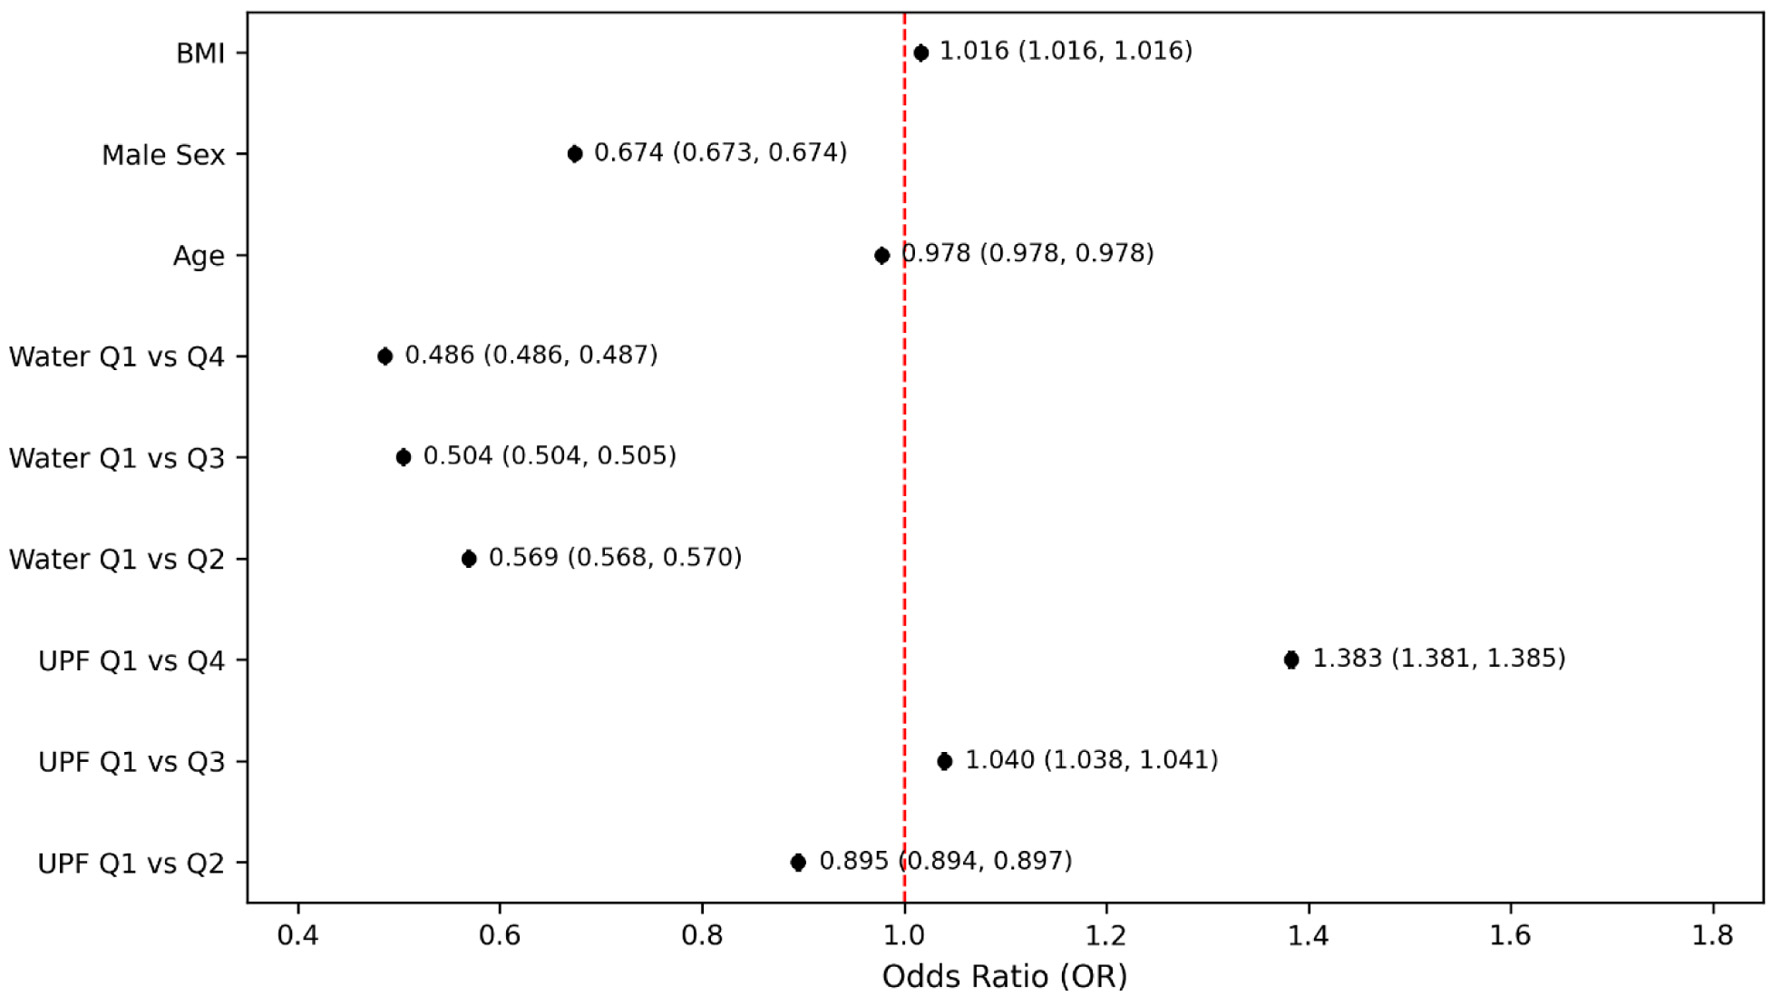
| Variable | P-value | OR (Exp(B)) | 95% CI |
|---|---|---|---|
| BMI: body mass index; CI: confidence interval; OR: odds ratio; UPF: ultra-processed food. | |||
| Age | < 0.001 | 0.976 | 0.976–0.976 |
| Male (vs. female) | < 0.001 | 0.620 | 0.619–0.620 |
| BMI | < 0.001 | 1.020 | 1.020–1.020 |
| Drinking alcohol vs. no alcohol | < 0.001 | 0.664 | 0.663–0.665 |
| Smoking status | |||
| Never vs. current | < 0.001 | 2.161 | 2.157–2.164 |
| Never vs. former | < 0.001 | 1.256 | 1.254–1.258 |
| UPF quartile | |||
| Q2 vs. Q1 | < 0.001 | 0.911 | 0.910–0.913 |
| Q3 vs. Q1 | < 0.001 | 1.065 | 1.063–1.067 |
| Q4 vs. Q1 | < 0.001 | 1.346 | 1.344–1.348 |
| Water quartile | |||
| Q2 vs. Q1 | < 0.001 | 0.608 | 0.607–0.609 |
| Q3 vs. Q1 | < 0.001 | 0.527 | 0.526–0.527 |
| Q4 vs. Q1 | < 0.001 | 0.526 | 0.525–0.527 |
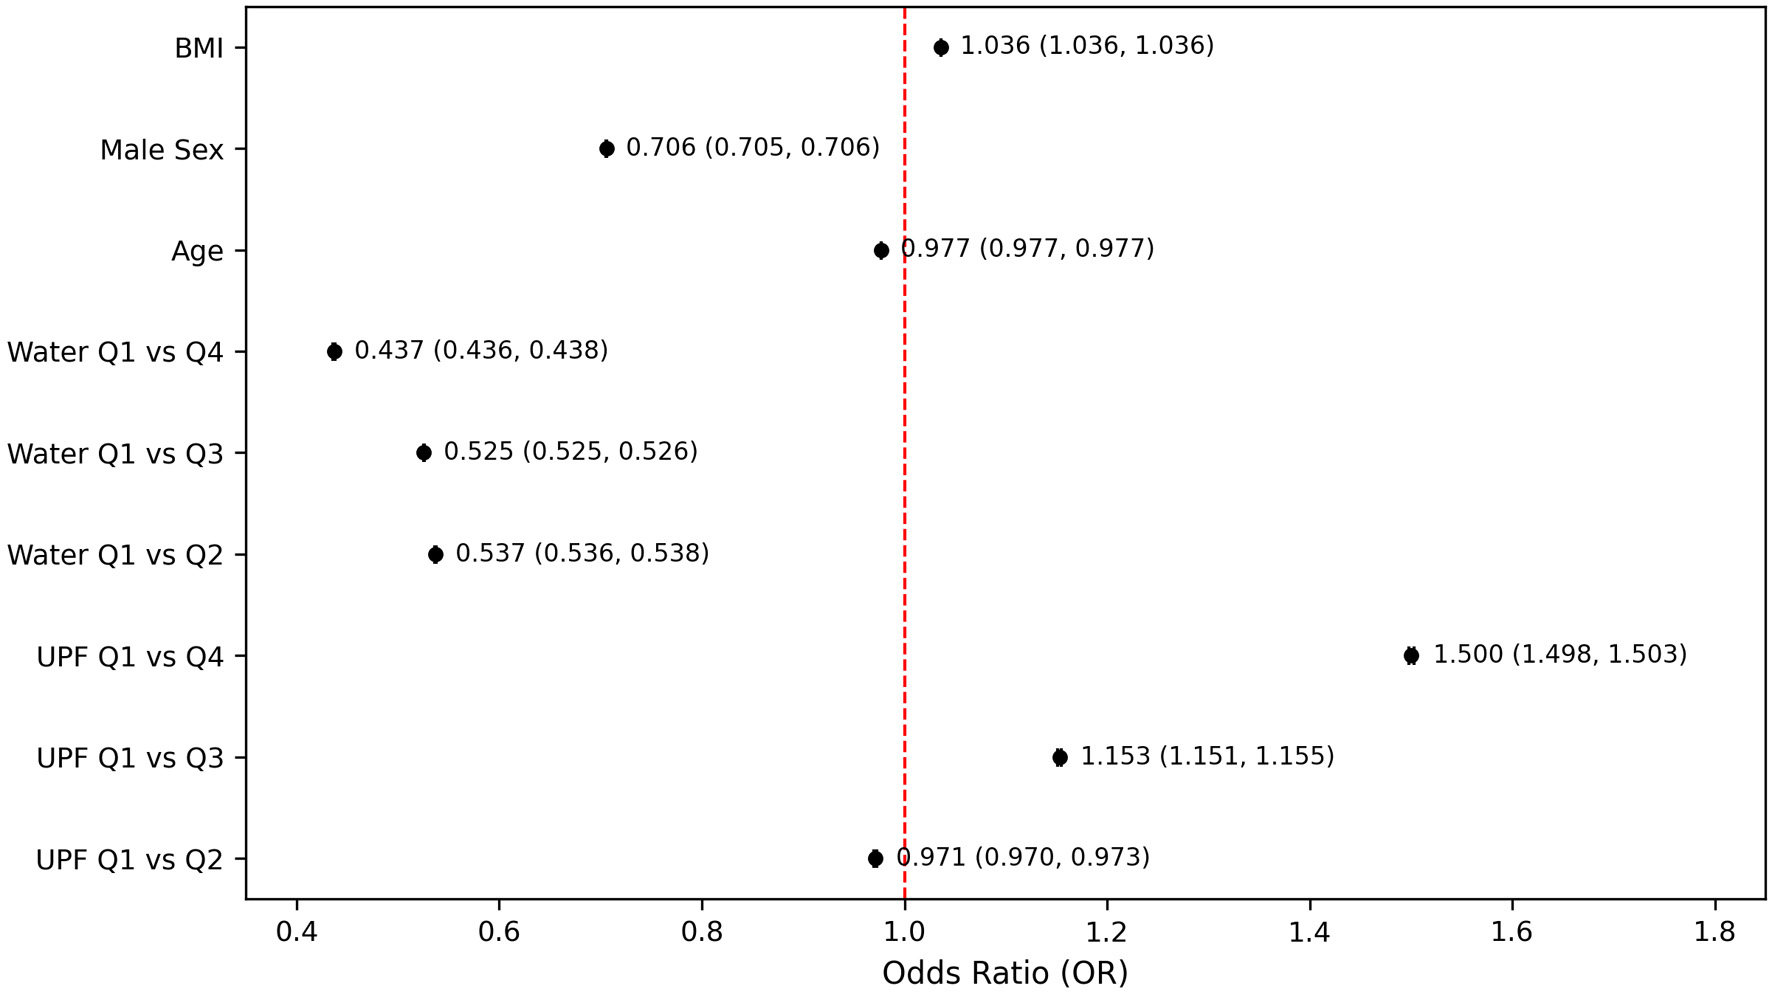
| Variable | P-value | OR (Exp(B)) | 95% CI |
|---|---|---|---|
| BMI: body mass index; CI: confidence interval; OR: odds ratio; UPF: ultra-processed food. | |||
| Age | < 0.001 | 0.976 | 0.976–0.976 |
| Male (vs. female) | < 0.001 | 0.619 | 0.618–0.620 |
| BMI | < 0.001 | 1.020 | 1.020–1.020 |
| Drinker (vs. non-drinker) | < 0.001 | 0.663 | 0.662–0.664 |
| Smoking status | |||
| Never vs. current | < 0.001 | 2.174 | 2.171–2.177 |
| Never vs. former | < 0.001 | 1.257 | 1.255–1.258 |
| UPF quartile | |||
| Q2 vs. Q1 | < 0.001 | 0.828 | 0.826–0.829 |
| Q3 vs. Q1 | < 0.001 | 0.888 | 0.886–0.891 |
| Q4 vs. Q1 | < 0.001 | 1.043 | 1.040–1.047 |
| Water quartile | |||
| Q2 vs. Q1 | < 0.001 | 0.553 | 0.552–0.554 |
| Q3 vs. Q1 | < 0.001 | 0.439 | 0.438–0.440 |
| Q4 vs. Q1 | < 0.001 | 0.407 | 0.406–0.409 |
| UPF × water interaction | < 0.001 | 1.034 | 1.034–1.035 |