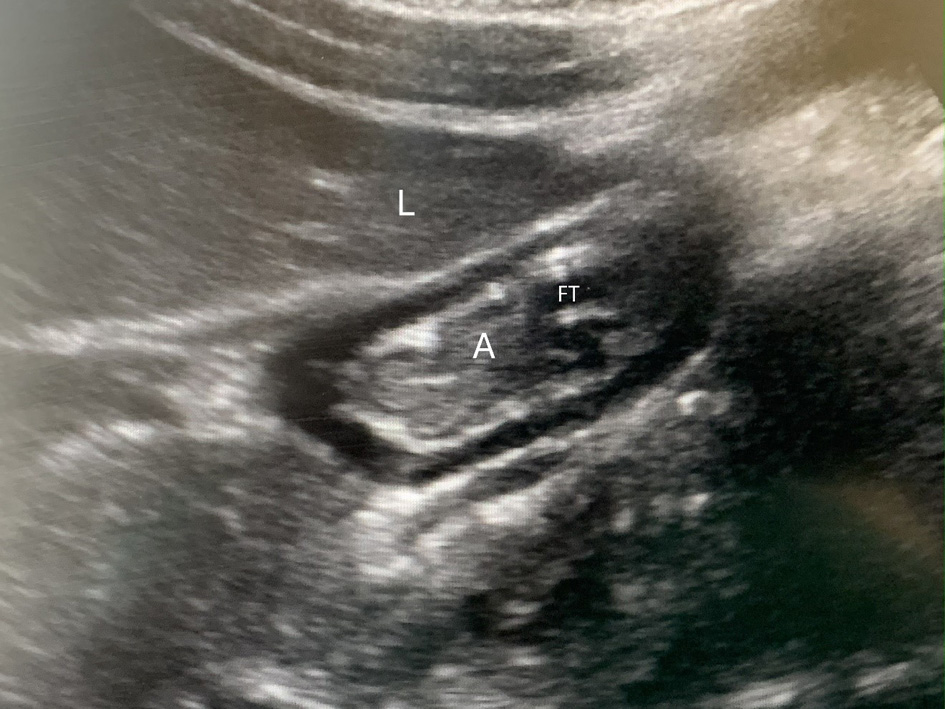
↓ Figure 1. Gastric ultrasound in a patient receiving post-pyloric feedings via feeing tube (FT) showing the collapsed antrum (A) with the classic “bull’s eye appearance,” positioned under the liver (L).
| Journal of Clinical Medicine Research, ISSN 1918-3003 print, 1918-3011 online, Open Access |
| Article copyright, the authors; Journal compilation copyright, J Clin Med Res and Elmer Press Inc |
| Journal website https://jocmr.elmerjournals.com |
Original Article
Volume 18, Number 3, March 2026, pages 205-210
Point-of-Care Ultrasound to Evaluate Gastric Volumes During Gastric and Post-Pyloric Enteral Feeds in Infants and Children Undergoing Mechanical Ventilation: A Pilot Study to Assess Feasibility Study
Figure
Tables
| Characteristics | Nasogastric | Post-pyloric (NJ or ND) | Entire cohort |
|---|---|---|---|
| Data are presented as the frequency (percentages) and median (interquartile ranges). PRISM category definition: ≤ 10 = low risk; 11 to ≤ 20 = moderate risk; >20 = high risk. *P = 0.155; **P = 0.420; +P = 0.494 when comparing nasogastric to post-pyloric groups. ND: nasoduodenal; NJ: nasojejunal; PRISM: pediatric risk of mortality. | |||
| Study population (number and %) | 29 (64.4) | 16 (35.6) | 45 (100) |
| Age (months)* | 4 (2, 16) | 12 (4, 122) | 6 (2, 48) |
| Weight (kg)** | 7.6 (5.5, 12.9) | 10.1 (5.0, 37.3) | 7.9 (5.0, 15.2) |
| Height (cm) | 60 (53, 77) | 76.1 (57.5, 129.5) | 62 (54, 79) |
| Gender+ | |||
| Female | 7 (24.1) | 6 (37.5) | 13 (28.9) |
| Male | 22 (75.9) | 10 (62.5) | 32 (71.1) |
| PRISM category | |||
| Low risk | 21 (72.4) | 8 (50.0) | 29 (64.4) |
| Moderate risk | 5 (17.2) | 6 (37.5) | 11 (24.4) |
| Unknown | 3 (10.3) | 2 (12.5) | 5 (11.1) |
| Nasogastric (NG) | Post-pyloric (ND or NJ) | |
|---|---|---|
| The gastric volumes are listed in mL/kg as the median (IQR) and mean (SD) while the distribution based on ≤ 0.4, 0.4–2, and ≥ 2 mL/kg is listed as the number (percentage). The total number of recorded gastric volumes exceeds the number of patients because some patients underwent more than one scan. The volume noted was not listed in seven scans in the NG group and two scans in the NJ group. *P < 0.001. ND: nasoduodenal; NJ: naso-jejunal. | ||
| Gastric volume (mL/kg) | 2.1 (1.1, 4.5) to 3.7 (4.1) | 0 (0, 0.1) to 0.2 (0.4)* |
| ≤ 0.4 mL/kg | 3 (9.4) | 13 (81.2)* |
| > 0.4 to < 2 mL/kg | 12 (37.5) | 3 (18.8) |
| ≥ 2 mL/kg | 17 (53.1) | 0 |
| Risk of aspiration* | Nasogastric (NG) | Post-pyloric (ND or NJ) |
|---|---|---|
| Data are presented as frequency (percentage). The total number of aspiration risk events may exceed the number of patients because some patients underwent multiple scans. Risk of aspiration according to Spencer et al [6] based on characteristic and volume of the gastric contents. *P < 0.001 when comparing risk of aspiration (NG versus post-pyloric). There were 21 encounters with solid or thick fluid on ultrasound. All were NG and all were classified as high risk for aspiration. Additionally, the gastric volumes were high among these 21 as 10 had gastric volumes ≥ 2 mL/kg compared to none in the post-pyloric group. ND: nasoduodenal; NJ: nasojejunal. | ||
| Low risk | 6 (15.4) | 18 (100) |
| High risk | 33 (84.6) | 0 |