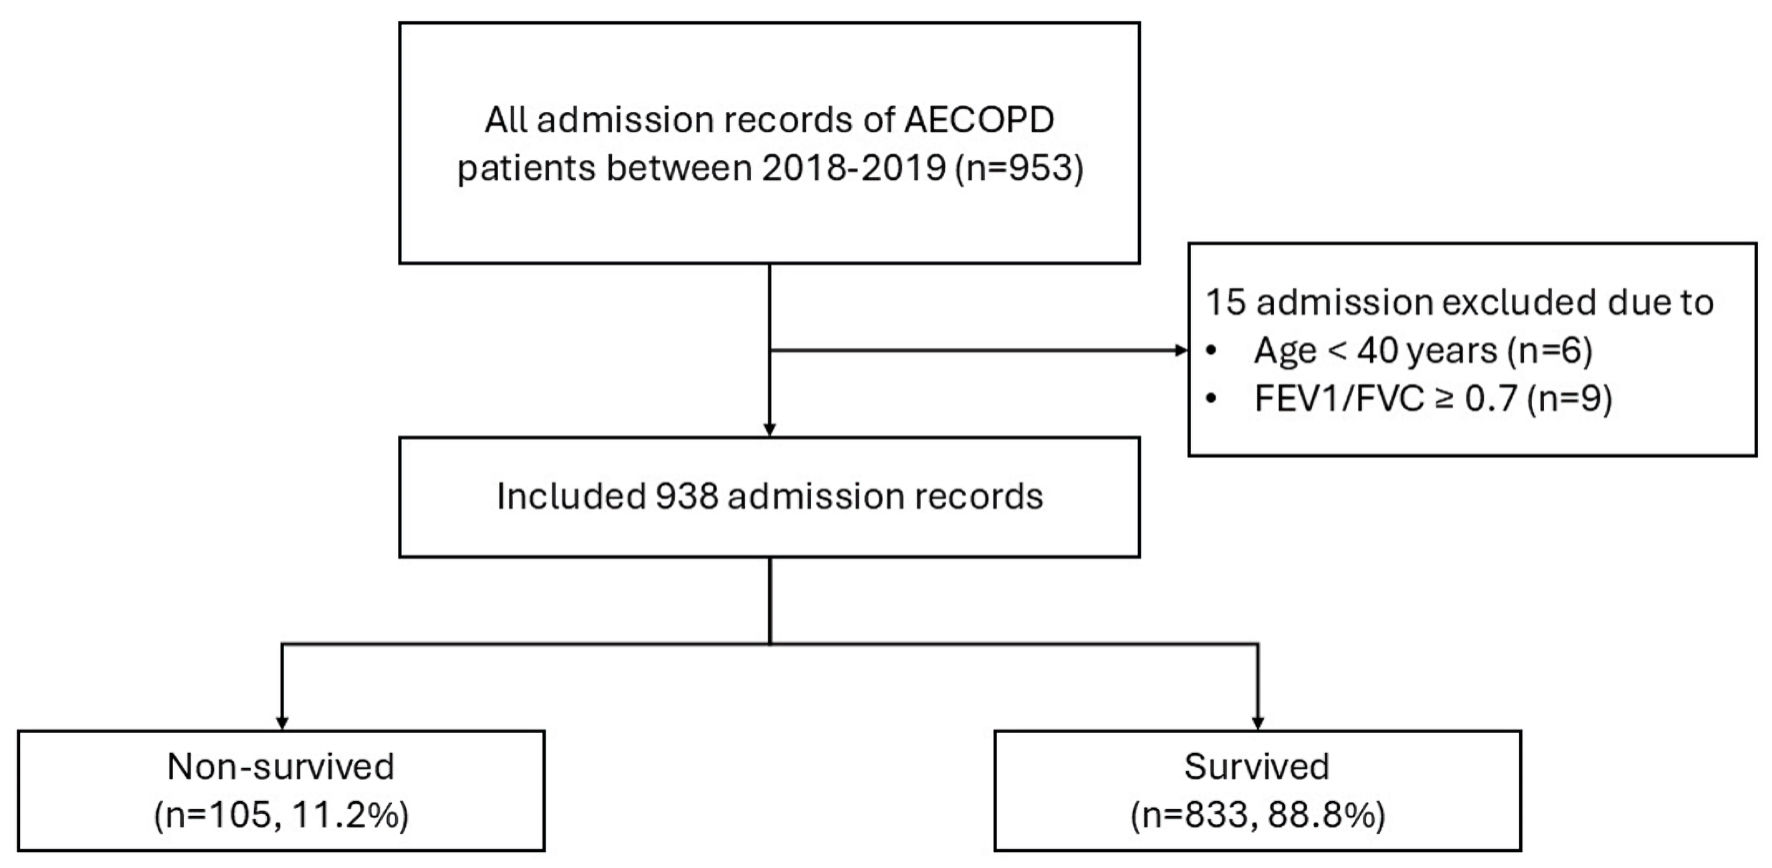
↓ Figure 1. Study flow diagram of the patient cohort. AECOPD: acute exacerbation of chronic obstructive pulmonary disease; FEV1: forced expiratory volume in 1 second; FVC: forced vital capacity.
| Journal of Clinical Medicine Research, ISSN 1918-3003 print, 1918-3011 online, Open Access |
| Article copyright, the authors; Journal compilation copyright, J Clin Med Res and Elmer Press Inc |
| Journal website https://jocmr.elmerjournals.com |
Original Article
Volume 18, Number 3, March 2026, pages 196-204
The MAGENTA Model for Individual Prediction of In-Hospital Mortality in Chronic Obstructive Pulmonary Disease With Acute Exacerbation: An External Validation Study
Figures
Tables
| Characteristics | Missing data, n (%) | Non-survived admissions, n (%) | Survived admissions, n (%) | P value |
|---|---|---|---|---|
| AECOPD: acute exacerbation of chronic obstructive pulmonary disease; FEV1: forced expiratory volume in 1 second; FVC: forced vital capacity; IQR: interquartile range; SD: standard deviation. | ||||
| Total | 105 (11.2) | 833 (88.8) | ||
| Male | 0 (0) | 87 (82.9) | 718 (86.2) | 0.370 |
| Age, years, mean ± SD | 0 (0) | 76.7 ± 10.1 | 74.6 ± 11.4 | 0.072 |
| Body mass index, kg/m2, mean ± SD | 121 (12.9) | 12.0 ± 8.0 | 16.6 ± 7.4 | < 0.001 |
| Smoking status | 0.110 | |||
| Never smoker | 22 (2.4) | 19 (18.1) | 109 (13.1) | |
| Ex-smoker | 22 (2.4) | 64 (61.0) | 580 (69.6) | |
| Active smoker | 22 (2.4) | 21 (20.0) | 123 (14.8) | |
| Number of cigarettes smoked | ||||
| Pack-year, median (IQR) | 212 (22.6) | 30.0 (10.0, 40.0) | 25.0 (15.0, 40.0) | 0.690 |
| Underlying diseases | ||||
| Presence (any) | 0 (0) | 90 (85.7) | 697 (83.7) | 0.670 |
| Hypertension | 0 (0) | 50 (47.6) | 394 (47.3) | 1.000 |
| Diabetes mellitus | 0 (0) | 22 (21.0) | 133 (16.0) | 0.210 |
| Ischemic heart disease | 0 (0) | 12 (11.4) | 70 (8.4) | 0.280 |
| Atrial fibrillation | 0 (0) | 13 (12.4) | 52 (6.2) | 0.038 |
| Left ventricular dysfunction | 0 (0) | 1 (1.0) | 10 (1.2) | 1.000 |
| Chronic kidney disease | 0 (0) | 14 (13.3) | 102 (12.2) | 0.750 |
| Cerebrovascular disease | 0 (0) | 8 (7.6) | 82 (9.8) | 0.600 |
| Cognitive impairment | 0 (0) | 3 (2.9) | 15 (1.8) | 0.440 |
| COPD status | ||||
| Spirometry performed, n (%) | 719 (76.7) | 10 (9.5) | 209 (25.1) | < 0.001 |
| FEV1/FVC ratio, mean ± SD | 719 (76.7) | 0.5 ± 0.1 | 0.5 ± 0.1 | 0.980 |
| FEV1, % predicted, mean ± SD | 719 (76.7) | 35.4 ± 11.8 | 44.7 ± 17.3 | 0.096 |
| FVC, % predicted, mean ± SD | 719 (76.7) | 53.3 ± 9.6 | 66.9 ± 18.2 | 0.021 |
| Long-term oxygen therapy | 0 (0) | 3 (2.9) | 32 (3.8) | 0.790 |
| Cor pulmonale | 805 (85.8) | 3 (2.9) | 25 (3.0) | 1.000 |
| Inhaled controller medications | ||||
| Presence (any) | 0 (0) | 76 (72.4) | 614 (73.7) | 0.810 |
| Salmeterol/fluticasone | 0 (0) | 64 (61.0) | 533 (64.0) | 0.590 |
| Formoterol/budesonide | 0 (0) | 1 (1.0) | 21 (2.5) | 0.500 |
| Tiotropium | 0 (0) | 18 (17.1) | 210 (25.2) | 0.071 |
| Budesonide | 0 (0) | 4 (3.8) | 38 (4.6) | 1.000 |
| Influenza vaccination | 0 (0) | 5 (4.8) | 56 (6.7) | 0.530 |
| Clinical parameters | Missing data, n (%) | Non-survived admissions, n (%) (n = 105) | Survived admissions, n (%) (n = 833) | P value |
|---|---|---|---|---|
| AECOPD: acute exacerbation of chronic obstructive pulmonary disease; BP: blood pressure; IQR: interquartile range; SD: standard deviation; WBC: white blood cell count. | ||||
| Initial vital signs | ||||
| Body temperature, °C, mean ± SD | 0 (0) | 37.5 ± 0.9 | 37.4 ± 1.0 | 0.220 |
| Heart rate, beats/min, mean ± SD | 0 (0) | 111.6 ± 30.7 | 111.4 ± 22.4 | 0.930 |
| Systolic BP, mm Hg, mean ± SD | 0 (0) | 129.6 ± 35.9 | 142.9 ± 29.5 | < 0.001 |
| Diastolic BP, mm Hg, mean ± SD | 0 (0) | 76.7 ± 20.4 | 84.4 ± 17.3 | < 0.001 |
| Mean arterial pressure, mm Hg, mean ± SD | 0 (0) | 94.4 ± 24.4 | 103.9 ± 19.8 | < 0.001 |
| Respiratory rate, breaths/min, mean ± SD | 2 (0.2) | 34.3 ± 10.2 | 34.7 ± 7.4 | 0.660 |
| Required endotracheal intubation, n (%) | 2 (0.2) | 100 (95.2) | 583 (70.0) | < 0.001 |
| Radiographic consolidation | 0 (0) | 59 (56.2) | 174 (20.9) | < 0.001 |
| Laboratory investigations | ||||
| Sodium, mmol/L, mean ± SD | 8 (0.9) | 138.3 ± 5.8 | 138.6 ± 5.7 | 0.650 |
| Bicarbonate, mmol/L, mean ± SD | 8 (0.9) | 23.7 ± 6.8 | 24.2 ± 5.2 | 0.380 |
| Blood urea nitrogen, mg/dL, median (IQR) | 8 (0.9) | 22.5 (14.0, 35.0) | 15.0 (11.0, 21.0) | < 0.001 |
| Serum creatinine, mg/dL, median (IQR) | 2 (0.2) | 1.1 (0.8, 1.5) | 0.9 (0.7, 1.2) | < 0.001 |
| Serum albumin, g/dL, mean ± SD | 436 (46.5) | 3.2 ± 0.6 | 3.8 ± 0.6 | < 0.001 |
| Hemoglobin, g/dL, mean ± SD | 5 (0.5) | 11.9 ± 2.2 | 12.6 ± 2.0 | < 0.001 |
| WBC, cells/mm3, median (IQR) | 5 (0.5) | 14,000 (9,400, 19,700) | 12,980 (9,850, 16,550) | 0.138 |
| Neutrophil percent, mean ± SD | 5 (0.5) | 83.0 ± 14.0 | 84.5 ± 12.7 | 0.240 |
| Eosinophil count, cells/mm3, median (IQR) | 5 (0.5) | 0.0 (0.0, 101.6) | 14.2 (0, 194.8) | 0.020 |
| Length of hospital stay, days, median (IQR) | 0 (0) | 11.0 (3.0, 18.0) | 3.0 (2.0, 6.0) | < 0.001 |
| Clinical characteristic | Validation dataset (n = 938) | Development dataset (n = 923) | ||||||
|---|---|---|---|---|---|---|---|---|
| Missing values | Non-survived admissions (n = 105) | Survived admissions (n = 833) | P value | Missing values | Non-survived admissions (n = 101) | Survived admissions (n = 822) | P value | |
| n (%) | Mean ± SD | Mean ± SD | n (%) | Mean ± SD | Mean ± SD | |||
| BT: body temperature; BUN: blood urea nitrogen; IQR: interquartile range; MAP: mean arterial pressure; SCr: serum creatinine; SD: standard deviation; WBC: white blood cell. | ||||||||
| Demographic characteristics | ||||||||
| Age, years | 0 (0) | 76.7 ± 10.1 | 74.6 ± 11.4 | 0.072 | 0 (0) | 76.8 ± 11.0 | 74.1 ± 11.0 | 0.020 |
| Initial assessments | ||||||||
| BT, °C | 0 (0) | 37.5 ± 0.9 | 37.4 ± 1.0 | 0.220 | 1 (0.1) | 37.4 ± 0.9 | 37.1 ± 0.6 | < 0.001 |
| MAP, mm Hg | 0 (0) | 94.4 ± 24.4 | 103.9 ± 19.8 | < 0.001 | 0 (0) | 90.3 ± 20.3 | 98.3 ± 15.4 | < 0.001 |
| Required endotracheal intubation, n (%) | 0 (0) | 100 (95.2) | 583 (70.0) | < 0.001 | 0 (0) | 96 (95.1) | 561 (68.3) | < 0.001 |
| Initial investigations | ||||||||
| Radiographic consolidation, n (%) | 2 (0.2) | 59 (56.2) | 174 (20.9) | < 0.001 | 0 (0) | 65 (64.4) | 304 (37.0) | < 0.001 |
| Complete blood count | ||||||||
| WBC count, cells/mm3 | 5 (0.5) | 16,065 ± 10,697 | 13,767 ± 6,106 | 0.001 | 1 (0.1) | 15,296 ± 6,978 | 13,738 ± 6,083 | 0.017 |
| Eosinophil count, cells/mm3, median (IQR) | 5 (0.5) | 0 (0, 102) | 14.2 (0, 195) | 0.020 | 1 (0.1) | 9.5 (0, 172) | 40.8 (0, 228) | 0.010 |
| Blood chemistry | ||||||||
| Sodium, mmol/L | 8 (0.9) | 138.3 ± 5.8 | 138.6 ± 5.7 | 0.650 | 4 (0.4) | 137.5 ± 7.6 | 138.8 ± 4.6 | 0.013 |
| BUN, mg/dL, median (IQR) | 8 (0.9) | 22.5 (14.0, 35.0) | 15.0 (11.0, 21.0) | < 0.001 | 0 (0) | 21 (14, 32) | 15 (11, 21) | < 0.001 |
| SCr, mg/dL, median (IQR) | 2 (0.2) | 1.1 (0.8, 1.5) | 0.9 (0.7, 1.2) | < 0.001 | 0 (0) | 1.1 (0.8, 1.5) | 0.9 (0.8, 1.2) | 0.002 |
| Serum albumin, g/dL | 436 (46.5) | 3.2 ± 0.6 | 3.8 ± 0.6 | < 0.001 | 323 (35.0) | 3.4 ± 0.6 | 3.9 ± 0.5 | < 0.001 |