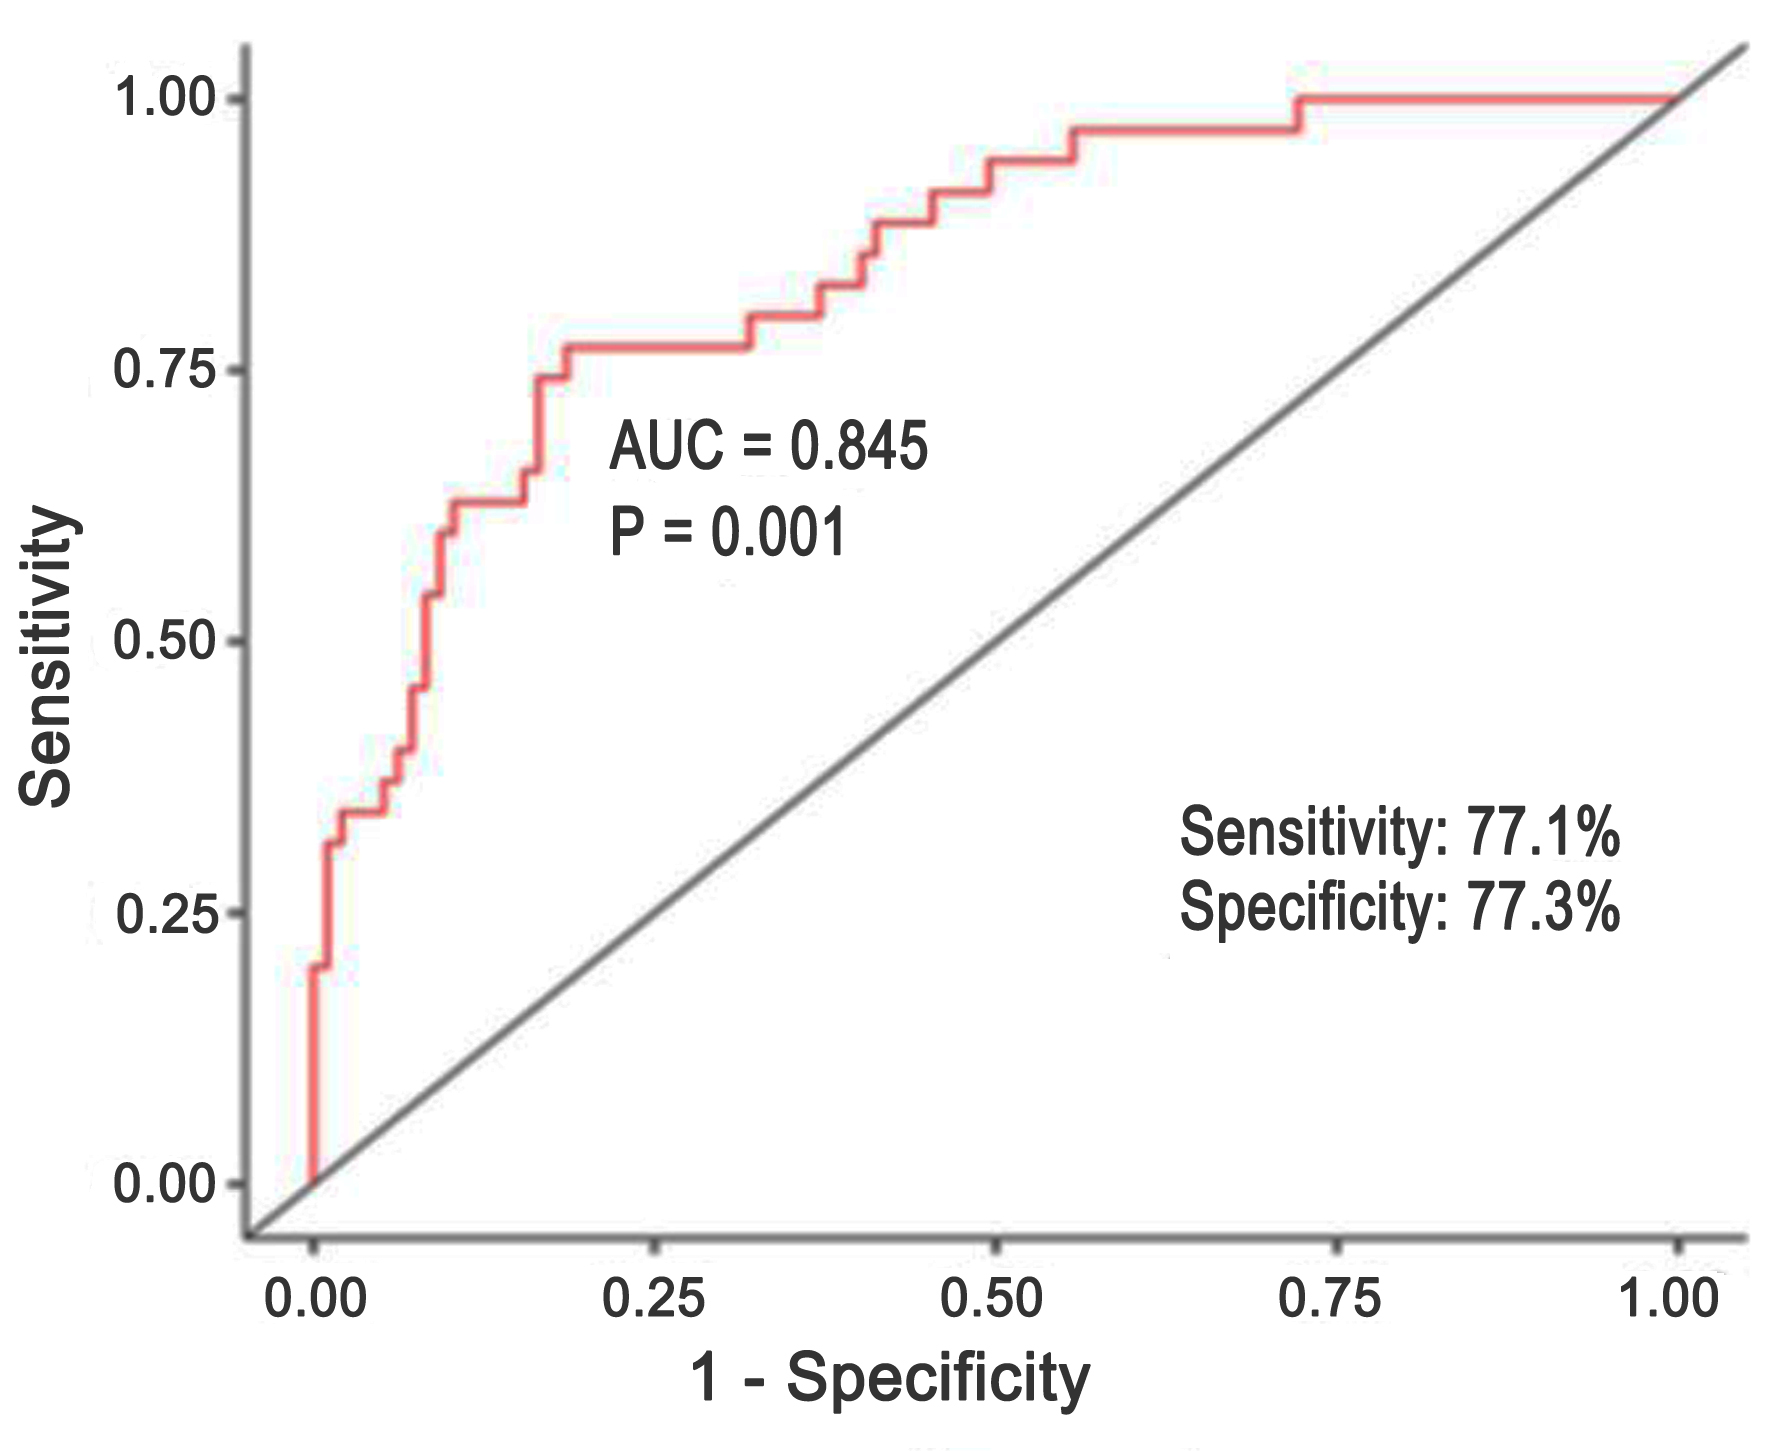
↓ Figure 1. Results of ROC analysis for PIFA-N multivariate logistic regression model. ROC: receiver operating characteristic.
| Journal of Clinical Medicine Research, ISSN 1918-3003 print, 1918-3011 online, Open Access |
| Article copyright, the authors; Journal compilation copyright, J Clin Med Res and Elmer Press Inc |
| Journal website https://jocmr.elmerjournals.com |
Original Article
Volume 18, Number 4, April 2026, pages 261-269
PIFA-N Multifactor Model to Predict Adverse Outcomes for Chronic Heart Failure Patients
Figures
Tables
| Indicator | Endpoint not reached (n = 146) | Endpoint reached (n = 77) | Р |
|---|---|---|---|
| ACVA: acute cerebrovascular accident; BMI: body mass index; CABG: coronary artery bypass graft; DM: diabetes mellitus; HbA1c: glycated hemoglobin; Me (Q1; Q3): median (interquartile range); NYHA FC: New York Heart Association Functional Classification; PCI: percutaneous coronary intervention. | |||
| Age, years, Me (Q1; Q3) | 72 (64; 79.8) | 78 (70; 82) | 0.02 |
| Male, n (%) | 56 (38.4%) | 28 (36.4%) | 0.87 |
| BMI, kg/m2, Me (Q1; Q3) | 30.4 (26.5; 36.8) | 30.6 (25.7; 34.8) | 0.18 |
| NYHA FC, mean ± SD | 2.88 ± 0.65 | 3.2 ± 0.56 | 0.0005 |
| Cardiac comorbidities | |||
| Arterial hypertension, n (%) | 139 (95.2%) | 71 (97%) | 0.25 |
| SBP on admission, mm Hg, mean ± SD | 137 ± 24.5 | 135 ± 22.3 | 0.41 |
| Ischemic heart disease, n (%) | 141 (96.6%) | 69 (95%) | 0.54 |
| Post-infarction cardiosclerosis, n (%) | 62 (42.5%) | 48 (65.8%) | 0.001 |
| CABG history, n (%) | 7 (4.7%) | 6 (8%) | 0.45 |
| PCI history, n (%) | 16 (11%) | 9 (12%) | 0.71 |
| Rheumatic heart defect, n (%) | 5 (3.4%) | 6 (8%) | 0.12 |
| Degenerative heart defect, n (%) | 20 (13.7%) | 7 (9.6%) | 0.35 |
| Heart defect in outcome of infectious endocarditis, n (%) | 2 (1.4%) | 1 (1.3%) | 0.76 |
| Dilated cardiomyopathy, n (%) | 8 (5.5%) | 3 (4.3%) | 0.73 |
| Atrial fibrillation, n% | 89 (61%) | 55 (75%) | 0.04 |
| Pacemaker, n (%) | 10 (6.8%) | 7 (9.5%) | 0.54 |
| Non-cardiac comorbidities | |||
| ACVA history, n (%) | 11 (7.5%) | 9 (12%) | 0.23 |
| Community-acquired pneumonia on admission, n (%) | 42 (28.6%) | 41 (56%) | 0.0002 |
| Bronchial obstructive diseases, n (%) | 49 (33.5%) | 25 (34%) | 0.68 |
| Pulmonary thromboembolism history, n (%) | 3 (2%) | 5 (7%) | 0.12 |
| Obstructive sleep apnea syndrome, n (%) | 17 (11.6%) | 4 (5%) | 0.14 |
| Mild anemia, n (%) | 28 (19.2%) | 17 (23%) | 0.43 |
| Type 2 DM, n (%) | 51 (34.9%) | 19 (26%) | 0.23 |
| HbA1c | 6.2 (5.6; 6.9) | 6.6 (5.9; 7.7) | 0.19 |
| Thyroid diseases, n (%) | 32 (21.9%) | 18 (25%) | 0.67 |
| Duodenal ulcer disease in remission/chronic gastroduodenitis, n (%) | 46 (31.5%) | 16 (22%) | 0.14 |
| Chronic kidney disease, n (%) | 80 (54.7%) | 52 (71%) | 0.37 |
| Joints and spine diseases, n (%) | 32 (21.9%) | 17 (22.3%) | 0.63 |
| Charlson Comorbidity Index, Me (Q1; Q3) | 10.8 (9.6; 13.1) | 12 (11; 13.8) | 0.01 |
| Indicator | Endpoint not reached (n = 146) | Endpoint reached (n = 77) | Р |
|---|---|---|---|
| ACEIs: angiotensin converting enzyme inhibitors; ARBs: angiotensin receptor blockers; DOACs: direct oral anticoagulants; MRAs: mineralocorticoid receptor antagonists; SGLT2Is: type 2 sodium-glucose cotransporter inhibitors. | |||
| ACEIs (%) | 110 (75.3%) | 63 (81.8%) | 0.512 |
| ARBs, n (%) | 22 (15.1%) | 9 (11.6%) | 0.313 |
| Valsartan/sacubitryl, n (%) | 5 (3.4%) | 3 (3.9%) | 0.897 |
| Beta blockers, n (%) | 151 (97%) | 69 (95%) | 0.541 |
| MRAs, n (%) | 72 (49.3%) | 32 (41.5%) | 0.412 |
| Loop diuretics, n (%) | 95 (65.1%) | 66 (85.7%) | 0.067 |
| Thiazide and thiazide-like diuretics, n (%) | 17 (11.6%) | 8 (10.4%) | 0.815 |
| SGLT2Is, n (%) | 51 (32.9%) | 29 (37.7%) | 0.614 |
| Cardiac glycosides (digoxin), n (%) | 12 (8.2%) | 7 (9.1%) | 0.733 |
| Statins, n (%) | 78 (53.4%) | 52 (67.5%) | 0.145 |
| Amiodarone, n (%) | 22 (15.1%) | 18 (23.4%) | 0.188 |
| Sotalol, n (%) | 9 (6.1%) | 4 (5.2%) | 0.765 |
| Antiplatelet agents (aspirin), n (%) | 25 (17.1%) | 14 (18.1%) | 0.855 |
| DOACs, n (%) | 85 (58.2%) | 54 (70.1%) | 0.072 |
| Calcium antagonists, n (%) | 7 (4.8%) | 4 (5.2%) | 0.814 |
| Indicator | Endpoint not reached (n = 146) | Endpoint reached (n = 77) | Р |
|---|---|---|---|
| LVEF: left ventricular ejection fraction; LV EDD: left ventricular end-diastolic dimension; LV ESD: left ventricular end-systolic dimension; LV EDV: left ventricular end-diastolic volume; LV ESV: left ventricular end-systolic volume; LVSV: left ventricular stroke volume; IVS: interventricular septum thickness in diastole; LVPW: left ventricular posterior wall thickness in diastole; LVMI: left ventricular mass index; LA volume: left atrial volume; sPAP: systolic pulmonary artery pressure; ICVd: inferior vena cava diameter; RVEF: right ventricular ejection fraction. | |||
| LVEF, % | 50 (41; 59.8) | 41 (36; 51.5) | 0.001 |
| LV EDD, mm | 48 (43; 52) | 50 (46; 52.2) | 0.853 |
| LV ESD, mm | 35 (31; 40) | 41 (31; 44) | 0.320 |
| LV EDV, mL | 100 (83; 122) | 119 (107; 152) | 0.03 |
| LV ESV, mL | 42 (39; 71) | 67 (43; 96) | 0.001 |
| LVSV, mL | 64 (60; 72) | 67 (54; 70) | 0.568 |
| IVS, mm | 11.5 (9.8; 12.5) | 12 (11; 12.5) | 0.763 |
| LVPW, mm | 10 (9; 10.5) | 10 (9; 10.5) | 0.689 |
| LVMI, g/m2 | 100 (81; 117) | 110 (92; 126) | 0.09 |
| LA volume, mL | 71 (66; 95) | 90 (74; 101) | 0.03 |
| sPAP, mm Hg | 28 (21; 44) | 40 (26.5; 52) | 0.004 |
| ICVd, mm | 20 (20; 21) | 20.5 (19; 23) | 0.129 |
| RVEF, % | 62 (57; 67) | 57 (53; 63) | 0.304 |
| Indicator | Endpoint not reached (n = 146) | Endpoint reached (n = 77) | Р |
|---|---|---|---|
| ALT: alanine aminotransferase; AST: aspartate aminotransferase; ESR: erythrocyte sedimentation rate; GFRCKD-EPI: glomerular filtration rate estimated by CKD-EPI; HDLs: high-density lipoproteins; INR: international normalized ratio; LDLs: low-density lipoproteins; NT-proBNP: N-terminal pro-B-type natriuretic peptide; ST2: soluble interleukin-like protein receptor; VLDLs: very low-density lipoproteins. | |||
| Leukocytes, × 109/L | 6.92 (5.79; 8.59) | 7.51 (5.99; 8.86) | 0.25 |
| Hemoglobin, g/L | 139 (126; 148) | 134 (121; 144) | 0.06 |
| Platelets, × 109/L | 220 (178; 262) | 202 (164; 259) | 0.58 |
| ESR, mm/h | 20.5 (11.8; 33) | 20 (10.8; 38.8) | 0.43 |
| Creatinine, µmol/L | 102 (92.3; 117) | 114 (93.4; 138.4) | 0.042 |
| GFRCKD-EPI, mL/min/1.73 m2 | 53 (44.9; 64) | 49 (36.9; 61) | 0.07 |
| Urea nitrogen, mmol/L | 7.5 (5.9; 9.3) | 9.5 (6.7; 12.7) | 0.0001 |
| Potassium, mmol/L | 4.6 (4.4; 4.9) | 4.6 (4.01; 5) | 0.84 |
| Sodium, mmol/L | 144 (141; 147) | 142 (138; 145) | 0.21 |
| Iron, µmol/L | 12 (8.4; 17.1) | 8.5 (6.3; 11.5) | 0.34 |
| AST, U/L | 26 (21.3; 33) | 28 (20; 39) | 0.32 |
| ALT, U/L | 22 (17; 34) | 20.2 (13.7; 26) | 0.36 |
| Gamma-glutamyl transpeptidase, U/mL | 41 (25.5; 53.5) | 33.5 (25.3; 41.8) | 0.44 |
| Alkaline phosphatase, U/mL | 199 (155; 247) | 230 (176; 298) | 0.12 |
| Total bilirubin, µmol/L | 14.9 (10.6; 20.7) | 15.1 (10.4; 21.9) | 0.41 |
| Direct bilirubin, µmol/L | 4.9 (3.6; 6.4) | 8.6 (5.7; 10.9) | 0.07 |
| Albumin, g/L | 41.9 (36.5; 44.2) | 38.1 (33.7; 40.1) | 0.03 |
| Total cholesterol, mmol/L | 4.77 (3.7; 5.9) | 4.01 (3.26; 5.07) | 0.001 |
| HDLs, mmol/L | 1.25 (1.02; 1.54) | 1.17 (0.81; 1.61) | 0.39 |
| LDLs, mmol/L | 2.92 (2.05; 3.74) | 2.34 (1.85; 2.7) | 0.001 |
| VLDLs, mmol/L | 0.59 (0.42; 0.99) | 0.53 (0.37; 0.71) | 0.03 |
| Glucose, mmol/L | 6.04 (5.3; 7.2) | 6.37 (5.3; 7.3) | 0.83 |
| INR | 1.02 (0.94; 1.14) | 1.15 (0.98; 1.38) | 0.02 |
| MELD-XI, points | 10.6 (8.2; 12.8) | 12.2 (9.7; 15.1) | 0.001 |
| NT-proBNP, pg/mL | 468.1 (203.2; 1,142.4) | 987 (421.7; 2,365) | 0.002 |
| Copeptin, ng/mL | 6.96 (5.11; 8.23) | 6.64 (5.33; 9.16) | 0.629 |
| ST2, ng/mL | 23.29 (14.9; 33.1) | 53.76 (21.1; 93.5) | 0.017 |
| Galectin-3, ng/mL | 8.85 (6.67; 11.53) | 9.92 (5.88; 10.69) | 0.718 |
| Haptoglobin, ng/mL | 1086 (686; 1,717) | 1286 (748.1; 1,957.9) | 0.689 |
| Hepcidin, ng/mL | 27.1 (22.94; 53.72) | 22.5 (19.09; 37.17) | 0.207 |
| Risk factors | Univariate regression analysis | Multivariate regression analysis | ||||
|---|---|---|---|---|---|---|
| RR | 95% CI | P | OR | 95% CI | P | |
| AMI: acute myocardial infarction; BMI: body mass index; CI: confidence interval; GFRCKD-EPI: glomerular filtration rate estimated by CKD-EPI; LVEF: left ventricular ejection fraction; OR: odds ratio; NT-proBNP: N-terminal pro-B-type natriuretic peptide; RR: risk ratio; sST2: soluble interleukin-like protein receptor. | ||||||
| Age | 1.024 | 0.999–1.049 | 0.060 | |||
| Male gender | 0.953 | 0.58–1.563 | 0.850 | |||
| BMI | 0.969 | 0.936–1.004 | 0.083 | |||
| LVEF < 40% | 2.451 | 1.478–4.064 | 0.001 | |||
| Community-acquired pneumonia | 2.398 | 1.451–3.962 | 0.021 | 3.09 | 1.13–8.5 | 0.028 |
| AMI history | 4.262 | 1.68–11.78 | < 0.001 | 4.26 | 1.54–11.7 | 0.005 |
| Atrial fibrillation | 3.134 | 1.06–9.24 | 0.034 | 3.13 | 1.05–9.2 | 0.039 |
| Anemia | 3.175 | 1.003–10.04 | 0.033 | 3.18 | 1.003–10.1 | 0.049 |
| MELD-XI | 2.345 | 1.274–4.315 | 0.006 | |||
| GFRCKD-EPI | 0.991 | 0.975–1.007 | 0.246 | |||
| NT-proBNP | 1.0004 | 1.0001–1.0005 | 0.002 | 1.0005 | 1.0002–1.0008 | 0.002 |
| sST2 | 1.011 | 1.007–1.021 | 0.035 | |||