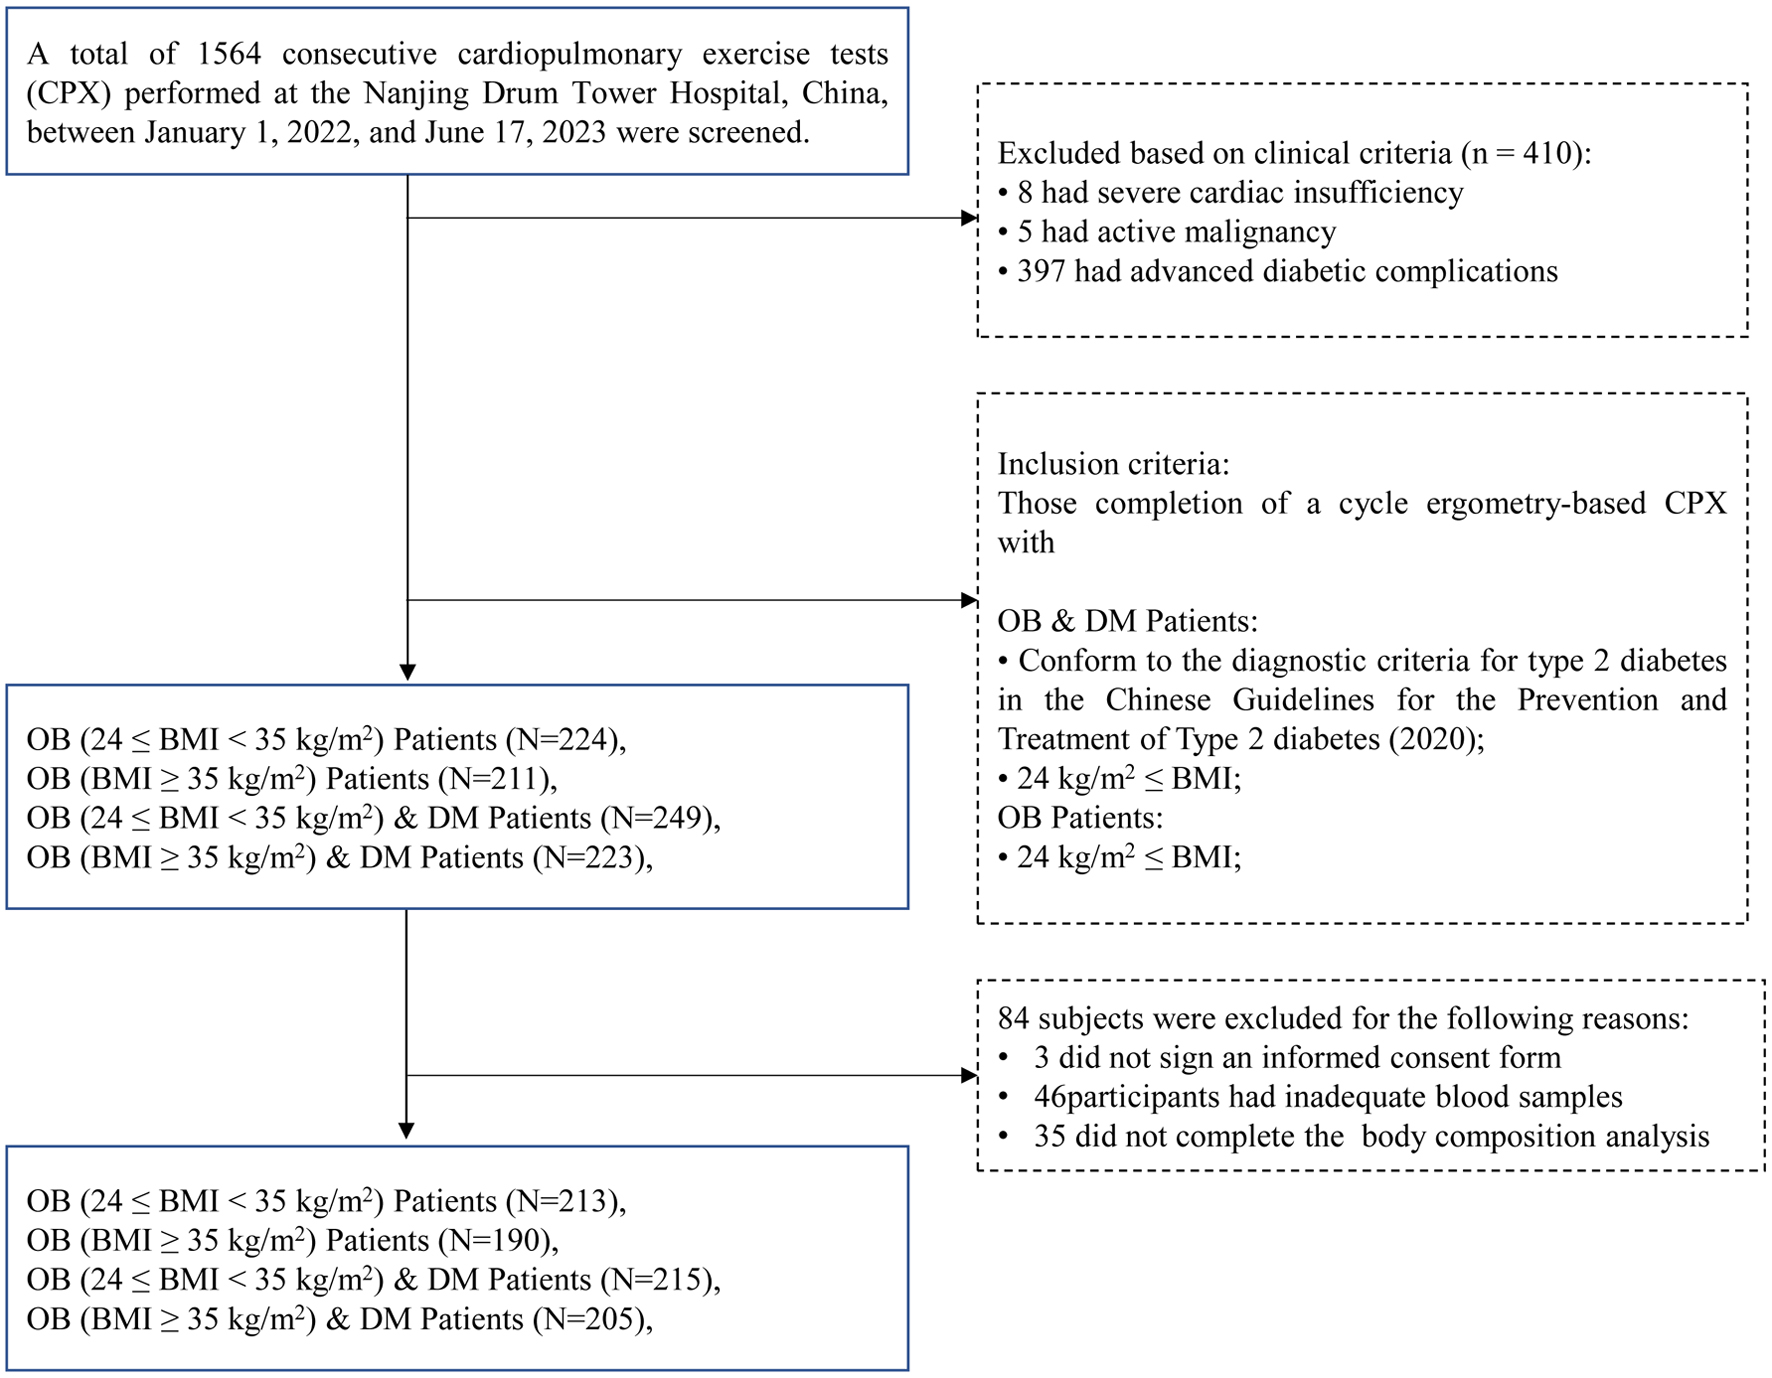
↓ Figure 1. Study enrollment flowchart.
| Journal of Clinical Medicine Research, ISSN 1918-3003 print, 1918-3011 online, Open Access |
| Article copyright, the authors; Journal compilation copyright, J Clin Med Res and Elmer Press Inc |
| Journal website https://jocmr.elmerjournals.com |
Original Article
Volume 18, Number 5, May 2026, pages 326-335
Obesity Severity Differentially Shapes Diabetes-Related Impairment in Cardiorespiratory Fitness: A Cross-Sectional Propensity Score–Weighted Analysis of Middle-Aged Adults
Figure
Tables
| Variable | None DM | DM | P value | ||
|---|---|---|---|---|---|
| Moderate obesity (24 ≤ BMI < 35) (n = 213) | Severe obesity (BMI ≥ 35) (n = 190) | Moderate obesity (24 ≤ BMI < 35) (n = 215) | Severe obesity (BMI ≥ 35) (n = 205) | ||
| Values are presented as mean ± standard deviation or number (percentage). P values were calculated using one-way ANOVA for continuous variables and the χ2 test for categorical variables. Treatment includes antihypertensive and cardiometabolic medications (β-blockers, ACE inhibitors, CCBs, and diuretics), and does not refer exclusively to antidiabetic therapy. aParticipants may receive more than one type of medication; therefore, counts for individual medication categories are not mutually exclusive. ACE: angiotensin-converting enzyme; ANOVA: analysis of variance; BMI: body mass index; CCB: calcium channel blocker; DM: diabetes mellitus; HbA1c: glycated hemoglobin; HDL: high-density lipoprotein; LDL: low-density lipoprotein. | |||||
| Age (years) | 29.8 ± 8.0 | 28.5 ± 8.3 | 34.9 ± 10.7 | 31.7 ± 9.0 | < 0.001 |
| Female sex, n (%) | 72 (28) | 101 (45) | 204 (74) | 120 (48) | < 0.001 |
| Height (cm) | 168.6 ± 9.6 | 169.4 ± 8.8 | 169.8 ± 8.7 | 169.1 ± 8.0 | 0.49 |
| Body weight (kg) | 88.4 ± 11.0 | 118.3 ± 19.2 | 82.3 ± 12.5 | 116.1 ± 18.1 | < 0.001 |
| BMI (kg/m2) | 31.1 ± 2.8 | 41.1 ± 4.9 | 28.5 ± 3.0 | 40.5 ± 4.6 | < 0.001 |
| Lean body mass (kg) | 53.5 ± 10.3 | 64.1 ± 12.7 | 56.7 ± 9.4 | 63.7 ± 11.8 | < 0.001 |
| Duration of diabetes (years) | - | - | 3.3 ± 4.5 | 1.0 ± 2.0 | - |
| Family history of diabetes, n (%) | 24 (9) | 0 (0) | 96 (35) | 45 (20) | < 0.001 |
| Fasting plasma glucose (mmol/L) | 4.6 ± 0.5 | 4.8 ± 0.4 | 8.6 ± 2.9 | 8.4 ± 3.0 | < 0.001 |
| 2-h postprandial glucose (mmol/L) | 5.9 ± 1.6 | 7.3 ± 1.6 | 15.5 ± 4.2 | 14.0 ± 4.1 | < 0.001 |
| HbA1c (%) | 5.3 ± 0.3 | 5.5 ± 0.3 | 8.9 ± 2.5 | 8.6 ± 3.9 | < 0.001 |
| Triglycerides (mmol/L) | 1.5 ± 0.7 | 1.9 ± 0.8 | 2.5 ± 2.0 | 2.6 ± 2.0 | < 0.001 |
| Total cholesterol (mmol/L) | 4.1 ± 0.8 | 5.7 ± 0.9 | 4.6 ± 1.1 | 5.2 ± 1.0 | 0.040 |
| HDL cholesterol (mmol/L) | 1.2 ± 0.3 | 1.1 ± 0.3 | 1.1 ± 0.2 | 1.0 ± 0.2 | < 0.001 |
| LDL cholesterol (mmol/L) | 2.4 ± 0.6 | 2.7 ± 0.8 | 2.5 ± 0.9 | 2.9 ± 0.9 | 0.70 |
| Hypertension, n (%) | 48 (18) | 78 (35) | 124 (45) | 130 (58) | < 0.001 |
| Pulmonary diseases, n (%) | 148 (57) | 155 (70) | 196 (71) | 105 (47) | < 0.001 |
| Current smoking, n (%) | 0 (0) | 8 (4) | 56 (20) | 20 (9) | < 0.001 |
| Treatment (cardiometabolic medications)a, n (%) | 76 (29) | 64 (29) | 76 (28) | 60 (24) | 0.555 |
| β-blocker, n (%) | 26 (10) | 18 (8) | 24 (9) | 0 (0) | < 0.001 |
| ACE inhibitor, n (%) | 39 (15) | 31 (14) | 28 (10) | 15 (7) | 0.018 |
| CCB, n (%) | 18 (7) | 15 (7) | 32 (12) | 50 (22) | < 0.001 |
| Diuretic, n (%) | 31 (12) | 28 (13) | 28 (10) | 10 (4) | 0.015 |
| Variable | None DM | DM | P value | ||
|---|---|---|---|---|---|
| Moderate obesity (24 ≤ BMI < 35) (n = 213) | Severe obesity (BMI ≥ 35) (n = 190) | Moderate obesity (24 ≤ BMI < 35) (n = 215) | Severe obesity (BMI ≥ 35) (n = 205) | ||
| Values are presented as mean ± standard deviation. Variables with missing data exceeding 10% (peak respiratory rate, breathing reserve, and peak blood pressure) were not included as covariates in the propensity score weighting models. Missing values were handled using multiple imputation, and sensitivity analyses comparing original and imputed datasets yielded consistent results. P values were calculated using one-way analysis of variance or the Kruskal–Wallis test, as appropriate. P values were calculated using the original dataset. For most variables, results were consistent after multiple imputation. Breathing reserve was the only variable showing discrepant significance (original dataset: P = 0.191; after imputation: P < 0.001) and should therefore be interpreted with caution. Implausible values were identified based on predefined physiological ranges and set to missing prior to analysis. Peak VO2: maximal oxygen consumption; RER: respiratory exchange ratio; VE: minute ventilation; VCO2: carbon dioxide output; FEV1: forced expiratory volume in 1 second; FVC: forced vital capacity; MVV: maximal voluntary ventilation. | |||||
| MVV (L/min) | 93.5 ± 34.1 | 103.8 ± 28.2 | 97.4 ± 30.8 | 96.0 ± 29.7 | 0.004 |
| Forced vital capacity (L) | 3.6 ± 1.1 | 3.8 ± 0.9 | 3.6 ± 0.8 | 3.5 ± 0.7 | < 0.001 |
| FEV1 (L) | 3.0 ± 0.9 | 3.1 ± 0.7 | 2.9 ± 0.7 | 2.9 ± 0.7 | 0.004 |
| FEV1/FVC (%) | 0.8 ± 0.1 | 0.8 ± 0.1 | 0.8 ± 0.1 | 0.8 ± 0.1 | 0.355 |
| Resting heart rate (beats/min) | 93.5 ± 14.1 | 95.2 ± 12.7 | 86.0 ± 12.8 | 96.1 ± 11.5 | < 0.001 |
| Resting systolic blood pressure (mm Hg) | 122.7 ± 17.1 | 128.2 ± 21.2 | 131.2 ± 26.5 | 138.3 ± 14.8 | < 0.001 |
| Resting diastolic blood pressure (mm Hg) | 83.8 ± 10.6 | 85.8 ± 16.1 | 82.2 ± 12.2 | 92.6 ± 10.1 | < 0.001 |
| Peak RER | 1.1 ± 0.1 | 1.1 ± 0.1 | 1.1 ± 0.1 | 1.1 ± 0.1 | < 0.001 |
| Peak VO2 (L/min) | 1.7 ± 0.4 | 2.0 ± 0.5 | 1.4 ± 0.4 | 2.0 ± 0.5 | < 0.001 |
| Peak VO2 (mL/kg/min) | 18.5 ± 3.8 | 16.9 ± 3.3 | 17.9 ± 3.5 | 16.8 ± 3.0 | < 0.001 |
| Peak metabolic equivalents (METs) | 5.7 ± 1.1 | 5.1 ± 0.9 | 5.2 ± 1.0 | 5.1 ± 0.9 | < 0.001 |
| Peak work rate (W) | 136.6 ± 37.3 | 158.2 ± 41.9 | 125.7 ± 33.8 | 151.2 ± 40.6 | < 0.001 |
| Peak work rate (W/kg) | 1.5 ± 0.3 | 1.3 ± 0.3 | 1.5 ± 0.3 | 1.3 ± 0.3 | < 0.001 |
| Peak ventilation (L/min) | 53.3 ± 12.3 | 61.0 ± 16.2 | 48.8 ± 12.8 | 58.5 ± 15.3 | < 0.001 |
| Peak VCO2 (L/min) | 2.0 ± 0.5 | 2.3 ± 0.6 | 1.8 ± 0.4 | 2.3 ± 0.6 | < 0.001 |
| Peak respiratory rate (breaths/min) | 32.6 ± 5.6 | 34.6 ± 8.3 | 30.1 ± 5.7 | 34.4 ± 8.3 | < 0.001 |
| Breathing reserve (%) | 69.3 ± 20.9 | 67.3 ± 19.5 | 70.9 ± 20.1 | 66.7 ± 22.2 | 0.191 |
| VE/VCO2 slope | 26.7 ± 2.3 | 26.3 ± 2.3 | 27.3 ± 2.9 | 26.0 ± 2.9 | < 0.001 |
| VO2 at anaerobic threshold (L/min) | 1.1 ± 0.2 | 1.3 ± 0.3 | 1.0 ± 0.2 | 1.3 ± 0.3 | < 0.001 |
| Peak O2 pulse (mL/beat) | 11.1 ± 2.7 | 14.6 ± 5.1 | 10.5 ± 2.2 | 13.4 ± 3.0 | < 0.001 |
| ΔVO2/ΔWork rate (mL/min/W) | 12.3 ± 1.5 | 12.8 ± 1.5 | 11.7 ± 1.8 | 13.2 ± 1.8 | < 0.001 |
| Peak heart rate (beats/min) | 152.7 ± 15.2 | 149.6 ± 15.7 | 144.7 ± 21.4 | 147.0 ± 12.8 | < 0.001 |
| Percent predicted maximal heart rate (%) | 80 ± 11 | 81 ± 14 | 80 ± 5 | 80 ± 10 | 0.001 |
| Peak systolic blood pressure (mm Hg) | 176.3 ± 25.8 | 195.8 ± 26.0 | 179.4 ± 34.3 | 193.3 ± 27.7 | < 0.001 |
| Peak diastolic blood pressure (mm Hg) | 85.1 ± 18.7 | 89.8 ± 17.9 | 87.3 ± 17.4 | 93.2 ± 14.4 | < 0.001 |
| Group | Peak VO2 (mean ± SE) |
|---|---|
| Data are presented as mean ± standard error (SE), predicted values with 95% confidence intervals, or regression coefficients, as appropriate. All analyses were conducted using propensity score weighting to balance baseline covariates across obesity–diabetes phenotypes. Predicted values were derived from a propensity score–weighted linear regression model including a BMI × diabetes interaction term (P for interaction < 0.001). Predicted values and regression estimates were derived from the same propensity score–weighted linear regression model including BMI category, T2DM status, their interaction term, and all covariates. Medication classes were encoded as separate binary indicators because treatment categories were not mutually exclusive. BMI: body mass index; DM: diabetes mellitus; PSW: propensity score weighting; VO2: oxygen uptake. The footnote applies to Tables 3–7. | |
| Moderate obesity, no DM | 1.69 ± 0.03 |
| Severe obesity, no DM | 1.95 ± 0.04 |
| Moderate obesity, DM | 1.44 ± 0.02 |
| Severe obesity, DM | 1.95 ± 0.03 |
| BMI category | Diabetes status | Predicted peak VO2 (95% CI) |
|---|---|---|
| Moderate obesity | No DM | 1.54 (1.50–1.58) |
| Severe obesity | No DM | 1.74 (1.68–1.80) |
| Moderate obesity | DM | 1.12 (1.05–1.18) |
| Severe obesity | DM | 1.72 (1.67–1.77) |
| Term | Estimate (β) | Std. error | 95% CI | P value |
|---|---|---|---|---|
| Intercept | 0.3073 | 0.1308 | (0.0509, 0.5637) | 0.019 |
| Severe obesity | 0.0187 | 0.0339 | (−0.0478, 0.0851) | 0.582 |
| T2DM | −0.2186 | 0.0412 | (−0.2993, −0.1379) | < 0.001 |
| Age | −0.0019 | 0.0014 | (−0.0048, 0.0009) | 0.186 |
| Sex (male) | −0.0482 | 0.0523 | (−0.1507, 0.0543) | 0.357 |
| Smoking | −0.0799 | 0.0530 | (−0.1838, 0.0240) | 0.132 |
| Hypertension | 0.0009 | 0.0273 | (−0.0526, 0.0544) | 0.974 |
| β-blocker use (yes) | −0.0111 | 0.044 | (−0.0974, 0.0752) | 0.801 |
| ACEI use (yes) | −0.0121 | 0.0337 | (−0.0781, 0.0539) | 0.719 |
| CCB use (yes) | 0.0485 | 0.0293 | (−0.0089, 0.1059) | 0.098 |
| Diuretic use (yes) | −0.0332 | 0.033 | (−0.1578, 0.0286) | 0.062 |
| Diabetes duration | −0.0145 | 0.0061 | (−0.0265, −0.0026) | 0.017 |
| Lean body mass | 0.0271 | 0.0025 | (0.0222, 0.0320) | < 0.001 |
| Severe obesity × T2DM | 0.2785 | 0.0540 | (0.1727, 0.3843) | < 0.001 |
| Variable | Weighted r | P value |
|---|---|---|
| 2-h postprandial glucose (mmol/L) | −0.27 | < 0.001 |
| Lean body mass (kg) | 0.7 | < 0.001 |
| Variable | Estimate | Std. error | t value | P value |
|---|---|---|---|---|
| Intercept | −0.13 | 0.09 | −1.47 | 0.143 |
| 2-h postprandial glucose (mmol/L) | −0.01 | 0 | −6.63 | < 0.001 |
| Lean body mass (kg) | 0.04 | 0 | 27.21 | < 0.001 |
| Age (years) | 0 | 0 | −1.55 | 0.121 |
| Sex (reference: female) | - | - | - | - |