Journal of Clinical Medicine Research, ISSN 1918-3003 print, 1918-3011 online, Open Access
Article copyright, the authors; Journal compilation copyright, J Clin Med Res and Elmer Press Inc
Journal website https://jocmr.elmerjournals.com

Original Article

Volume 18, Number 5, May 2026, pages 292-300


Prescribing of GLP-1 and GIP/GLP-1 Receptor Agonists and Other Glucose-Lowering Drugs Requiring Special Caution in Elderly Japanese People With Type 2 Diabetes: A Preliminary Report

Figures

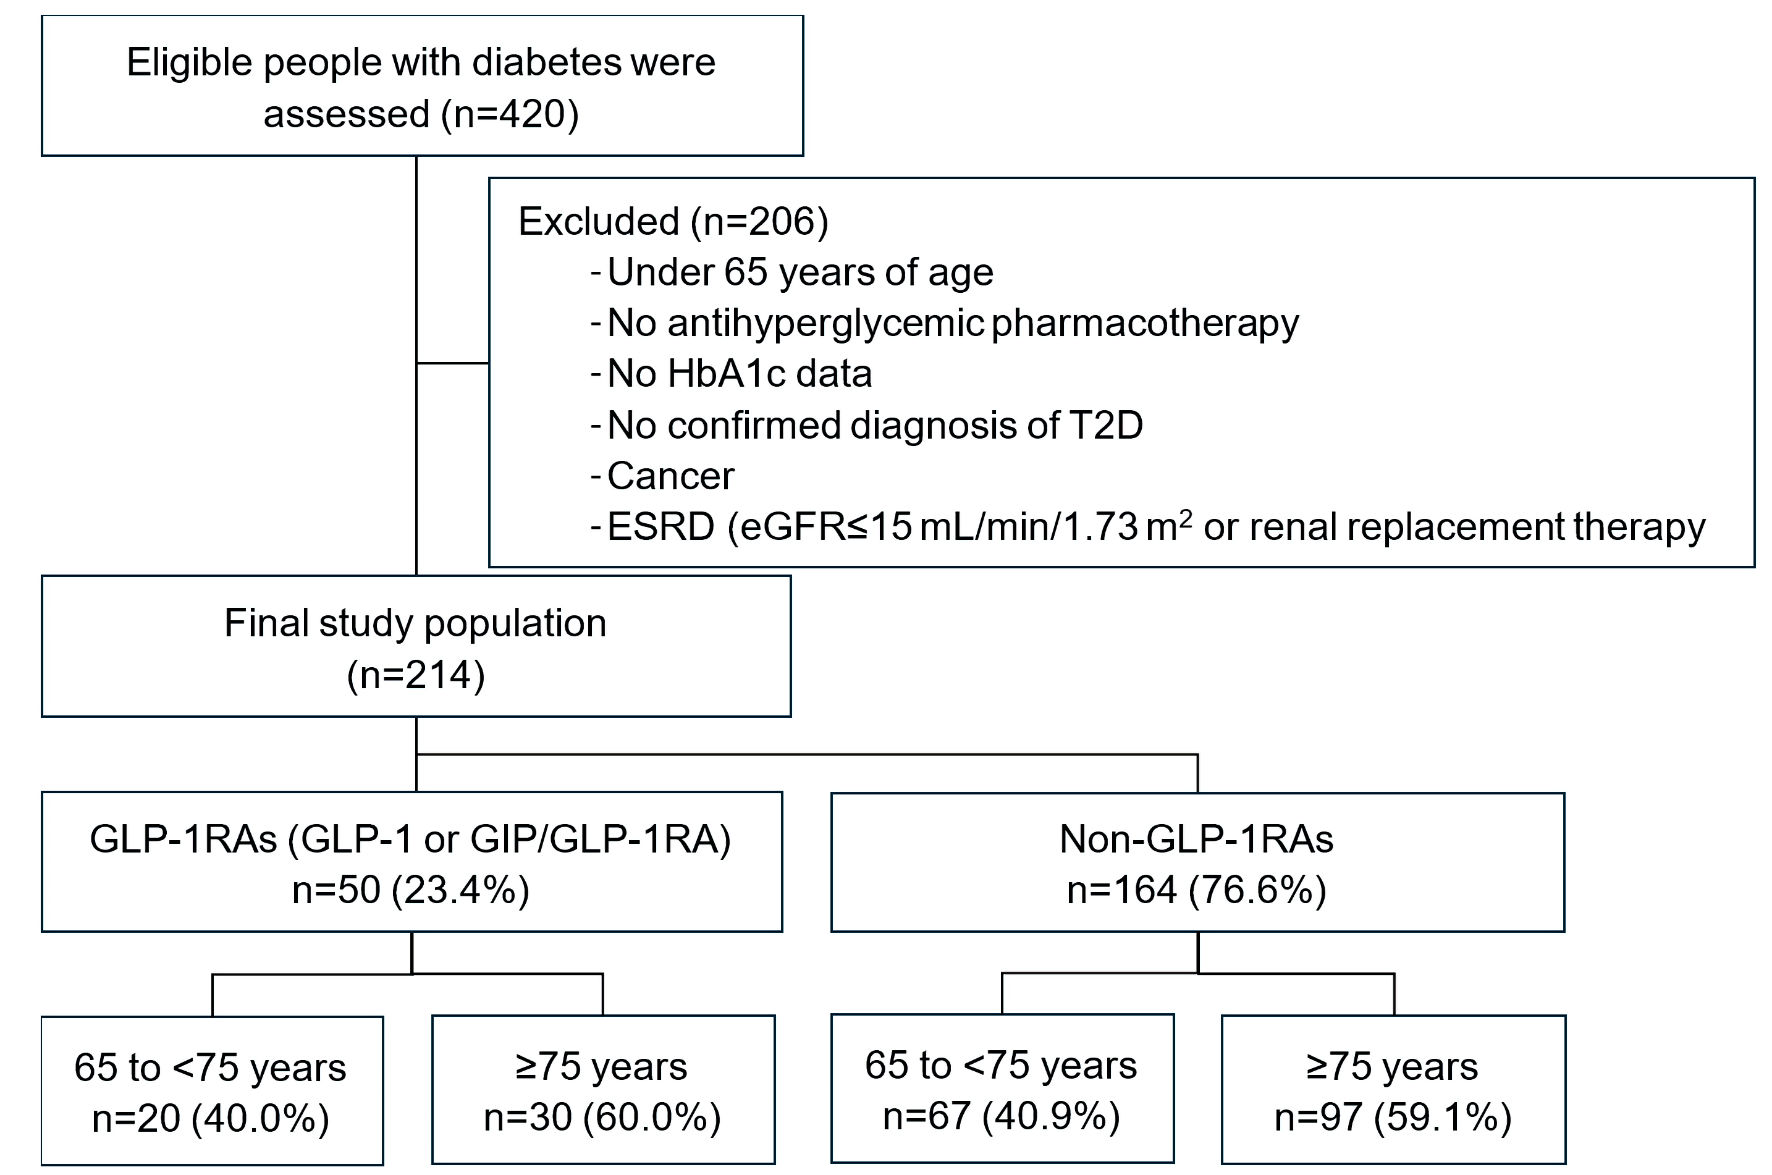
↓  Figure 1. Flow diagram of patient selection and classification by GLP-1RA use. eGFR: estimated glomerular filtration rate; ESRD: end-stage renal disease; GIP/GLP-1RA: glucose-dependent insulinotropic polypeptide/glucagon-like peptide-1 receptor agonist; GLP-1RA: glucagon-like peptide-1 receptor agonist; T2D: type 2 diabetes; HbA1c: glycated hemoglobin A1c.
Figure 1.
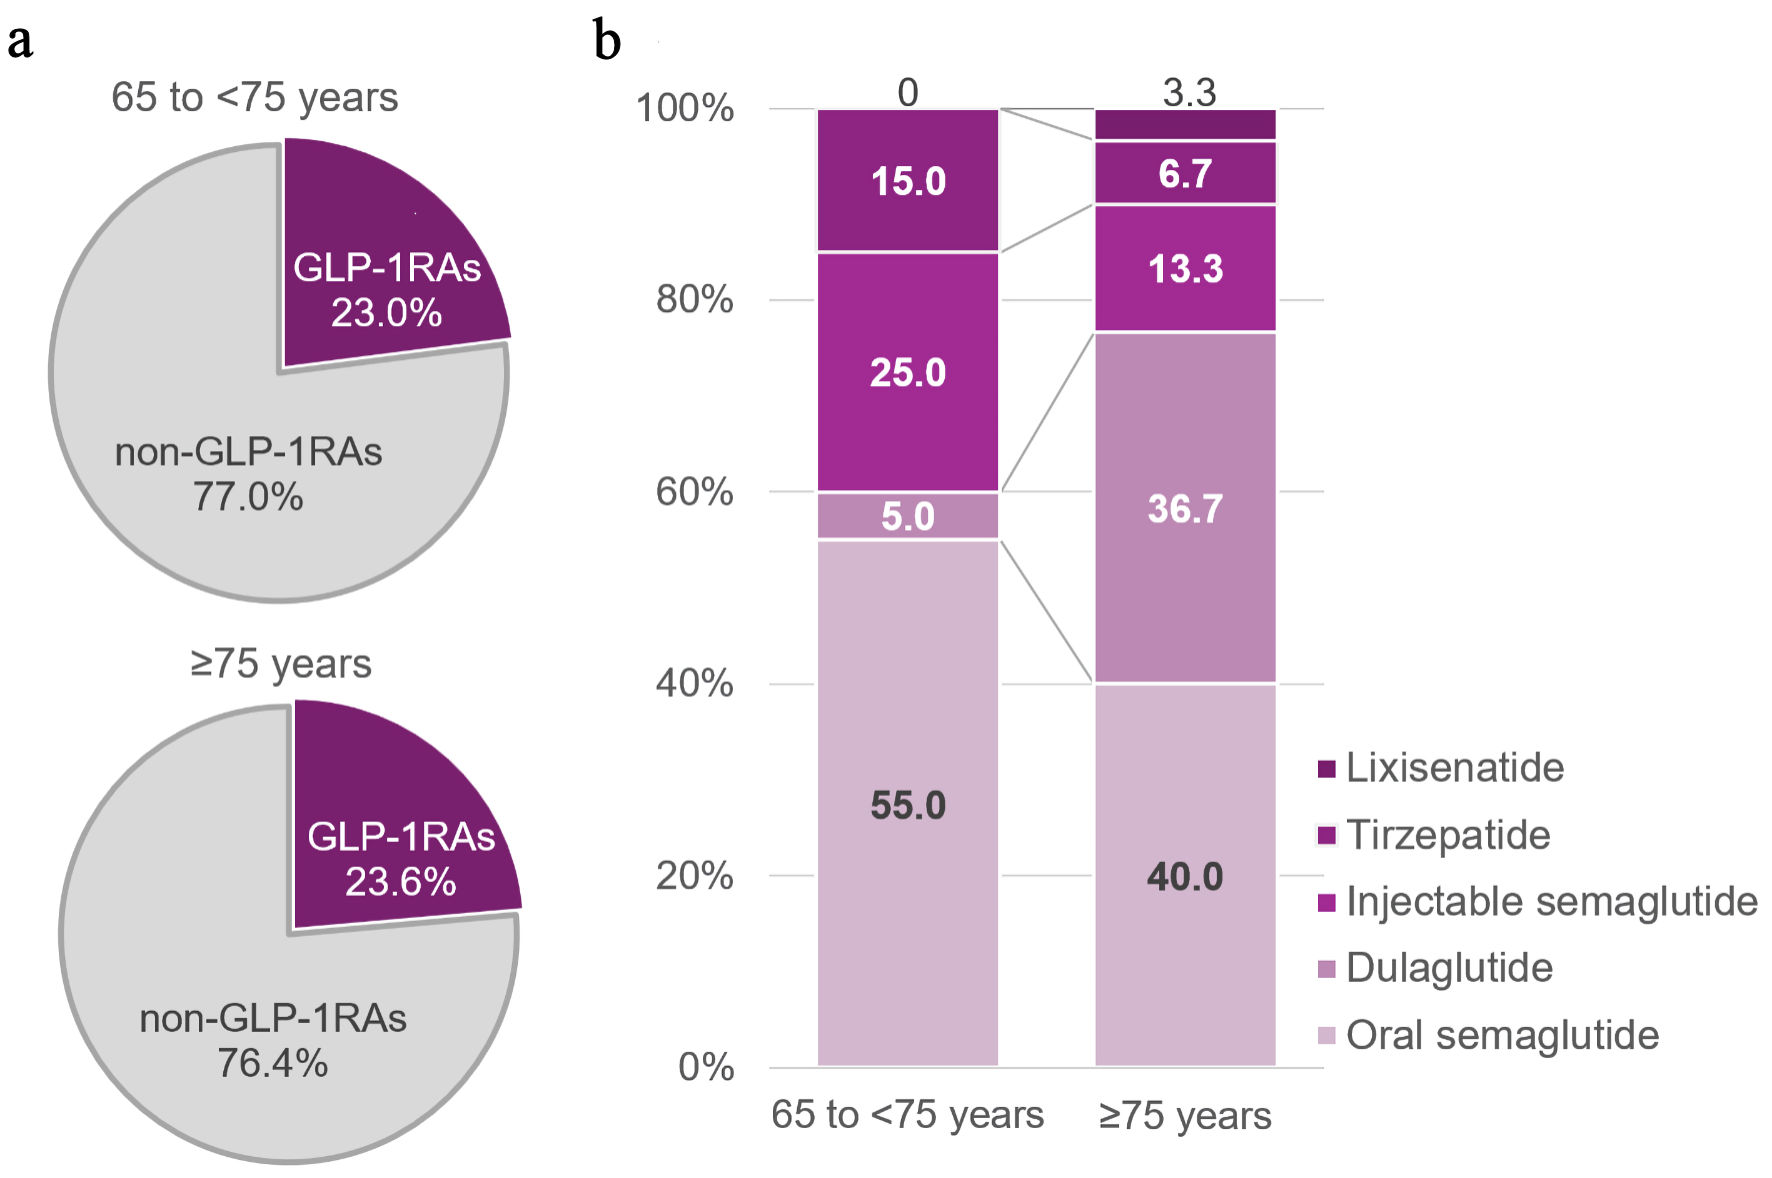
↓  Figure 2. Prescribing frequency and type of GLP-1RAs by age group. (a) Percentages were calculated among all participants within each age group. (b) Percentages were calculated among GLP-1RA users within each age group. GLP-1RAs: glucagon-like peptide-1 receptor agonist and glucose-dependent insulinotropic polypeptide/glucagon-like peptide-1 receptor agonist.
Figure 2.
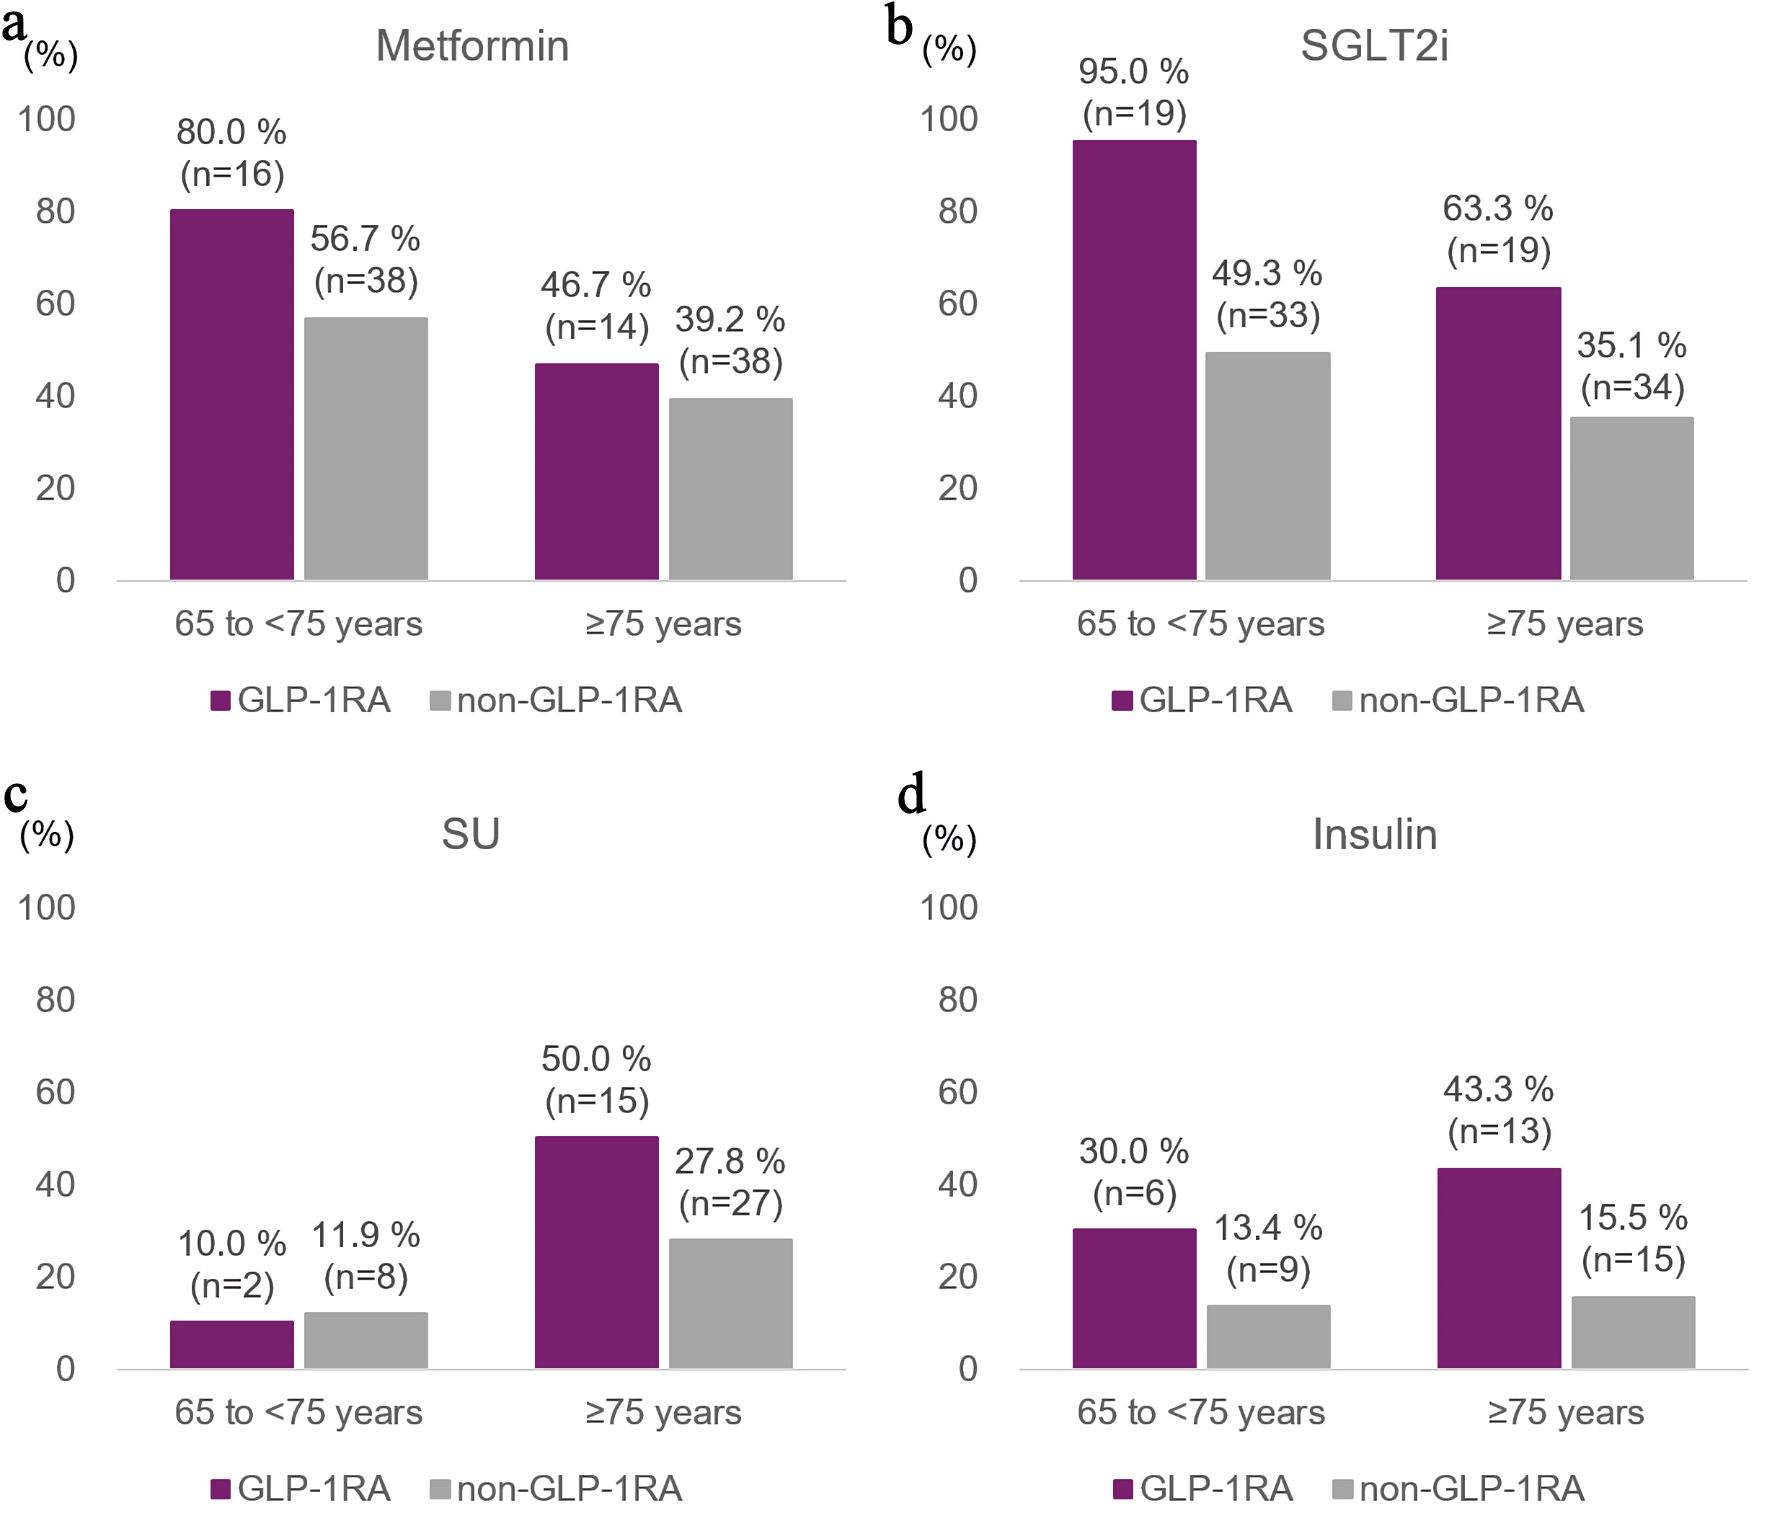
↓  Figure 3. Concomitant use of glucose-lowering and cardiometabolic drugs by age group and GLP-1RAs treatment status. GLP-1RAs: glucagon-like peptide-1 receptor agonist and glucose-dependent insulinotropic polypeptide/glucagon-like peptide-1 receptor agonist; SGLT2i: sodium-glucose cotransporter 2 inhibitor; SU: sulfonylurea.
Figure 3.

Tables

↓  Table 1. Characteristics of Elderly People With T2D, Stratified by Use of GLP-1RAs
 
All (n = 214)GLP-1RAs (n = 50)Non-GLP-1RAs (n = 164)
Data are presented as mean ± standard deviation or n (%) referring to the population within each group. The numbers shown on the left side of each variable indicate the number of participants with available data for that variable; therefore, denominators may vary due to missing values. Percentages for BMI and eGFR were calculated using the number of people with available measurements as the denominator. T2D: type 2 diabetes; BMI: body mass index; SBP: systolic blood pressure; DBP: diastolic blood pressure; HDL: high-density lipoprotein; LDL: low-density lipoprotein; eGFR: estimated glomerular filtration rate; GLD: glucose-lowering drug; GLP-1RAs: glucagon-like peptide-1 receptor agonist and glucose-dependent insulinotropic polypeptide/glucagon-like peptide-1 receptor agonist; SGLT2i: sodium-glucose cotransporter 2 inhibitor; SU: sulfonylurea; DPP-4i: dipeptidyl peptidase-4 inhibitor; GIP/GLP-1RA: glucose-dependent insulinotropic polypeptide/glucagon-like peptide-1 receptor agonist.
Age, years21476.0 ± 6.55075.5 ± 6.516476.2 ± 6.5
  65 to < 75 years87(40.7)20(40.0)67(40.9)
  ≥ 75 years127(59.3)30(60.0)97(59.1)
Male127(59.3)35(16.3)92(43.0)
BMI, kg/m211024.9 ± 4.02725.6 ± 4.58324.6 ± 3.8
  < 25.060(54.5)10(37.0)50(60.2)
  ≥ 25.050(45.5)17(63.0)33(39.8)
HbA1c, %2147.0 ± 0.9507.0 ± 0.71647.0 ± 0.9
  < 7.0%109(50.9)24(48.0)85(51.8)
  7.0 to < 8.0%86(40.2)23(46.0)63(38.4)
  ≥ 8.0%19(8.9)3(6.0)16(9.8)
SBP, mm Hg198134.0 ± 16.046132 ± 15.0152134.6 ± 16.3
DBP, mm Hg19774.7 ± 10.24675.9 ± 8.715174.3 ± 10.6
Total cholesterol, mg/dL204174.9 ± 28.347169.1 ± 30.8157176.6 ± 27.3
Triglyceride, mg/dL196141.2 ± 79.346137.2 ± 68.4150142.5 ± 82.5
HDL cholesterol, mg/dL20756.9 ± 15.54952.7 ± 15.815858.2 ± 15.3
LDL cholesterol, mg/dL19889.8 ± 25.54688.0 ± 26.215290.3 ± 15.8
eGFR, mL/min/1.73m220266.5 ± 17.24669.2 ± 17.615665.7 ± 17.0
  G1 + G2 (≥ 60)27(63.4)31(67.4)97(62.2)
  G3a (45–59)53(26.2)12(26.1)41(26.3)
  G3b (30–44)19(9.4)3(6.5)16(10.3)
  G4 (15–29)2(1.0)0(0.0)2(1.3)
Number of GLDs2142.2 ± 1.1503.2 ± 0.81641.9 ± 0.9
  GLP-1 and GIP/GLP-1RA50(23.4)50(23.4)164(76.6)
    Oral semaglutide23(46.0)23(46.0)
    Dulaglutide12(24.0)12(24.0)
    Injectable semaglutide9(18.0)9(18.0)
    Tirzepatide5(10.0)5(10.0)
    Lixisenatide1(2.0)1(2.0)
  Metformin106(49.5)30(60.0)76(46.3)
    Metformin dosage, mg/day106809 ± 465301,025 ± 53976724 ± 405
  SGLT2i105(49.1)38(76.0)67(40.9)
  SU52(24.3)17(34.0)35(21.3)
  Insulin43(20.1)19(38.0)24(14.6)
  DPP-4i107(50.0)0(0.0)107(65.2)
  Antihypertensive drug129(60.3)33(66.0)96(58.5)
  Dyslipidemia drug131(61.2)25(50.0)106(64.6)


↓  Table 2. Age-Stratified Characteristics of GLP-1RAs users and Non-Users Among Elderly People With T2D
 
Variables65 to < 75 years (n = 87)≥ 75 years, (n = 127)
GLP-1RAs (n = 20)Non-GLP-1RAs (n = 67)GLP-1RAs (n = 30)Non-GLP-1RAs (n = 97)
Data are presented as mean ± standard deviation. The numbers shown on the left side of each variable indicate the number of participants with available data for that variable; therefore, denominators may vary due to missing values. T2D: type 2 diabetes; BMI: body mass index; SBP: systolic blood pressure; DBP: diastolic blood pressure; HDL: high-density lipoprotein; LDL: low-density lipoprotein; eGFR: estimated glomerular filtration rate; CKD: chronic kidney disease; GLD: glucose-lowering drug; GLP-1RAs: glucagon-like peptide-1 receptor agonist and glucose-dependent insulinotropic polypeptide/glucagon-like peptide-1 receptor agonist; SGLT2i: sodium glucose co-transporter 2 inhibitor.
Age, years2069.0 ± 3.16770.1 ± 3.23079.8 ± 4.09780.4 ± 4.6
BMI, kg/m2827.1 ± 5.93825.3 ± 3.91924.9 ± 3.84524.0 ± 3.6
HbA1c, %206.9 ± 0.6676.8 ± 0.8307.1 ± 0.7977.2 ± 1.0
SBP, mm Hg19132.2 ± 13.765131.4 ± 1627131.9 ± 16.187137.0 ± 16.2
DBP, mm Hg1976.3 ± 8.96476.3 ± 9.82775.7 ± 8.78772.8 ± 11.0
Total-cholesterol, mg/dL18175.1 ± 30.261174.8 ± 26.929165.4 ± 31.196177.7 ± 27.7
Triglyceride, mg/dL18140.1 ± 76.462157.6 ± 9428135.3 ± 64.288131.8 ± 72.0
HDL cholesterol, mg/dL1952.7 ± 14.76355.2 ± 14.43052.7 ± 16.79560.2 ± 15.6
LDL cholesterol, mg/dL1888.3 ± 29.26288.0 ± 26.52887.9 ± 24.79091.9 ± 24.6
eGFR, mL/min/1.73 m21967.7 ± 18.56470.1 ± 17.12770.3 ± 17.29262.6 ± 16.3
Number of GLDs203.2 ± 0.7672.0 ± 1.1303.2 ± 0.8971.9 ± 0.9
Metformin dosage, mg/day161,141 ± 61938796 ± 47514893 ± 41338651 ± 311