Journal of Clinical Medicine Research, ISSN 1918-3003 print, 1918-3011 online, Open Access
Article copyright, the authors; Journal compilation copyright, J Clin Med Res and Elmer Press Inc
Journal website https://jocmr.elmerjournals.com

Original Article

Volume 18, Number 4, April 2026, pages 234-242


Usefulness of Blood Rheology as a Predictor of Primary Cardiovascular Disease Events in Patients With Stage G3 Chronic Kidney Disease

Figures

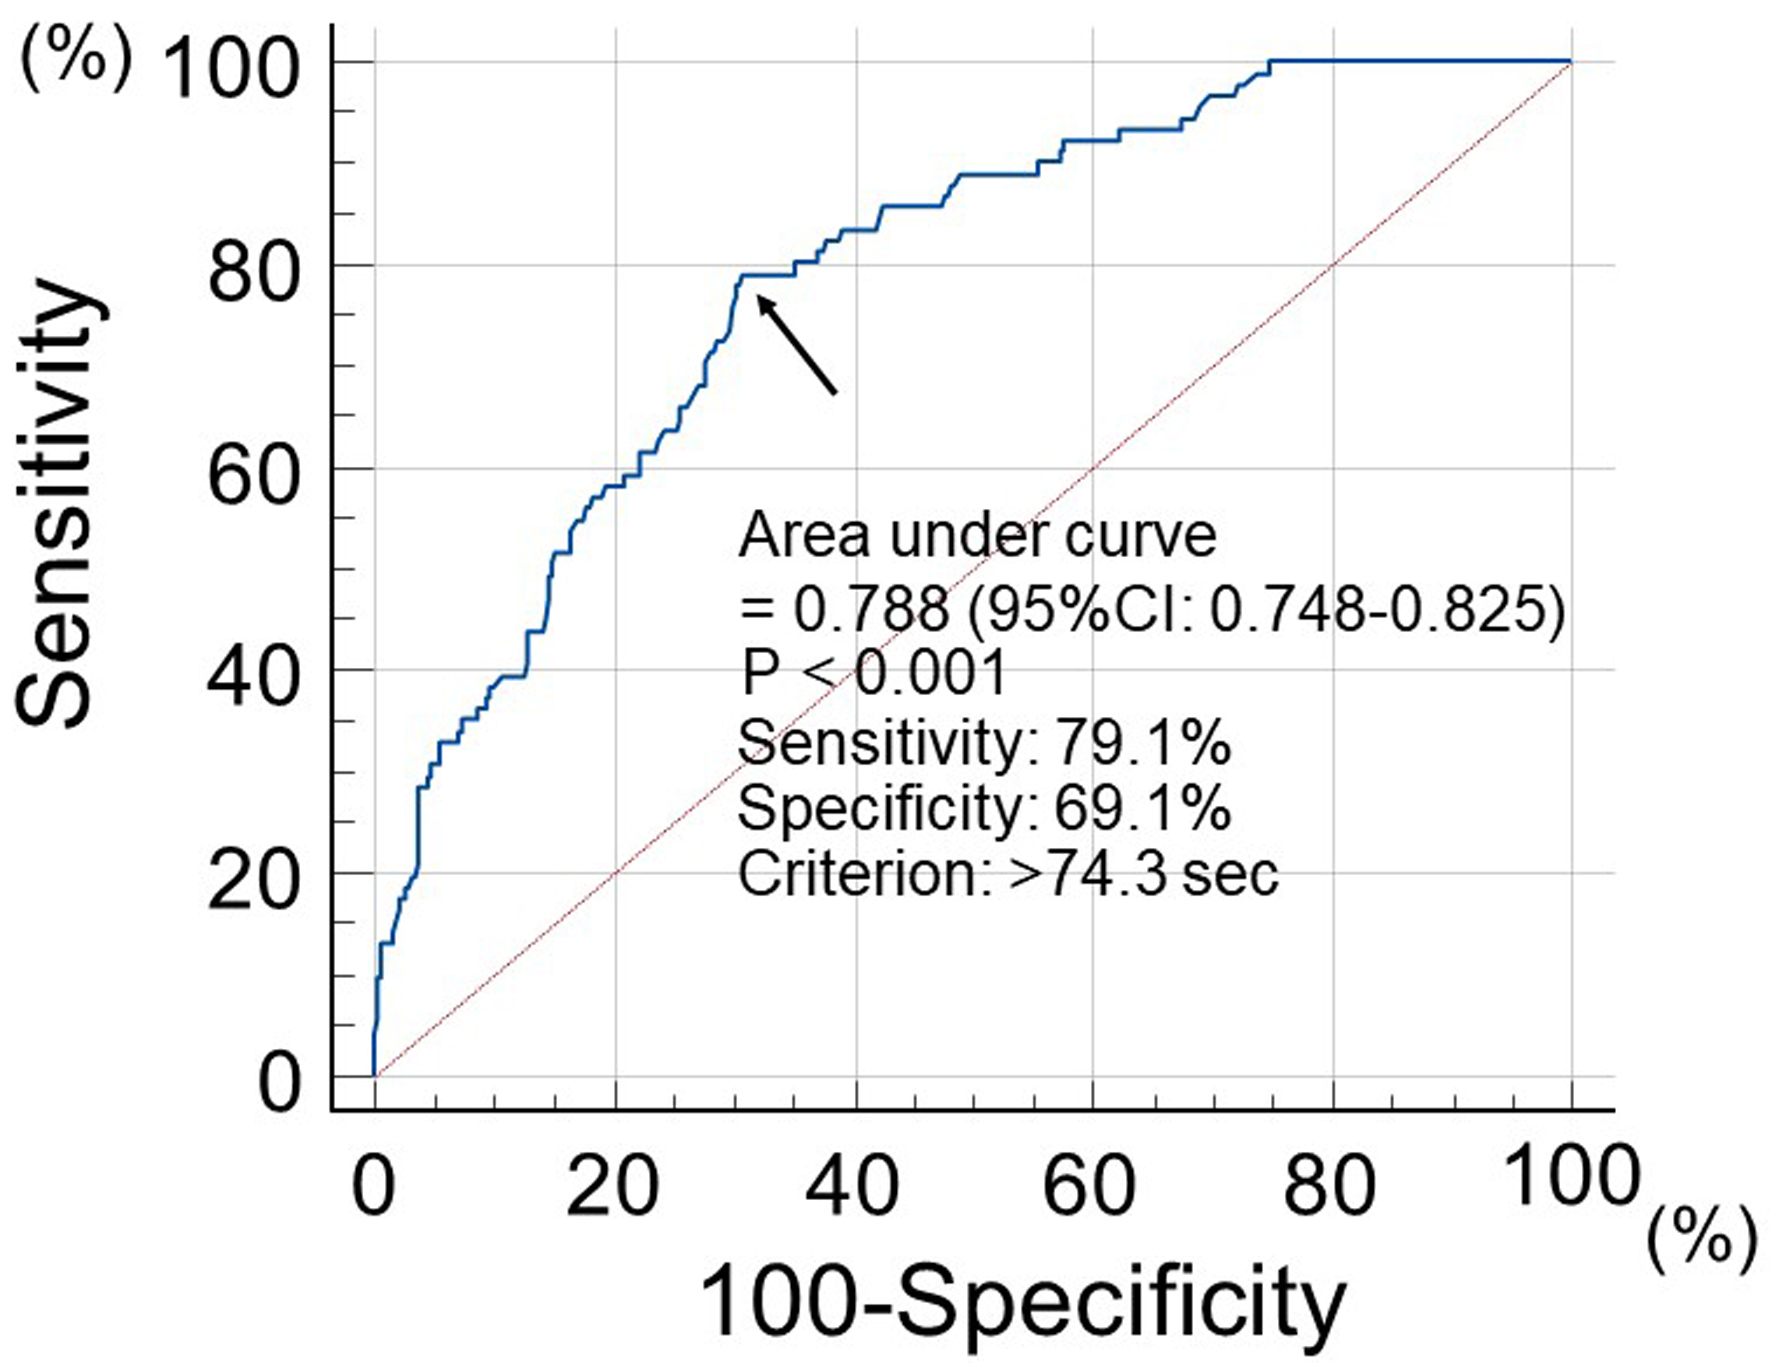
↓  Figure 1. Prediction value of MACEs incidence at follow-up period using WBPT. Receiver operating characteristic curve analysis indicated that a cut-off value for WBPT of 74.3 s yielded the largest area under the curve to predict MACEs. Arrows indicate the optimal cut-off point. MACEs: major adverse cardiovascular events; WBPT: whole blood passage time.
Figure 1.
↓  Figure 2. Kaplan–Meier curve analysis for the incidence of MACEs. The Kaplan–Meier curve confirmed that group H had a significantly higher incidence of MACEs compared with group L (log-rank test, P < 0.001). MACEs: major adverse cardiovascular events.
Figure 2.

Tables

↓  Table 1. Clinical Characteristics of the Studied Groups
 
CharacteristicsOverallGroup LGroup HP value
Continuous variables were expressed as means and standard deviations or median (interquartile range). AF: autofluorescence; AU: arbitrary unit; DPP-4: dipeptidyl peptidase-4; eGFR: estimated glomerular filtration rate; FBG: fasting blood glucose; HDL: high-density lipoprotein; hs-CRP: high-sensitivity C-reactive protein; LDL: low-density lipoprotein; r-AIx: radial augmentation index; RAS: renin–angiotensin system; WBPT: whole blood passage time.
n (male/female)417 (144/273)255 (91/164)162 (53/109)0.535
Age (years)72 ± 1271 ± 1075 ± 130.062
WBPT (s)68.6 ± 11.155.9 ± 11.088.5 ± 11.2< 0.001
Risk factors
  Obesity, n (%)124 (30)76 (30)48 (30)0.964
  Current smoker, n (%)74 (18)36 (14)38 (24)0.014
  Hypertension, n (%)298 (72)181 (71)117 (72)0.785
  Dyslipidemia, n (%)293 (70)178 (70)115 (71)0.797
  Diabetes mellitus, n (%)134 (32)67 (26)67 (41)0.001
Clinical parameters
  eGFR (mL/min/1.73 m2)47 ± 650 ± 644 ± 5< 0.001
  LDL cholesterol (mg/dL)129 ± 35128 ± 35131 ± 350.414
  Triglyceride (mg/dL)122 ± 66108 ± 61143 ± 67< 0.001
  HDL cholesterol (mg/dL)62 ± 1564 ± 1459 ± 140.001
  FBG (mg/dL)116 ± 27114 ± 27119 ± 270.125
  hs-CRP (mg/L)0.80 (0.30–1.50)0.70 (0.30–1.20)0.86 (0.29–1.97)0.055
  Skin AF (AU)2.7 ± 0.52.6 ± 0.52.8 ± 0.5< 0.001
  Albuminuria, n (%)213 (51)111 (44)102 (63)< 0.001
  r-AIx (%)87 ± 1185 ± 989 ± 12< 0.001
Medication
  RAS inhibitor, n (%)156 (37)106 (42)50 (31)0.027
  Statin, n (%)148 (36)96 (38)52 (32)0.249
  Sulfonylurea, n (%)77 (19)45 (18)32 (20)0.591
  Metformin, n (%)62 (15)35 (14)27 (17)0.412
  DPP-4 inhibitor, n (%)75 (18)41 (16)34 (21)0.204


↓  Table 2. Parameters at Registration of Patients With and Without MACEs
 
CharacteristicsMACEs (−)MACEs (+)P value
Continuous values are mean ± SD. AF: autofluorescence; AU: arbitrary unit; DPP-4: dipeptidyl peptidase-4; eGFR: estimated glomerular filtration rate; FBG: fasting blood glucose; HDL: high-density lipoprotein; hs-CRP: high-sensitivity C-reactive protein; LDL: low-density lipoprotein; MACEs: major adverse cardiovascular events; r-AIx: radial augmentation index; RAS: renin–angiotensin system.
n (male/female)343 (119/224)74 (25/49)0.798
Age (years)71 ± 1277 ± 11< 0.001
Obesity, n (%)104 (30)20 (27)0.575
Current smoker, n (%)57 (17)17 (22)0.051
Hypertension, n (%)240 (70)58 (78)0.147
Dyslipidemia, n (%)242 (71)51 (69)0.780
Diabetes mellitus, n (%)89 (26)45 (61)< 0.001
eGFR (mL/min/1.73 m2)48 ± 644 ± 7< 0.001
LDL cholesterol (mg/dL)129 ± 34130 ± 350.691
Triglyceride (mg/dL)119 ± 66139 ± 620.051
HDL cholesterol (mg/dL)63 ± 1559 ± 140.072
FBG (mg/dL)114 ± 27116 ± 27< 0.001
hs-CRP (mg/L)0.80 (0.30–1.50)0.80 (0.27–1.60)0.624
Skin AF (AU)2.6 ± 0.53.0 ± 0.5< 0.001
Albuminuria n (%)162 (47)51 (69)< 0.001
r-AIx86 ± 1093 ± 11< 0.001
RAS inhibitor, n (%)140 (41)21 (21)0.002
Statin, n (%)127 (37)21 (28)0.159
Sulfonylurea, n (%)63 (18)14 (19)0.912
Metformin, n (%)50 (15)12 (16)0.720
DPP-4 inhibitor, n (%)58 (17)17 (23)0.219


↓  Table 3. Multivariate Cox Regression Analysis for MACEs
 
VariablesHR95% CIP value
AF: autofluorescence; AU: arbitrary unit; CI: confidence interval; eGFR: estimated glomerular filtration rate; HR: hazard ratio; MACEs: major adverse cardiovascular events; r-AIx: radial augmentation index; RAS: renin–angiotensin system.
Group H (vs. group L)3.892.12–7.10< 0.001
Diabetes mellitus2.111.26–4.540.004
Age (≥ 75 years)1.981.35–3.910.006
RAS inhibitor0.510.27–0.880.018
Skin AF (≥ 2.7 AU)1.951.12–3.400.019
r-AIx (≥ 88%)1.781.03–3.100.041
Albuminuria1.220.51–1.860.353
eGFR (stage 3A vs. stage 3B)1.120.67–2.210.536