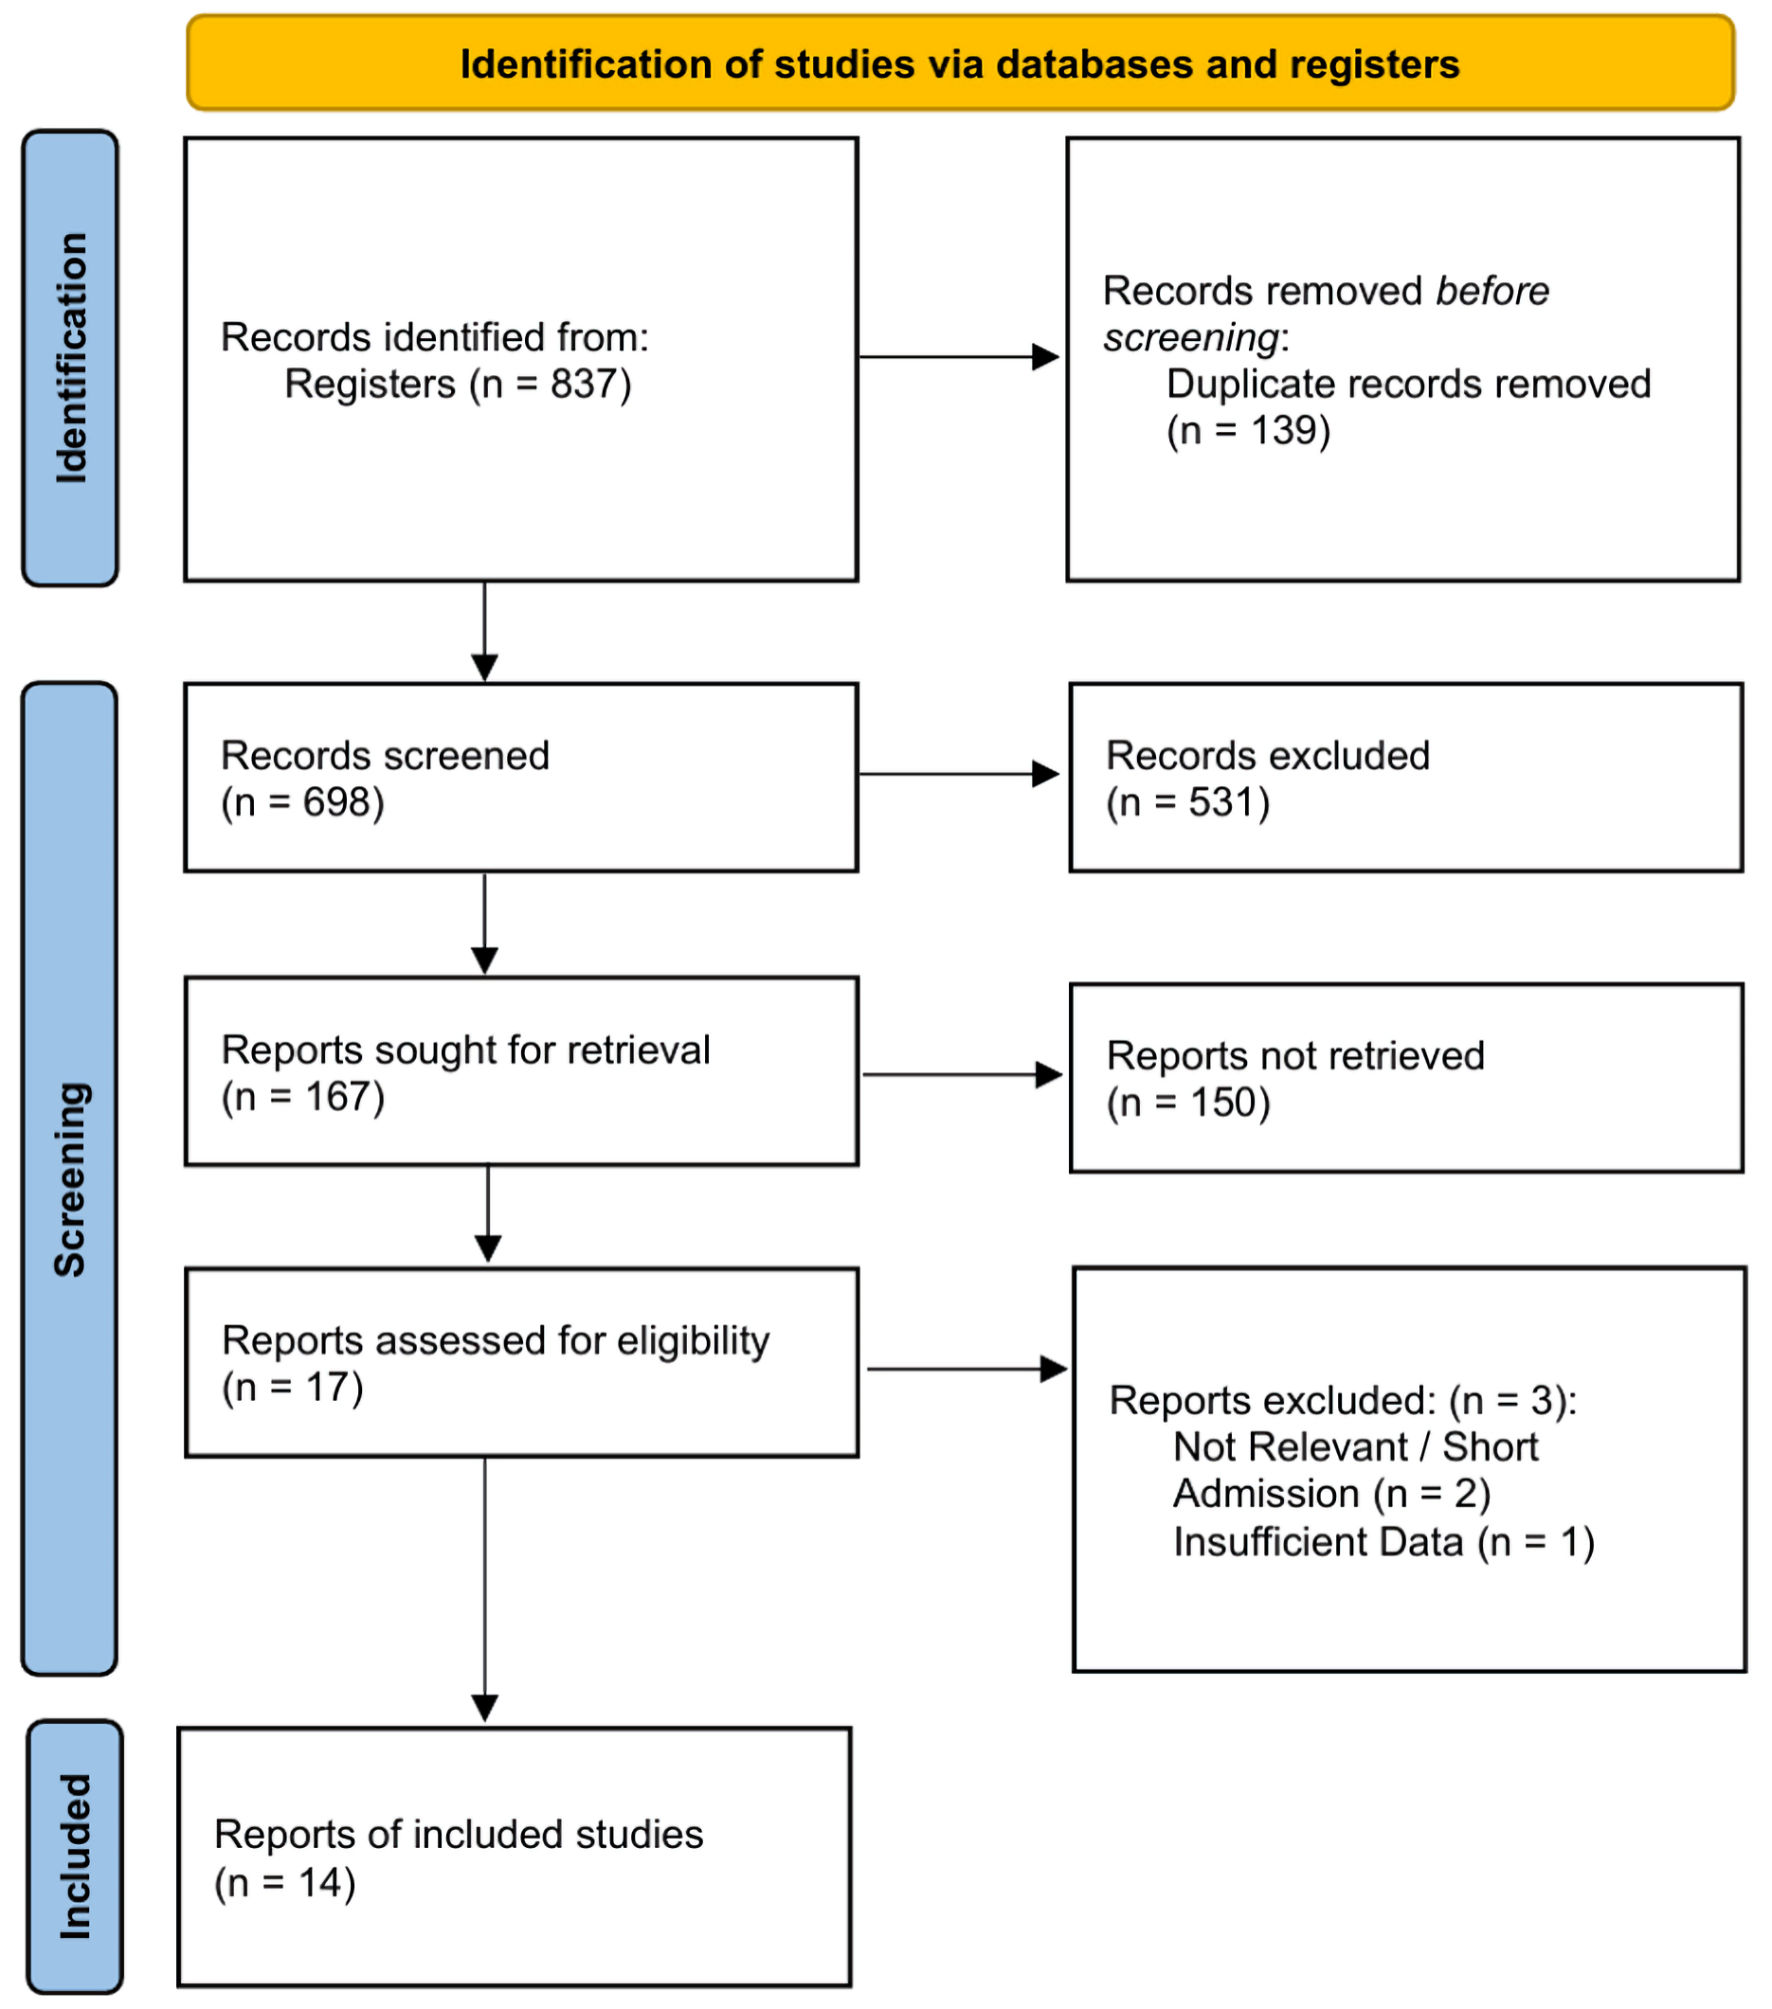
↓ Figure 1. PRISMA 2020 flow diagram illustrating the selection process of included studies. PRISMA: Preferred Reporting Items for Systematic Reviews and Meta-Analyses.
| Journal of Clinical Medicine Research, ISSN 1918-3003 print, 1918-3011 online, Open Access |
| Article copyright, the authors; Journal compilation copyright, J Clin Med Res and Elmer Press Inc |
| Journal website https://jocmr.elmerjournals.com |
Original Article
Volume 18, Number 8, August 2026, pages 567-584
Comparative Effectiveness of Continuous Subcutaneous Insulin Infusion Versus Multiple Daily Injections on Glycemic Control in Pediatric Type 1 Diabetes: A Systematic Review, Meta-Analysis, and Trial Sequential Analysis
Figures
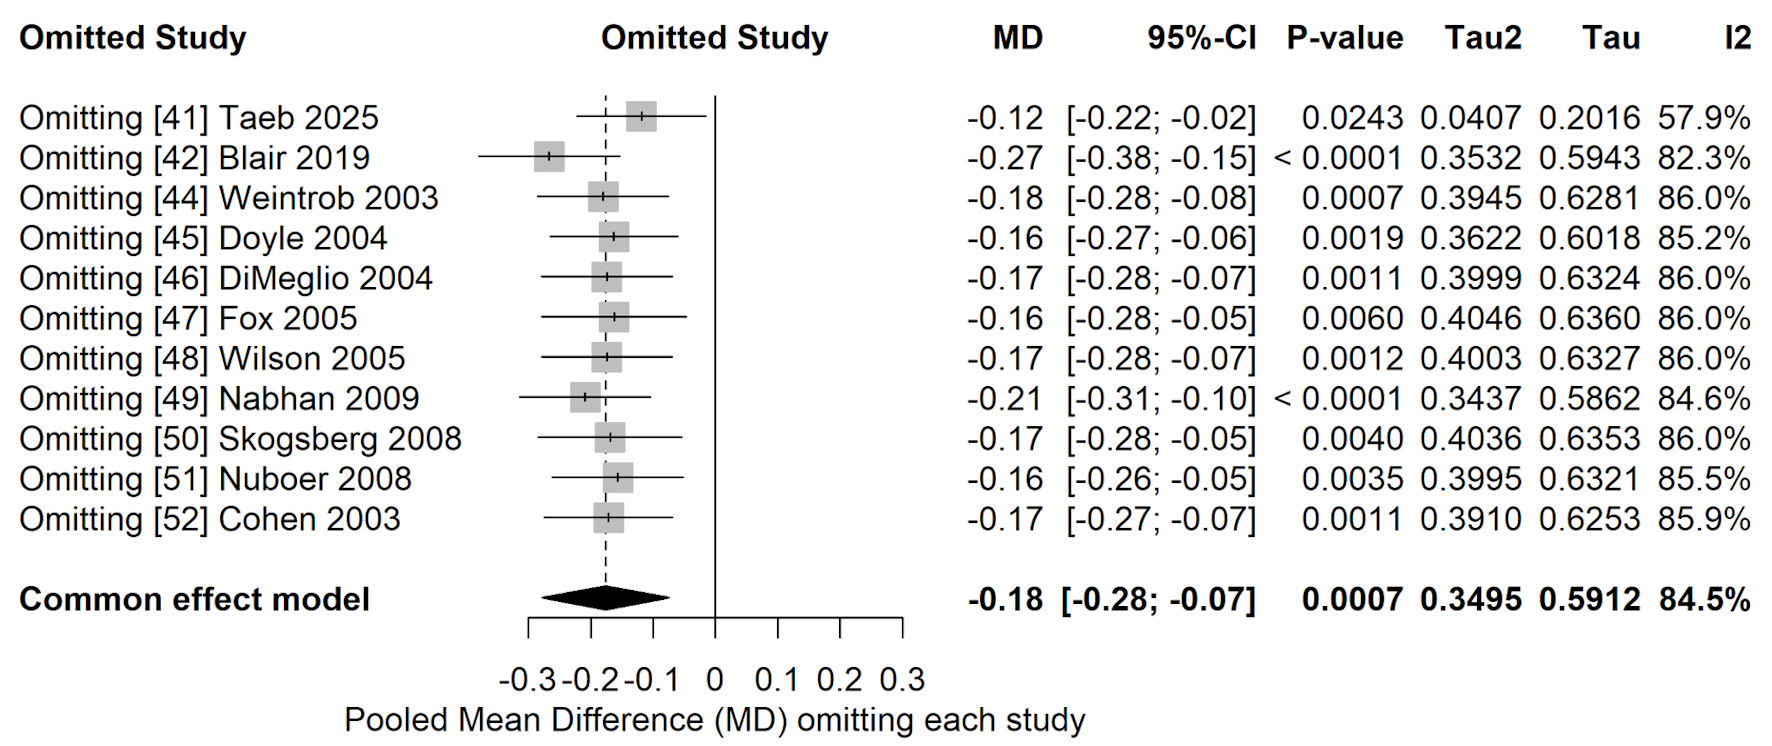
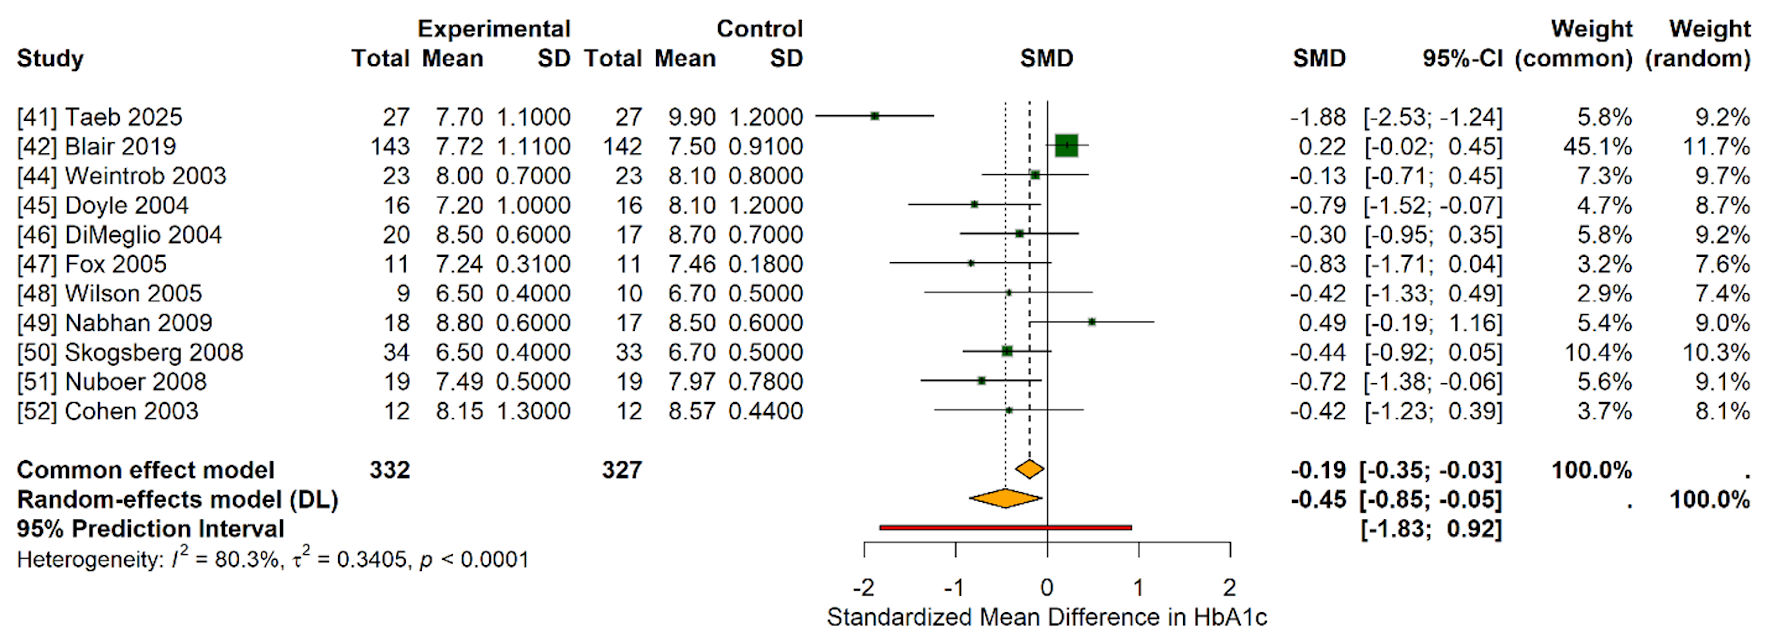
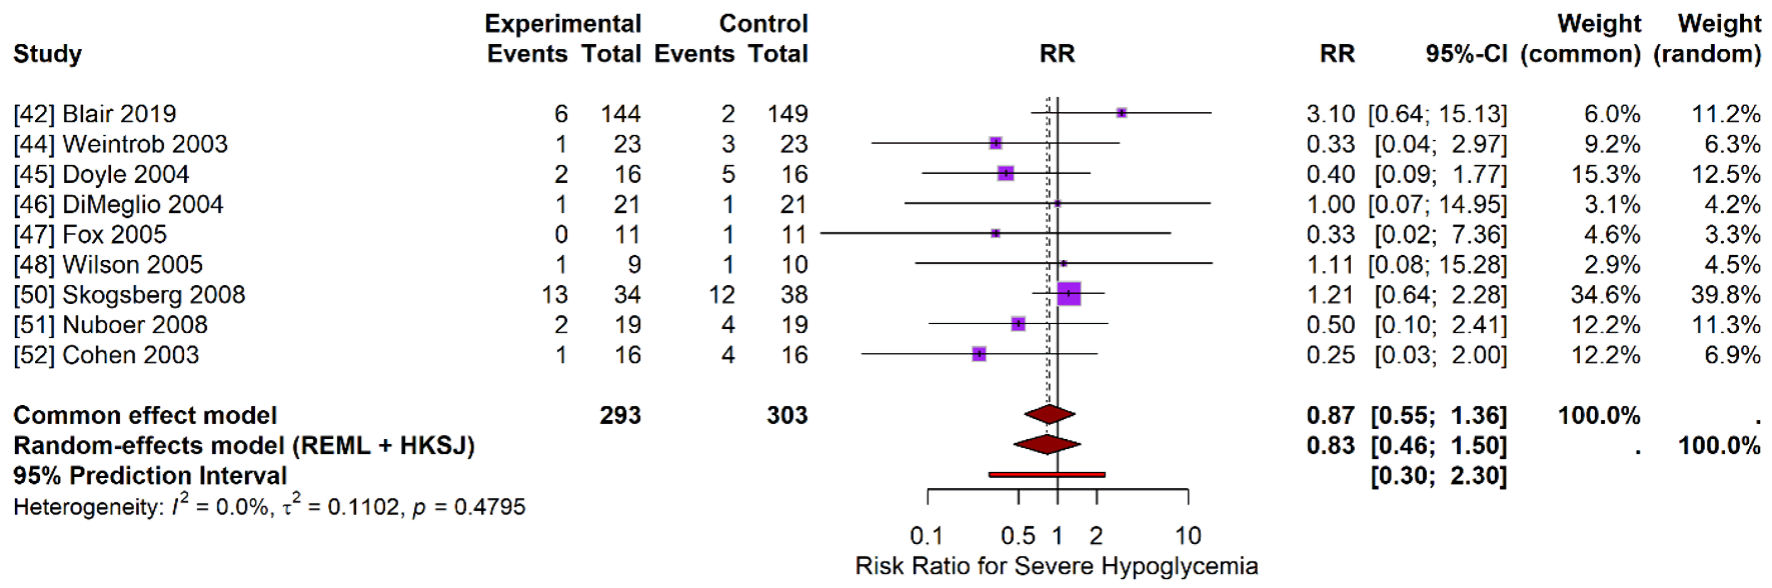
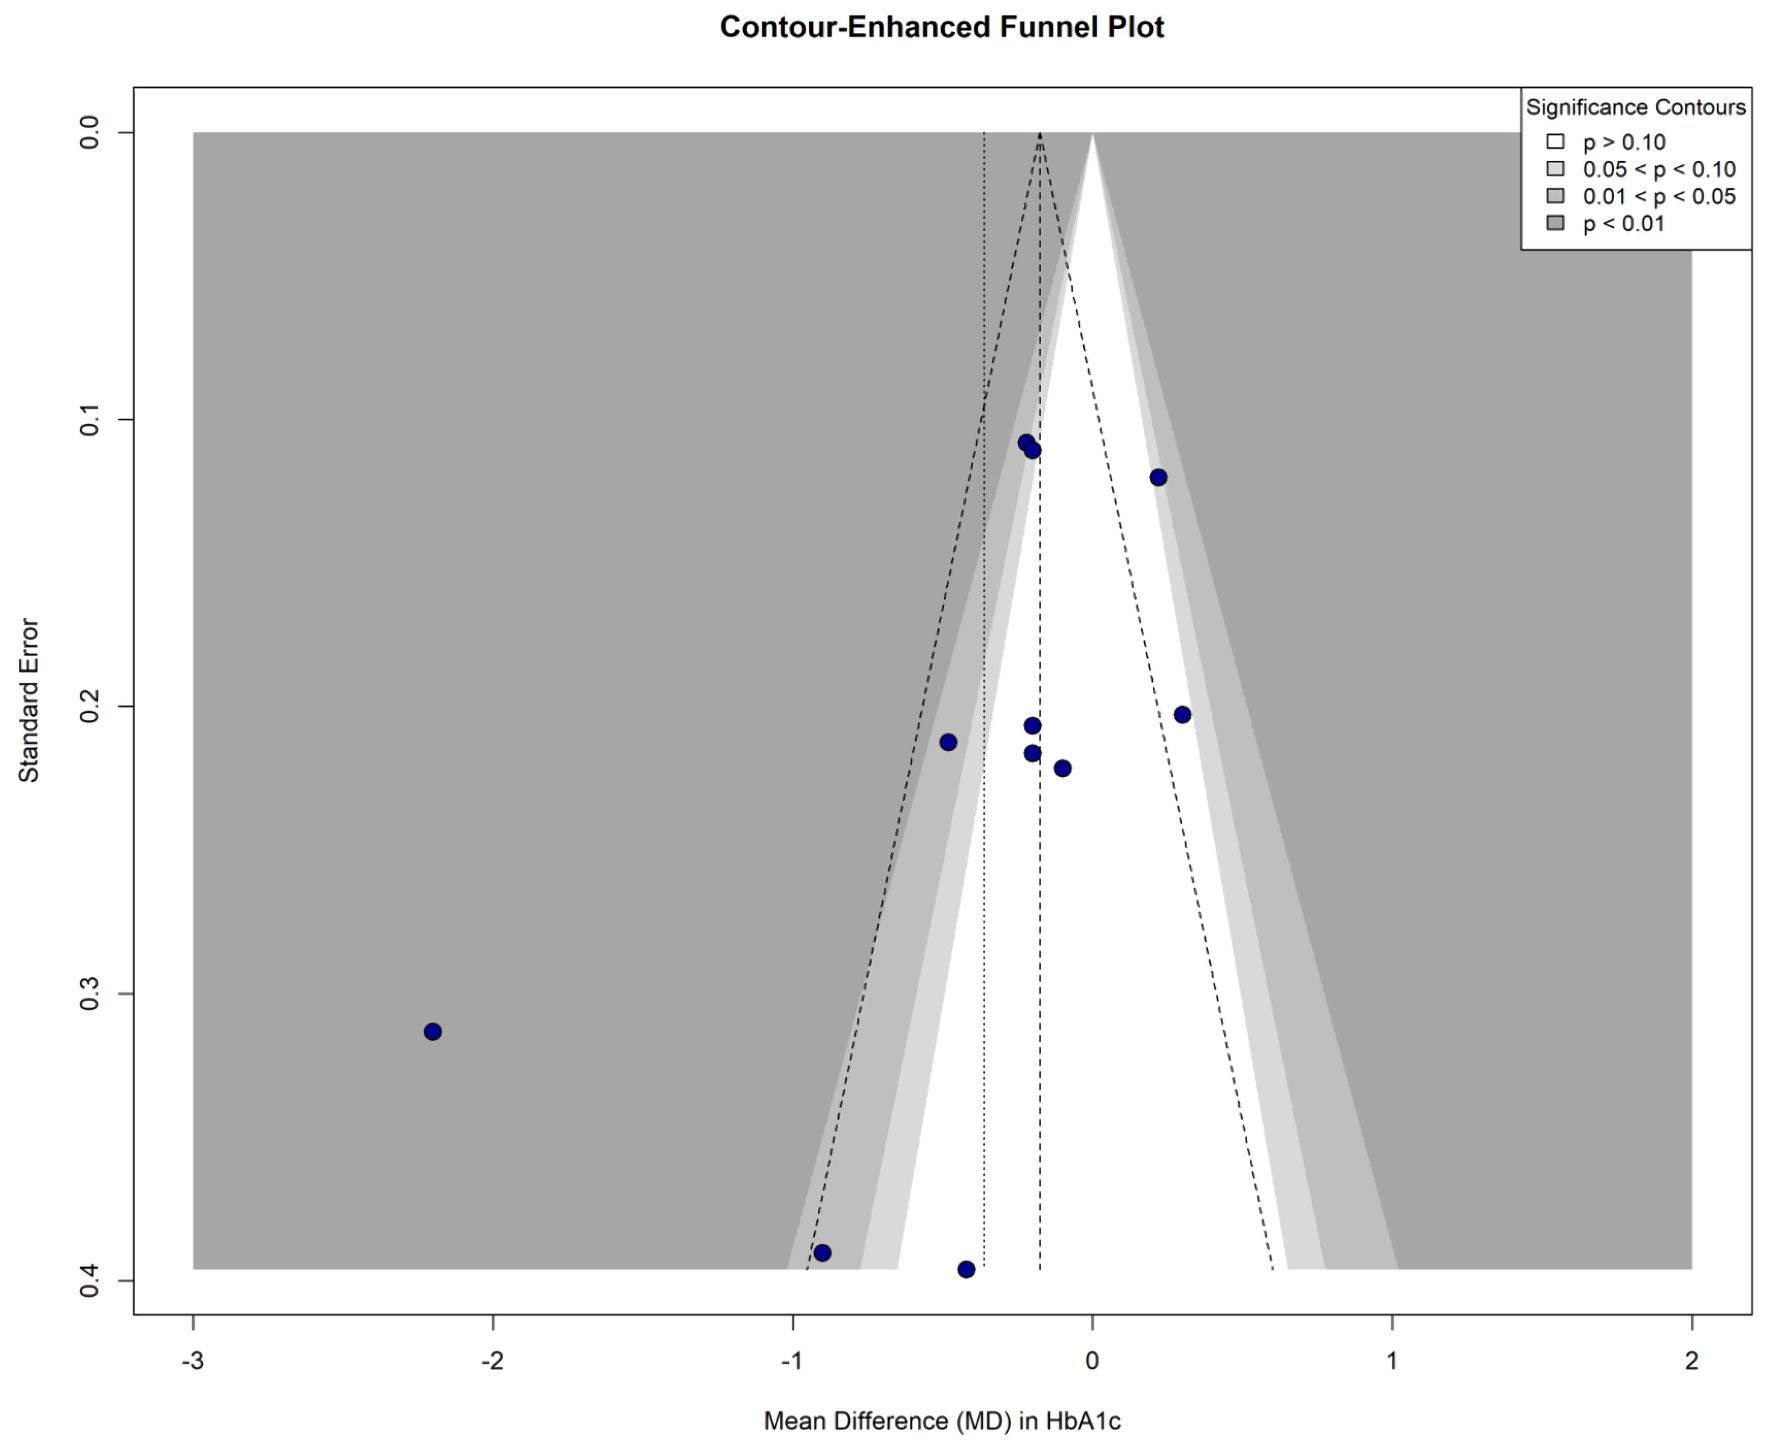
Tables
| Study (first author, year) | Country | Study design | Sample size (n) | Age (mean/range) | Diabetes duration | Intervention (CSII) | Control (MDI) | Follow-up duration | Primary outcomes reported |
|---|---|---|---|---|---|---|---|---|---|
| aStudy design involved a crossover element but was analyzed as parallel groups for the first phase or as a combined cohort over time. BMI: body mass index; CGMS: continuous glucose monitoring system; CSII: continuous subcutaneous insulin infusion; DKA: diabetic ketoacidosis; HbA1c: glycated hemoglobin; MDI: multiple daily injections; NPH: neutral protamine Hagedorn; QoL: quality of life; RCT: randomized controlled trial; T1D: type 1 diabetes; TDD: total daily dose. | |||||||||
| Taeb et al, 2025 [41] | Libya | Parallel RCT | 54 (27 CSII, 27 MDI) | 9.2 years (MDI), 8.9 years (CSII) | Not reported | CSII pump | MDI | End of study | QoL, HbA1c |
| Blair et al, 2019 [42] | UK | Parallel RCT (pragmatic) | 293 (144 CSII, 149 MDI) | 7months–15 years | New onset | CSII (aspart) | MDI (glargine/detemir + aspart) | 12 months | HbA1c, severe hypoglycemia, DKA, QoL, cost |
| Weintrob et al, 2004 [43] | Israel | Crossover RCT | 23 | 8–14 years | 2.8–11.9 years | CSII (lispro) | MDI (NPH + regular) | 3.5 months/arm | Glycemic patterns (CGMS), HbA1c |
| Weintrob et al, 2003 [44] | Israel | Crossover RCT | 23 | 9.4–13.9 years | Mean 5.8 years | CSII (lispro) | MDI (NPH + regular) | 3.5 months/arm | HbA1c, adverse events, QoL |
| Doyle et al, 2004 [45] | USA | Parallel RCT | 32 (16 CSII, 16 MDI) | 8–21 years | Mean 6.8 years | CSII (aspart) | MDI (glargine + aspart) | 16 weeks | HbA1c, TDD, hypoglycemia |
| DiMeglio et al, 2004 [46] | USA | Parallel RCT | 42 (21 CSII, 21 MDI) | < 5 years | > 12 months | CSII (lispro) | MDI (NPH/Lente + lispro) | 6 months | HbA1c, hypoglycemia, parenting stress |
| Fox et al, 2005 [47] | USA | Parallel RCT | 26 (13 CSII, 13 MDI) | 1–6 years | > 6 months | CSII (lispro) | MDI (NPH + rapid analog) | 6 months | HbA1c, hypoglycemia, QoL |
| Wilson et al, 2005 [48] | USA | Parallel RCT | 19 (9 CSII, 10 MDI) | 1.7–6.1 years | Mean 1.4 years | CSII | MDI | 12 months | HbA1c, severe hypoglycemia, DKA, QoL |
| Nabhan et al, 2009 [49] | USA | Crossover/parallela | 35 (18 CSII first, 17 MDI first) | < 5 years | Mean 1.6 years | CSII | MDI | 12 months | HbA1c, BMI, neurocognitive |
| Skogsberg et al, 2008 [50] | Sweden | Parallel RCT | 72 (34 CSII, 38 MDI) | 7–17 years | New onset | CSII (aspart) | MDI (NPH + aspart) | 24 months | HbA1c, hypoglycemia, DKA, satisfaction |
| Nuboer et al, 2008 [51] | Netherlands | Parallel RCT | 38 (19 CSII, 19 MDI) | 6–12 years | > 1 year | CSII (aspart) | MDI (NPH/glargine + aspart/regular) | 3.5 months (randomized phase) | QoL, impact of disease, HbA1c |
| Cohen et al, 2003 [52] | Israel | Crossover RCT | 16 | 14.5–17.9 years | > 2 years | CSII (lispro) | MDI (NPH + regular) | 6 months/arm | HbA1c, adverse events, QoL |
| Mueller-Godeffroy et al, 2018 [53] | Germany | Parallel RCT | 211 (106 CSII, 105 MDI) | 6–16 years | > 6 months | CSII | MDI | 6 months | QoL, diabetes burden, HbA1c |
| de Beaufort et al, 1989 [54] | Netherlands | Parallel RCT | 30 (15 CSII, 15 MDI) | Mean 9.5 years (CSII), 7.0 yrs (MDI) | New onset | CSII | MDI (1–2 injections/day) | 24 months | HbA1c, C-peptide |
| Outcome | No. of participants (studies) | Risk of bias | Inconsistency | Indirectness | Imprecision | Publication bias | Effect estimate (95% CI) | Certainty of evidence (GRADE) | Importance |
|---|---|---|---|---|---|---|---|---|---|
| aRisk of bias: downgraded one level due to lack of blinding (inherent to intervention) across most studies and “some concerns” in randomization/allocation concealment in older trials. bInconsistency: downgraded one level due to high statistical heterogeneity (= 84.5%) that was not fully explained by the subgroup analysis. cImprecision: downgraded one level due to wide confidence intervals crossing the line of no effect (1.0 for RR, 0 for MD) or small sample sizes. dImprecision (very serious): downgraded two levels because of very few events (rare outcome), resulting in extremely wide confidence intervals and fragility of the estimate. eInconsistency: downgraded one level due to variability in measurement tools (PedsQL, DQOLY, etc.) and conflicting direction of effect across studies. GRADE: Grades of Recommendations Assessment, Development, and Evaluation; HbA1c: glycated hemoglobin; MD: mean difference; RCT: randomized controlled trial; RR: risk ratio. | |||||||||
| Glycemic control (HbA1c) | 659 (11 RCTs) | Serious (–1)a | Serious (–1)b | Not serious | Not serious | Not detected | MD –0.36% (–0.80 to 0.08) | ⊕⊕◯◯ | Critical |
| Low | |||||||||
| Severe hypoglycemia | 596 (9 RCTs) | Serious (–1)a | Not serious | Not serious | Serious (–1)c | Not detected | RR 0.83 (0.46 to 1.50) | ⊕⊕◯◯ | Critical |
| Low | |||||||||
| Diabetic ketoacidosis (DKA) | 597 (6 RCTs) | Serious (–1)a | Not serious | Not serious | Very serious (–2)d | Not detected | RR 1.40 (0.61 to 3.21) | ⊕◯◯◯ | Critical |
| Very low | |||||||||
| Quality of life (QoL) | 180 (2 RCTs) | Serious (–1)a | Serious (–1)e | Not serious | Serious (–1)c | Not detected | Narrative synthesis (mixed) | ⊕◯◯◯ | Important |
| Very low | |||||||||