Journal of Clinical Medicine Research, ISSN 1918-3003 print, 1918-3011 online, Open Access
Article copyright, the authors; Journal compilation copyright, J Clin Med Res and Elmer Press Inc
Journal website https://jocmr.elmerjournals.com

Original Article

Volume 18, Number 5, May 2026, pages 343-351


Spatial SRY-Box Transcription Factor 2 Expression and Stemness-Associated Markers Refine Risk Stratification in Barrett’s Esophagus: A Digital Pathology Study of 217 Patients

Figures

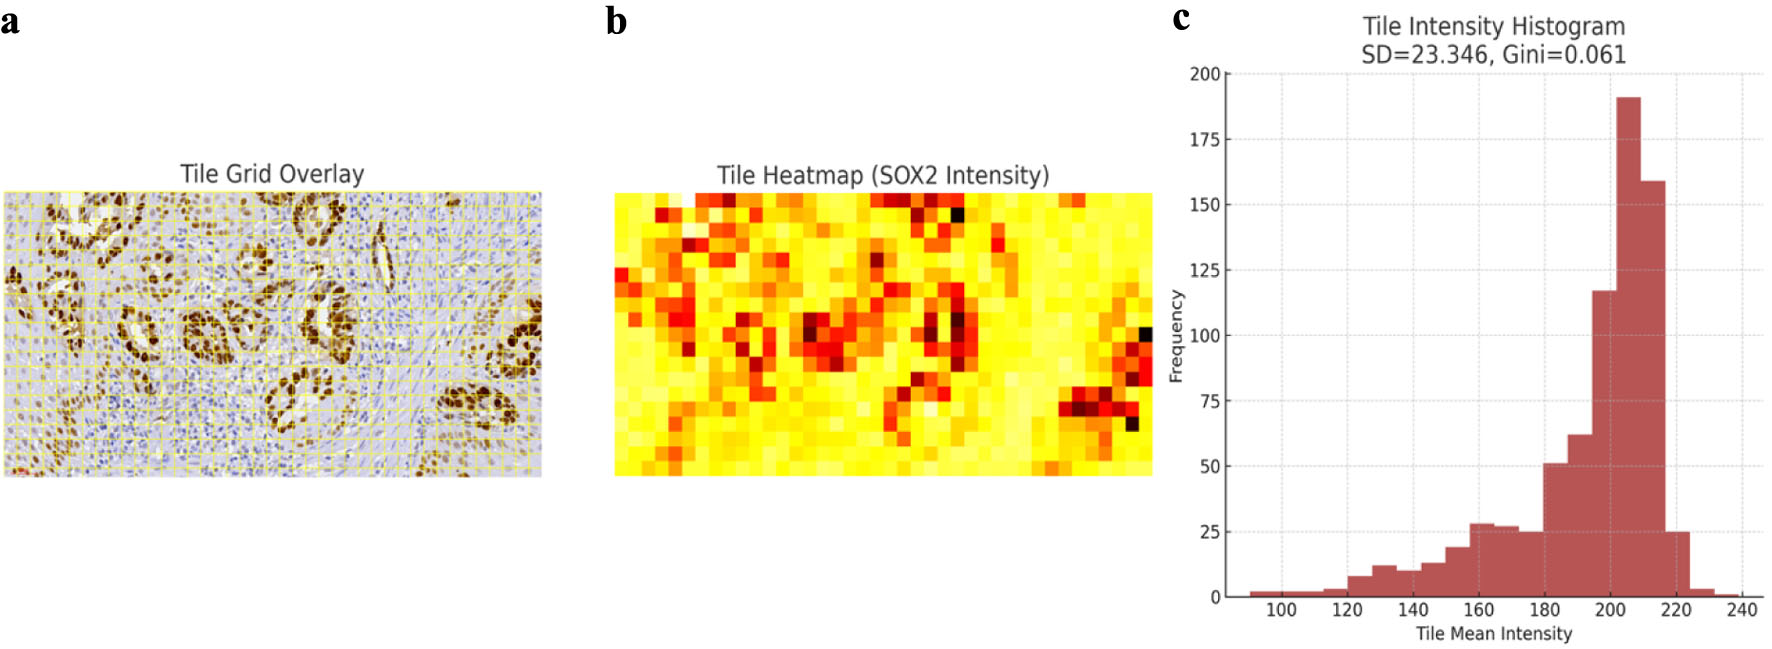
↓  Figure 1. Digital tile-based quantification of SOX2 spatial heterogeneity in early esophageal adenocarcinoma. (a) Representative SOX2-immunostained carcinoma field demonstrating the tile grid overlay used for digital segmentation. Each tile corresponds to a fixed-size analytical unit from which pixel-level optical density measurements were extracted. (b) Heatmap of tile mean SOX2 intensity values, illustrating marked regional variability in nuclear expression across the tumor field. High-intensity tiles (red–orange) correspond to clusters of SOX2-overexpressing glands, whereas low-intensity tiles (light yellow) represent areas with reduced transcriptional activity. (c) Histogram of tile intensities with calculated standard deviation (SD) and Gini coefficient. SD reflects overall variability, while the Gini index quantifies inequality of SOX2 distribution, capturing clonal and spatial heterogeneity within the neoplastic epithelium. These metrics formed the basis of the SOX2_Tile_SD and SOX2_Tile_Gini variables used in downstream analyses. SOX2: SRY-box transcription factor 2.
Figure 1.
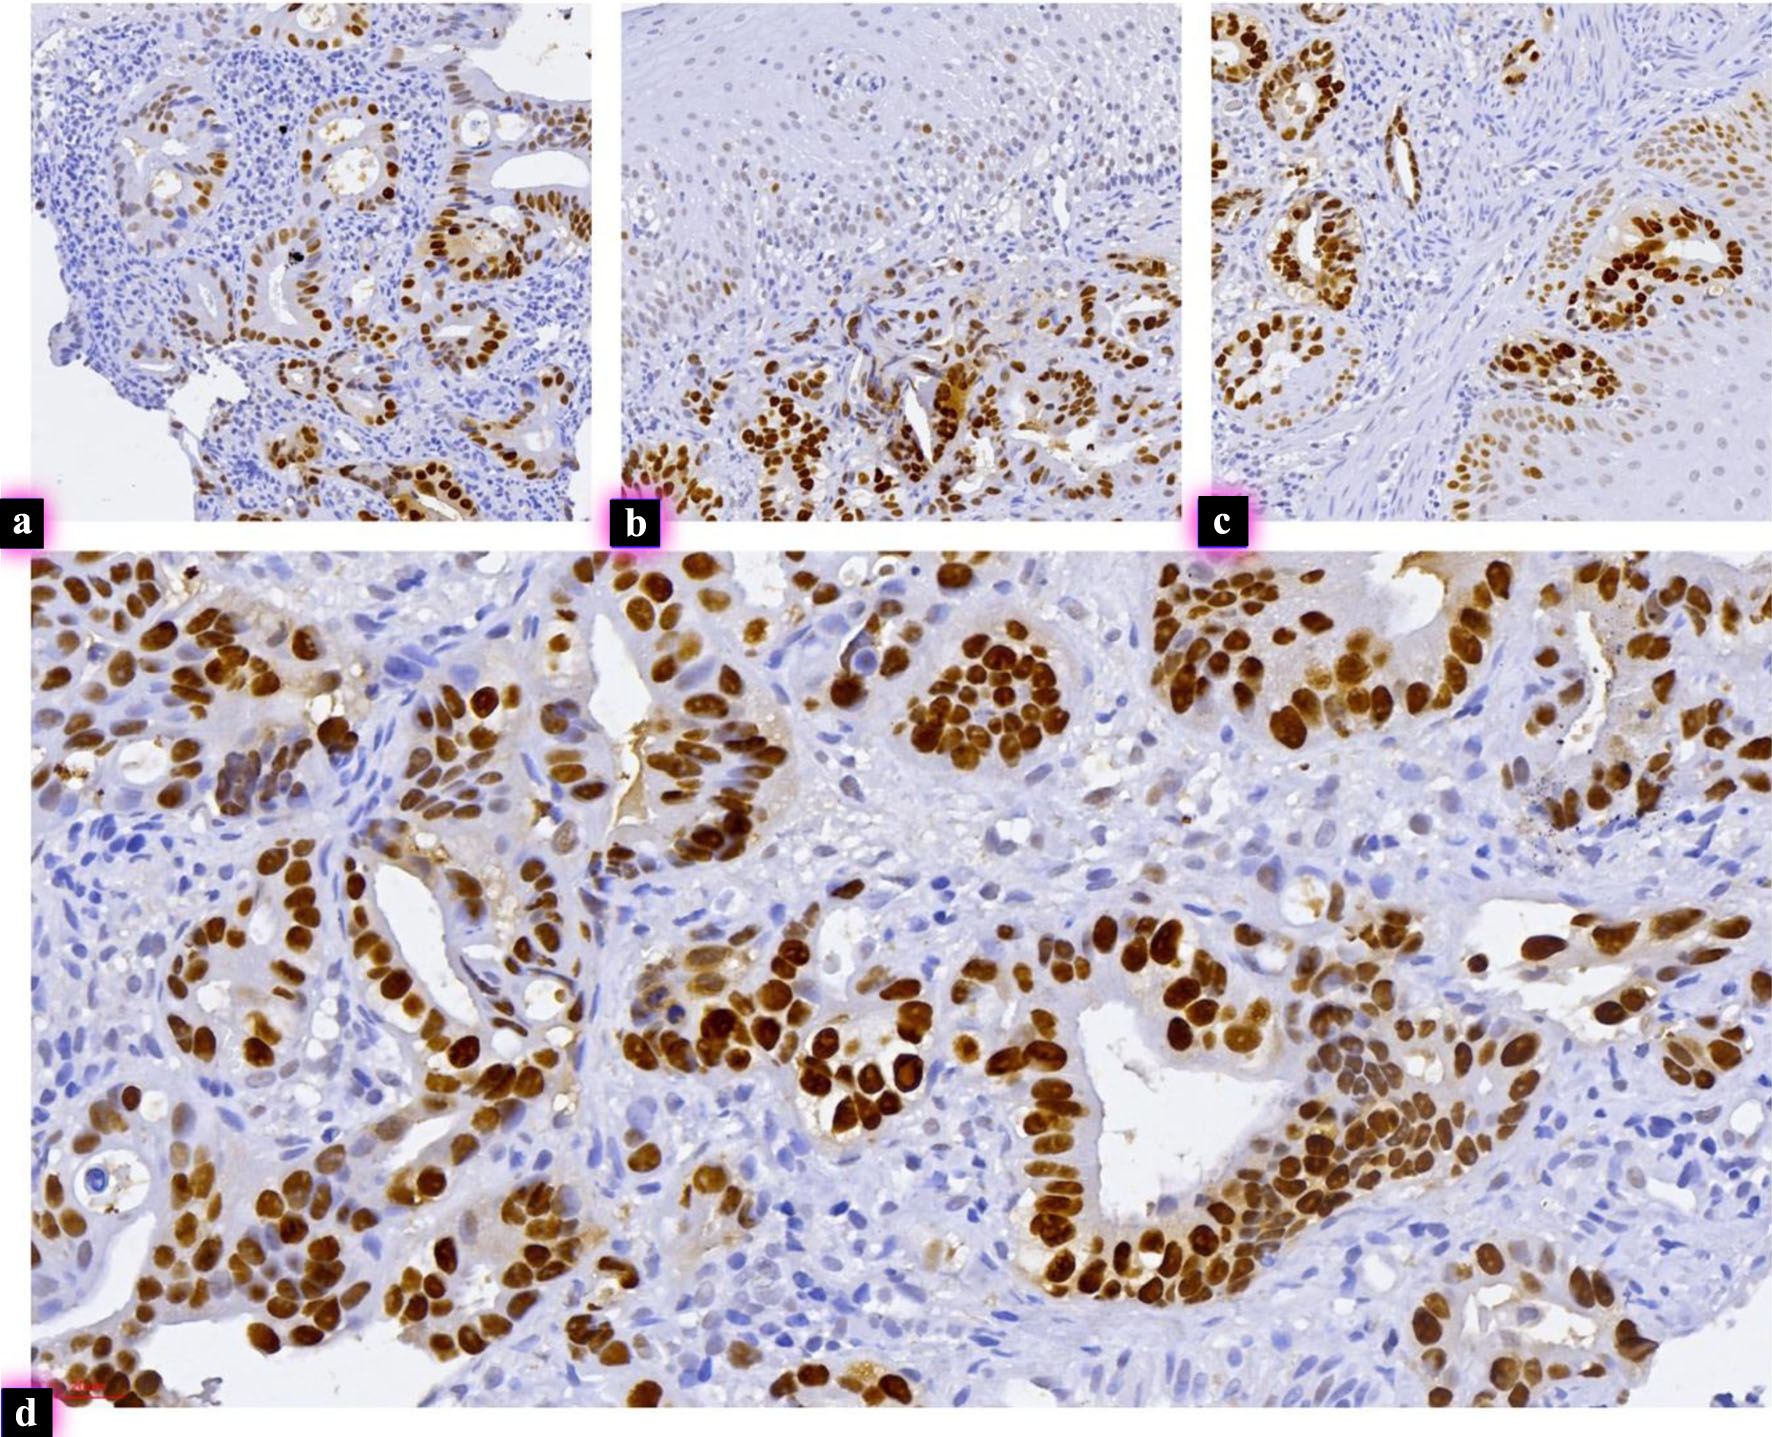
↓  Figure 2. Aberrant SOX2 expression across Barrett’s dysplasia and early adenocarcinoma. (a) High-grade Barrett’s dysplasia exhibiting strong, aberrant nuclear SOX2 expression within dysplastic glandular structures, representing a high-risk molecular phenotype (IHC, × 290). (b) Another case of high-grade Barrett’s dysplasia showing intense nuclear SOX2 positivity diffusely involving crowded and architecturally complex glands, consistent with marked lineage deregulation (IHC, × 300). (c) Low-grade Barrett’s dysplasia with unexpectedly high SOX2 expression in glandular epithelium, indicating early activation of a high-risk transcriptional pathway despite only low-grade morphologic atypia (IHC, × 390). (d) Intramucosal adenocarcinoma displaying diffuse nuclear SOX2 overexpression in infiltrative malignant glands, consistent with advanced lineage reprogramming and a phenotype associated with progression (IHC, × 460). IHC: immunohistochemistry; SOX2: SRY-box transcription factor 2.
Figure 2.
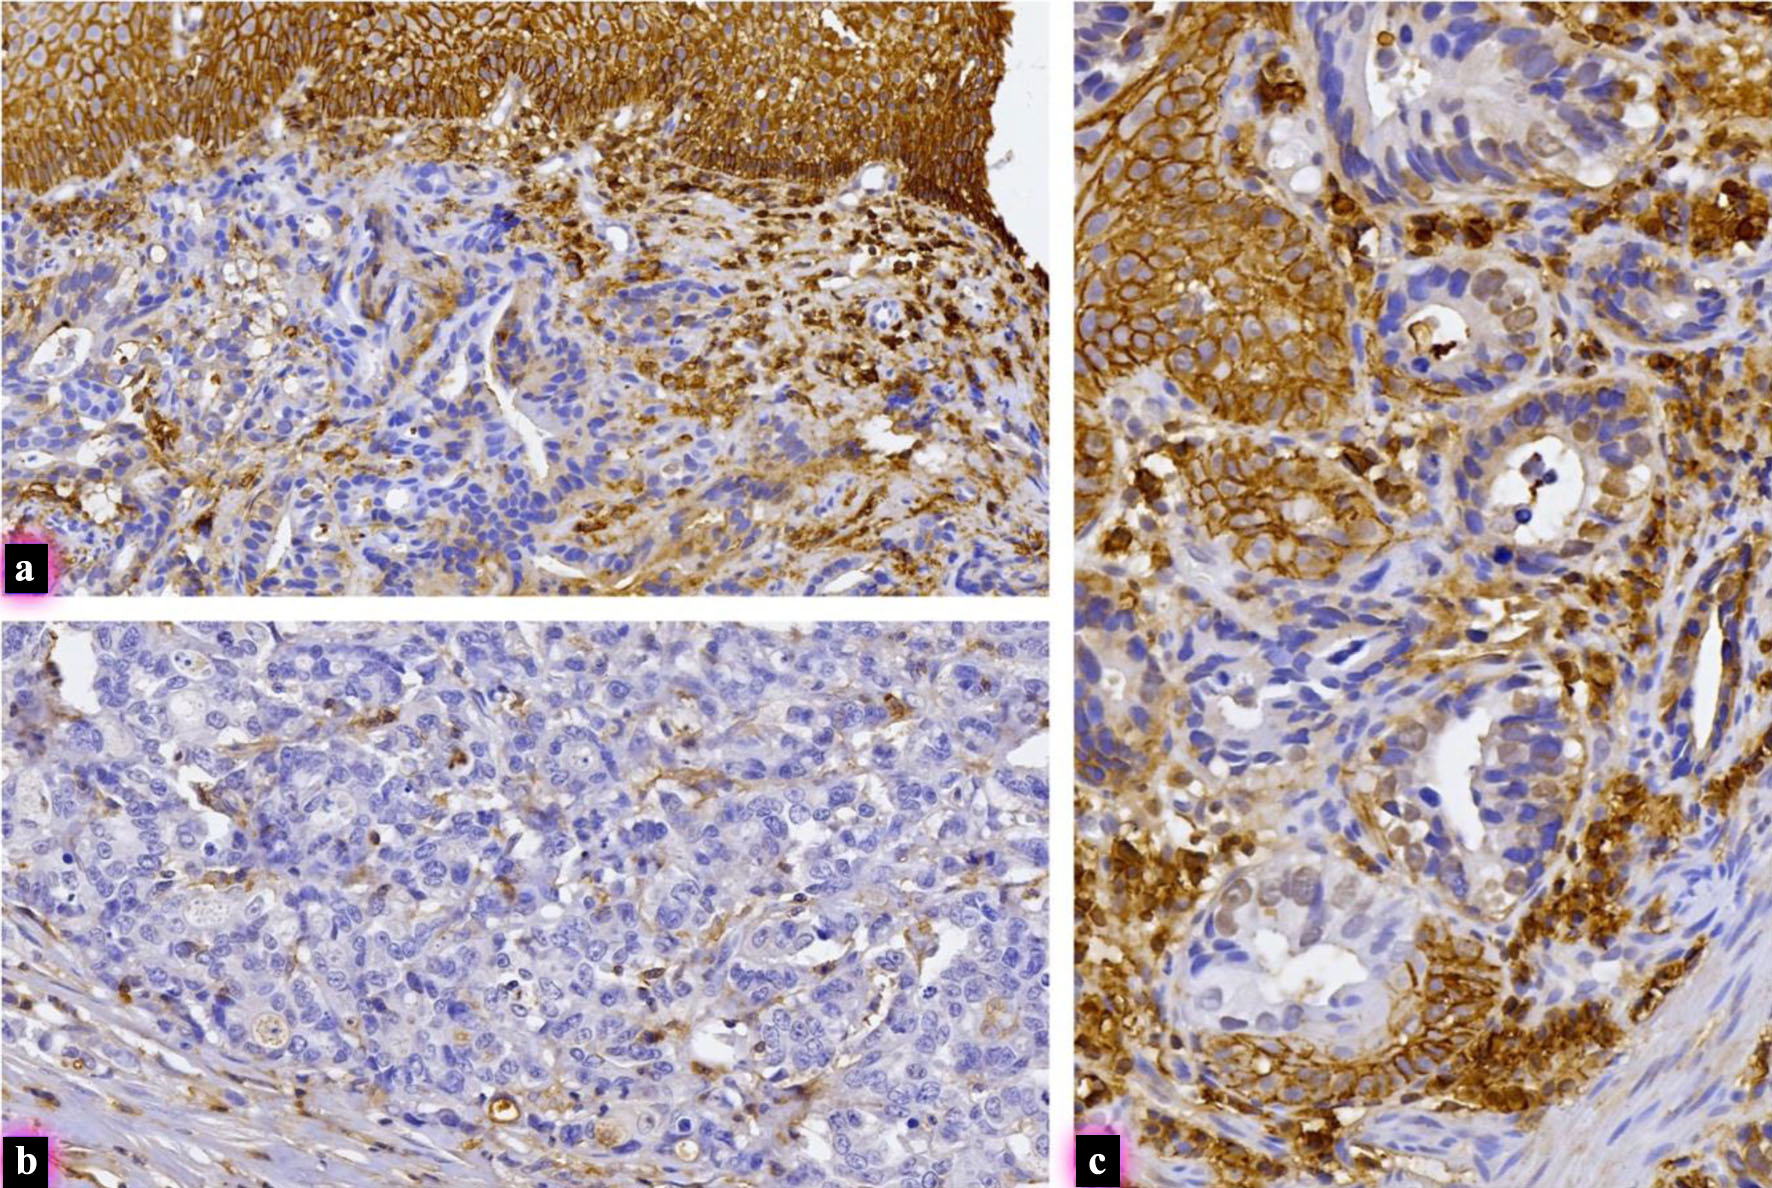
↓  Figure 3. Variable CD44 immunohistochemical expression in early intramucosal esophageal adenocarcinoma. (a) Carcinoma demonstrating partial membranous CD44 expression, with patchy staining in a subset of infiltrative malignant glands, indicating heterogeneous retention of a stem-cell–associated phenotype (IHC, × 270). (b) Carcinoma showing complete absence of CD44 immunoreactivity, with entirely negative malignant glands despite preserved internal controls, reflecting loss of CD44-mediated adhesion pathways (IHC, × 300). (c) Carcinoma with moderate membranous CD44 staining, involving a wider population of atypical glands and micropapillary clusters, suggesting expansion of CD44-positive tumor subclones (IHC, × 440). CD44: cluster of differentiation 44; IHC: immunohistochemistry.
Figure 3.

Tables

↓  Table 1. Primary Antibodies Used for Immunohistochemistry
 
MarkerCloneManufacturerCatalogue No.Dilution (Leica Bond)LocalizationPurpose
CD44: cluster of differentiation 44; CDX2: caudal-type homeobox transcription factor 2; Ki67: Ki-67 proliferation antigen; SOX2: SRY-box transcription factor 2.
SOX2SP76Leica/NovocastraNCL-L-SOX21:100NuclearSquamous lineage/stemness
CD44DF1485Leica/NovocastraNCL-CD44-21:200MembranousStemness/adhesion
E-cadherin (CDH1)36B5Leica/NovocastraNCL-L-E-CadReady-to-use or 1:50MembranousCell adhesion pattern
p53DO-7Leica/NovocastraNCL-L-p53-DO71:100NuclearTP53 mutation surrogate
Ki67MM1 (equivalent to MIB-1)Leica/NovocastraNCL-Ki67-MM11:100NuclearProliferation index
CDX2AMT28Leica/NovocastraNCL-CDX2-6031:100NuclearIntestinal differentiation
Helicobacter pyloriO2C2Leica/NovocastraNCL-HP1:50Cytoplasmic membraneH. pylori detection
Cytokeratin 7 (optional)OV-TL 12/30Leica/NovocastraNCL-L-CK7-5601:50CytoplasmicDifferential marker
Cytokeratin 20 (optional)Ks20.8Leica/NovocastraNCL-L-CK201:50CytoplasmicIntestinal phenotype


↓  Table 2. Baseline Clinical and Histologic Characteristics (n = 217)
 
VariableValue
BMI: body mass index; EAC: esophageal adenocarcinoma; HGD: high-grade dysplasia; IQR: interquartile range; LGD: low-grade dysplasia; NDBE: non-dysplastic Barrett’s esophagus; PPI: proton pump inhibitor; SD: standard deviation.
Age, years, median (IQR)58 (55–62)
Sex, n (%) male168 (77.4)
BMI, kg/m2, mean ± SD28.0 ± 4.0
Smoking (never/former/current)68/74/75
Alcohol (none/moderate/heavy)Approx. half moderate or heavy
PPI use, n (%)112 (51.6)
Hiatal hernia, n (%)28 (12.9)
Helicobacter pylori positive, n (%)112 (51.6)
Prague C, cm, median (IQR)4 (1–6)
Prague M, cm, median (IQR)4 (2–5.5)
Histology at index, n (%)Reflux 14 (6.5); NDBE 14 (6.5); LGD 91 (41.9); HGD 63 (29.0); EAC_T1a 35 (16.1)
Follow-up, months, median (IQR)9 (6–10)
Progression endpoint, n (%)119 (54.8)


↓  Table 3. Selected SOX2-Related and Stemness Markers by Histologic Category
 
HistologynSOX2_SCJ medianSOX2_Deep medianSOX2_Gradient medianSOX2_Tile_Gini medianSOX2_CD44_CoLocal median (%)CD44_HScore medianKi67_Index median (%)
CD44: cluster of differentiation 44; EAC: esophageal adenocarcinoma; HGD: high-grade dysplasia; Ki67: Ki-67 proliferation antigen; LGD: low-grade dysplasia; NDBE: non-dysplastic Barrett’s esophagus; SOX2: SRY-box transcription factor 2.
Reflux esophagitis1410090+100.1055015
NDBE1410580+250.0555020
LGD91150100+500.20308020
HGD6390200−1100.305010045
EAC_T1a3550200−1500.408018055


↓  Table 4. Univariable Logistic Regression for Progression Endpoint (HGD/EAC vs. No HGD/EAC)
 
PredictorScaleOR (95% CI)P value
CD44: cluster of differentiation 44; CI: confidence interval; EAC: esophageal adenocarcinoma; HGD: high-grade dysplasia; OR: odds ratio; SOX2: SRY-box transcription factor 2.
SOX2_Gradientper 10 units0.59 (0.49–0.71)3.0 × 10⁻⁸
CD44_HScoreper 10 units2.48 (1.87–3.28)2.1 × 10−10
SOX2_Tile_Giniper 0.19.71 (5.00–18.85)1.9 × 10⁻¹¹
Prague Mper 1 cm2.04 (1.67–2.49)2.4 × 10⁻¹²


↓  Table 5. Multivariable Logistic Regression Analysis for Progression Endpoint (Adjusted for Age, Sex, BMI, Smoking Status, and Prague M Length)
 
PredictorScaleAdjusted OR (95% CI)P value
BMI: body mass index; CD44: cluster of differentiation 44; CI: confidence interval; OR: odds ratio; SOX2: SRY-box transcription factor 2.
SOX2_Gradientper 10 units0.71 (0.58–0.86)0.001
CD44_HScoreper 10 units1.94 (1.42–2.65)< 0.001
SOX2_Tile_Giniper 0.16.84 (3.12–14.99)< 0.001
Prague Mper 1 cm1.71 (1.29–2.26)< 0.001