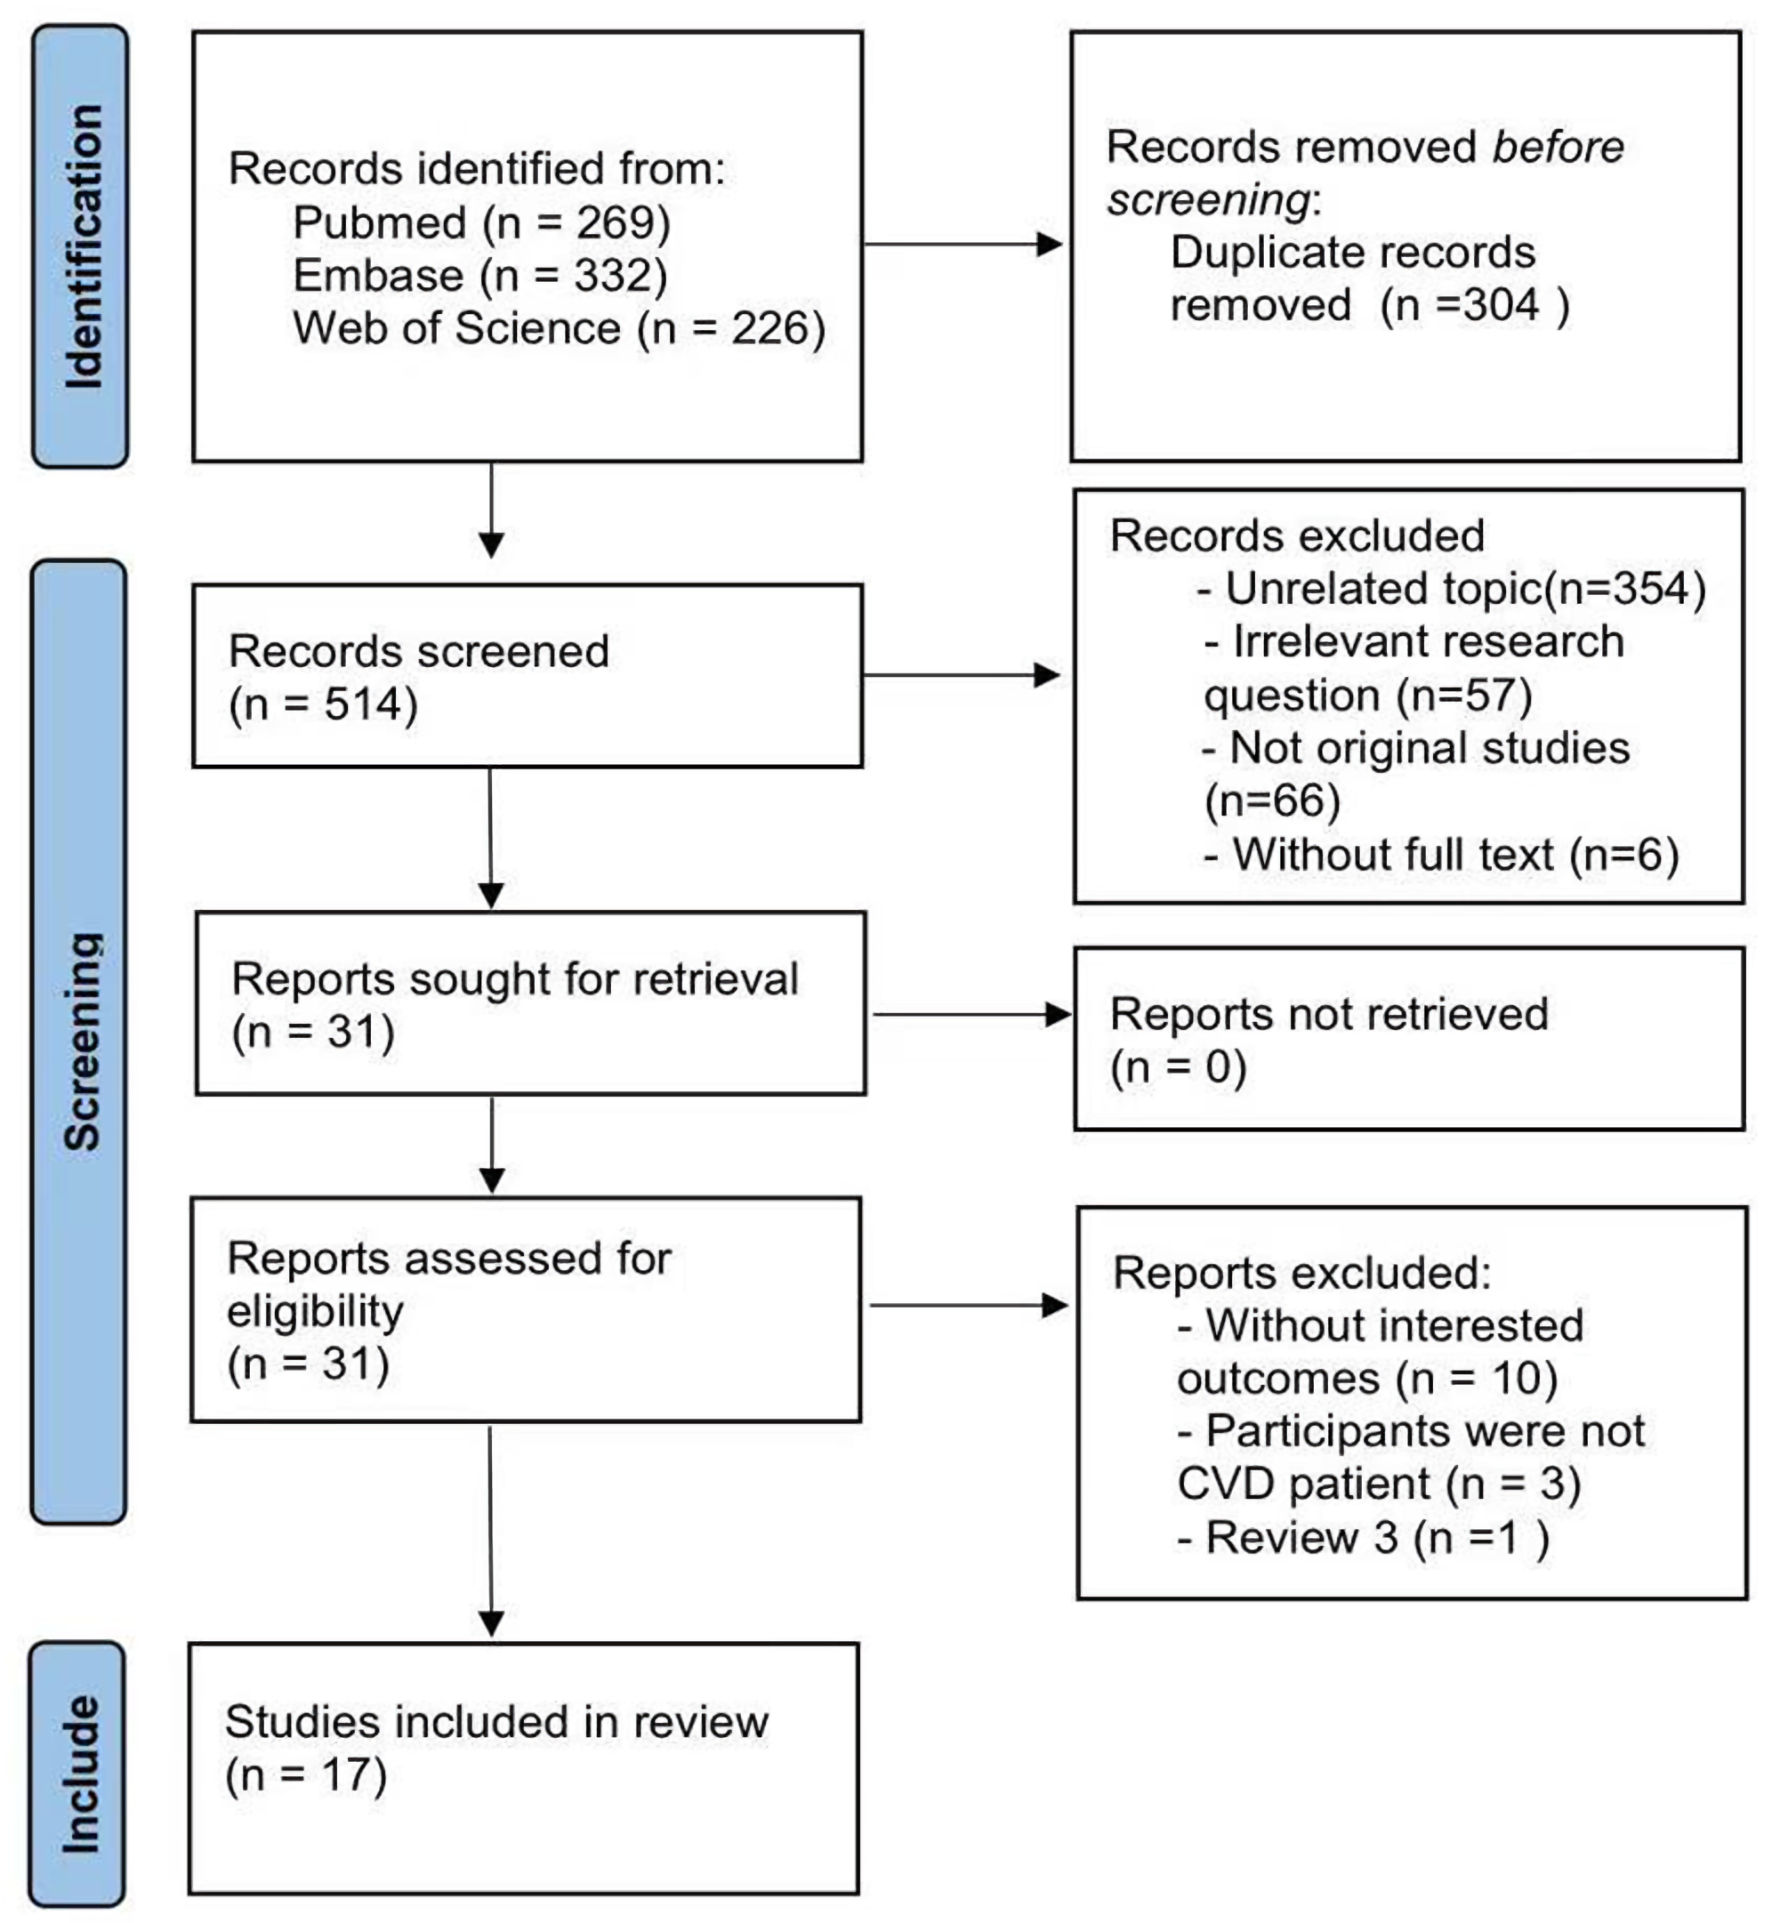
↓ Figure 1. Flowchart. CVD: cardiovascular disease.
| Journal of Clinical Medicine Research, ISSN 1918-3003 print, 1918-3011 online, Open Access |
| Article copyright, the authors; Journal compilation copyright, J Clin Med Res and Elmer Press Inc |
| Journal website https://jocmr.elmerjournals.com |
Original Article
Volume 18, Number 6, June 2026, pages 407-419
The Association Between Triglyceride-Glucose Index and Mortality Risk in Cardiovascular Disease Patients: A Meta-Analysis
Figures
Tables
| Study | Country | Design | Patients | Acute, % | Cut-off for TyG | N, M/F | Age, years | BMI, kg/m2 | T2DM, % | Follow-up, years |
|---|---|---|---|---|---|---|---|---|---|---|
| aData are expressed as median (interquartile range). ACS: acute coronary syndrome; AHF: acute heart failure; AMI: acute myocardial infarction; BMI: body mass index; CHD: coronary heart disease; CHF: chronic heart failure; HF: heart failure; iHF: ischemic heart failure; M/F: male/female; NR: not reported; NSTE-ACS: non-ST-segment elevation acute coronary syndrome; PCS: prospective cohort study; RCS: retrospective cohort study; ROC: receiver operating characteristic; T2DM: type 2 diabetes mellitus; TyG: triglyceride-glucose index. | ||||||||||
| Guo et al, 2021 [19] | China | RCS | CHF | 0 | Tertiles | 546, 362/184 | 65.18 (12.01) | 21.07 (1.83) | 100 | 1, median |
| Hao et al, 2024 [13] | China | PCS | CHD | 74.6 | Quintile | 3,321, 2,404/917 | 61.7 ± 11.7 | 25.6 ± 3.5 | 32.4 | 9.79, median |
| Hao et al, 2023 [14] | China | RCS | AMI | 100 | Tertiles | 1,144, 902/242 | 62.1 ± 12.8 | 24.8 ± 3.3 | 18.9 | 1 |
| Huang et al, 2022 [20] | China | RCS | AHF | 100 | Tertiles | 932, 579/353 | 70 (61, 80)a | 24.2 (21.6, 27.1)a | 32.8 | 1.31 |
| Jiao et al, 2022 [21] | China | PCS | ACS | 100 | Tertiles | 662, 476/186 | 81.87 ± 2.14 | 24.57 ± 3.40 | 34.9 | ≤ 10 |
| Mao et al, 2019 [8] | China | RCS | NSTE-ACS | 100 | Median | 438, 295/143 | 62.5 (53.0, 68.0)a | 24 33 ± 3 17 | 32.6 | 1 |
| Ozcan et al, 2023 [22] | Turkey | RCS | HF | NR | Tertiles | 773, 633/140 | 63 (53, 72)a | NR | 35.6 | 3.17 |
| Shen et al, 2023 [23] | China | PCS | ACS | 100 | Tertiles | 231, 156/75 | 81.58 ± 1.93 | 24.78 ± 3.42 | 100 | 4.08 |
| Sun et al, 2023 [24] | China | RCS | iHF | 0 | Quartiles | 2,055, 1,690/365 | 60.3 ± 11.0 | 25.9 ± 3.2 | 38.5 | 3 |
| Wang et al, 2020 [25] | China | RCS | ACS | 100 | Tertiles | 2,531, 1,415/1,116 | 66.3 ± 6.8 | 25.9 ± 2.7 | 100 | 3 |
| Xie et al, 2023 [26] | China | RCS | CHD | 59.2 | Tertiles | 1,061, 789/272 | 61.8 ± 10.5 | NR | 52.7 | 1.83 |
| Zhang et al, 2021 [9] | China | RCS | AMI | 100 | Tertiles | 1,932, 1,324/608 | 65.4 ± 12.0 | 25.8 ± 3.5 | 100 | 2.23 |
| Zhang et al, 2022 [27] | China | RCS | ACS | 100 | Median | 1,010, 735/275 | 65.8 ± 10.1 | 25.6 ± 3.4 | 0 | 2.97 |
| Zhao et al, 2020 [28] | China | RCS | NSTE-ACS | 100 | ROC | 798, 545/253 | 60.9 ± 8.3 | 26.7 ± 3.2 | 100 | 3 |
| Zhao, et al, 2021 [10] | China | RCS | NSTE-ACS | 100 | Median | 1,510, 1,113/397 | 59.7 ± 9.3 | 25.8 ± 3.1 | 0 | 4 |
| Zhou et al, 2023 [11] | China | RCS | AHF | 100 | Tertiles | 823, 396/427 | 73.0 ± 12.7 | 25.5 ± 4.7 | 42 | 3.16 |
| Zhou et al, 2023 [29] | China | RCS | CHF | 0 | Tertiles | 6,697, 4,579/2,118 | 63.3 ± 14.2 | 25.2 (22.8, 27.8)a | 44.6 | 3.9 |
| Study | Representativeness of the exposed cohort | Selection of the unexposed cohort | Ascertainment of exposure | Outcome of interest not present at start of study | Control for important factor or additional factor | Outcome assessment | Follow-up long enough for outcomes to occur | Adequacy of follow-up of cohorts | Total quality scores |
|---|---|---|---|---|---|---|---|---|---|
| Quality assessment was performed using the Newcastle-Ottawa Quality Assessment Scale (NOS) for cohort studies. One star (☆) indicates that one star was awarded for meeting the quality criteria for the specific item. Two stars (☆☆) indicate two stars were awarded (typically for adequate control of both the primary and additional confounding factors). Em dash (—) indicates that the study did not meet the criterion for that item and received no star. | |||||||||
| Guo et al, 2021 [19] | ☆ | ☆ | ☆ | — | — | ☆ | — | ☆ | 5 |
| Hao et al, 2024 [13] | ☆ | ☆ | ☆ | — | ☆☆ | ☆ | ☆ | ☆ | 8 |
| Hao et al, 2023 [14] | ☆ | ☆ | ☆ | ☆ | ☆☆ | ☆ | — | ☆ | 8 |
| Huang et al, 2022 [20] | ☆ | ☆ | ☆ | — | ☆☆ | ☆ | — | ☆ | 7 |
| Jiao et al, 2022 [21] | ☆ | ☆ | ☆ | ☆ | ☆☆ | ☆ | — | ☆ | 8 |
| Mao et al, 2019 [8] | ☆ | ☆ | ☆ | — | ☆☆ | ☆ | — | ☆ | 7 |
| Ozcan et al, 2023 [22] | ☆ | ☆ | ☆ | — | ☆☆ | ☆ | — | ☆ | 7 |
| Shen et al, 2023 [23] | ☆ | ☆ | ☆ | ☆ | ☆☆ | ☆ | — | ☆ | 8 |
| Sun et al, 2023 [24] | ☆ | ☆ | ☆ | — | ☆☆ | ☆ | — | ☆ | 7 |
| Wang et al, 2020 [25] | ☆ | ☆ | ☆ | — | ☆☆ | ☆ | — | ☆ | 7 |
| Xie et al, 2023 [26] | ☆ | ☆ | ☆ | — | ☆☆ | ☆ | — | ☆ | 7 |
| Zhang et al, 2021 [9] | ☆ | ☆ | ☆ | — | ☆☆ | ☆ | — | ☆ | 7 |
| Zhang et al, 2022 [27] | ☆ | ☆ | ☆ | — | ☆☆ | ☆ | — | ☆ | 7 |
| Zhao et al, 2020 [28] | ☆ | ☆ | ☆ | — | ☆☆ | ☆ | — | ☆ | 7 |
| Zhao et al, 2021 [10] | ☆ | ☆ | ☆ | — | ☆☆ | ☆ | — | ☆ | 7 |
| Zhou et al, 2023 [11] | ☆ | ☆ | ☆ | — | ☆☆ | ☆ | — | ☆ | 7 |
| Zhou et al, 2023 [29] | ☆ | ☆ | ☆ | — | ☆☆ | ☆ | — | ☆ | 7 |
| Effect size | Coefficient | Standard error | t | P>|t|a | 95% confidence interval |
|---|---|---|---|---|---|
| aThe two-tailed P value evaluating the statistical significance of each covariate. TyG: triglyceride-glucose; ACS: Acute coronary syndrome. | |||||
| Country | 0.6861984 | 0.381515 | 1.80 | 0.110 | −0.1935768 to 1.565974 |
| With ACS | 0.0349545 | 0.0891832 | 0.39 | 0.705 | −0.1707022 to 0.2406113 |
| Cut-off for TyG | –0.0165432 | 0.1436475 | −0.12 | 0.911 | −0.3477949 to 0.3147084 |
| With diabetes | –0.4669322 | 0.3607914 | −1.29 | 0.232 | −1.298919 to 0.3650543 |
| Follow-up | –0.12924 | 0.1357905 | −0.95 | 0.369 | −0.4423735 to 0.1838936 |
| Intercept | 0.2928392 | 0.5261956 | 0.56 | 0.593 | −0.9205701 to 1.506248 |
| Outcomes | Number of studies | HR (95%CI) | PA | Heterogeneity test | |
|---|---|---|---|---|---|
| P | I2 (%) | ||||
| PA: P for association; it represents the statistical significance P value for the pooled effect size (HR) to test whether the HR is significantly different from 1. CVD: cardiovascular disease; T2DM: type 2 diabetes mellitus; HR: hazard ratio; CI: confidence interval. | |||||
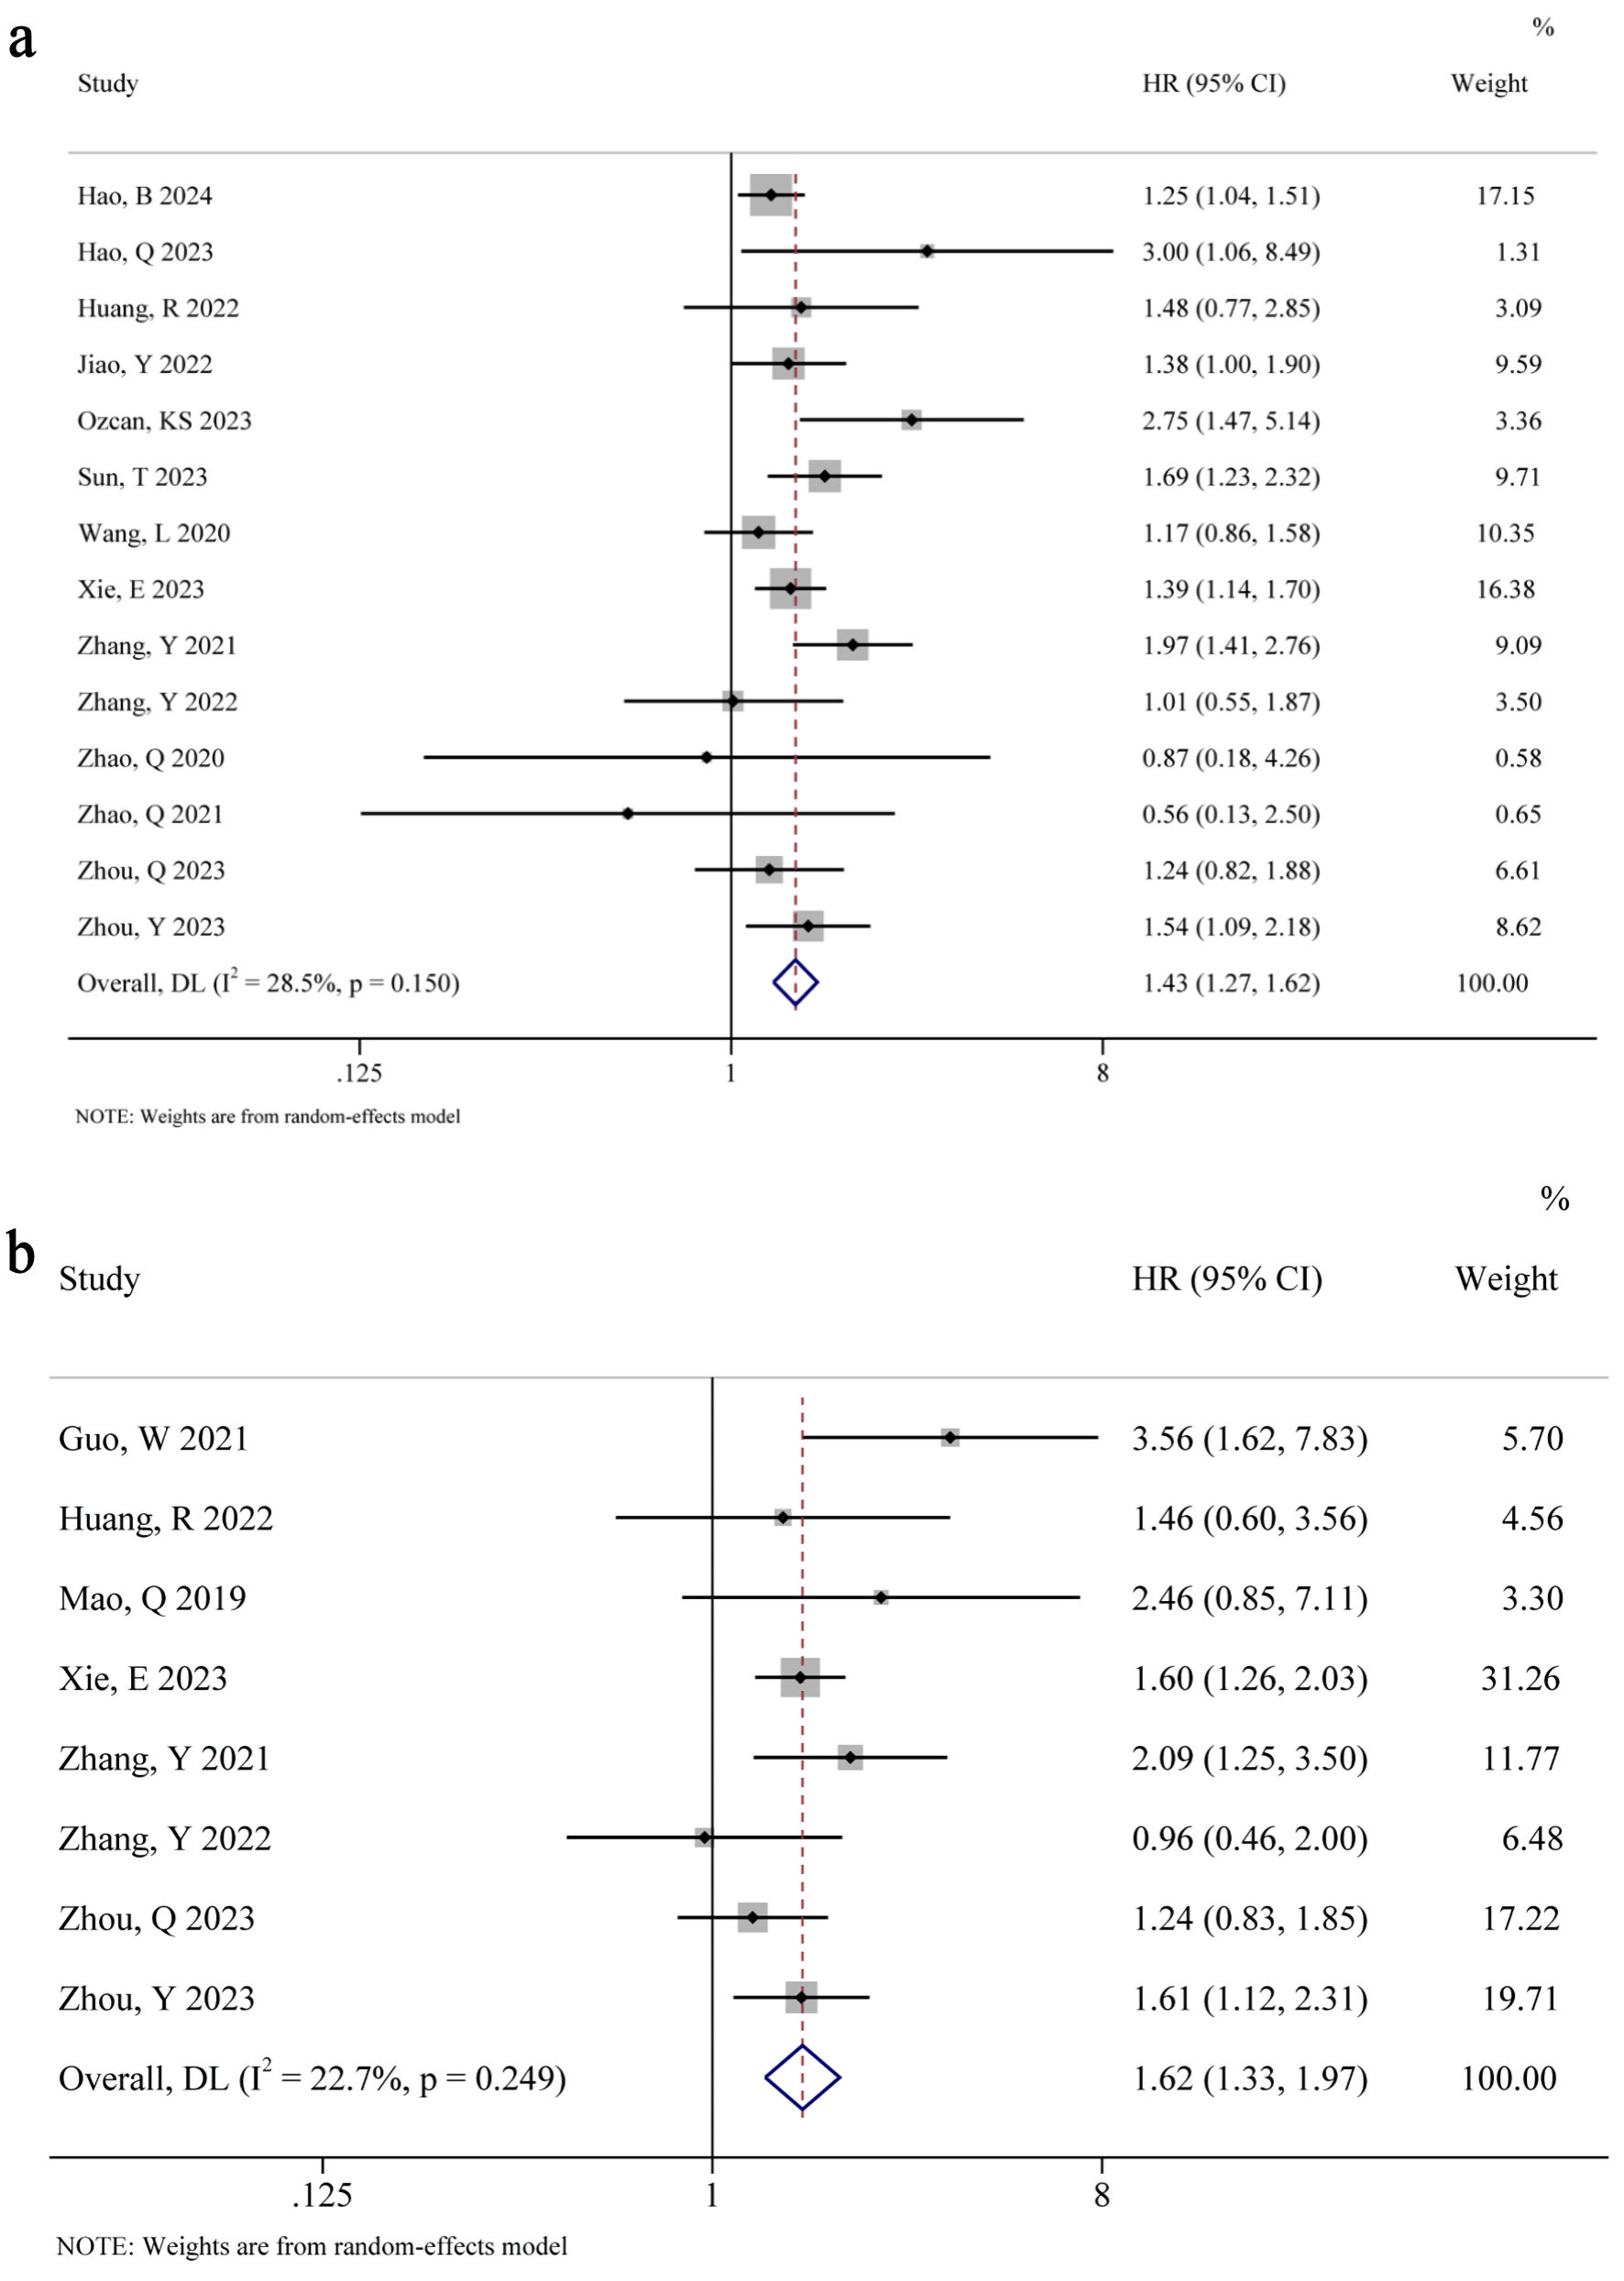
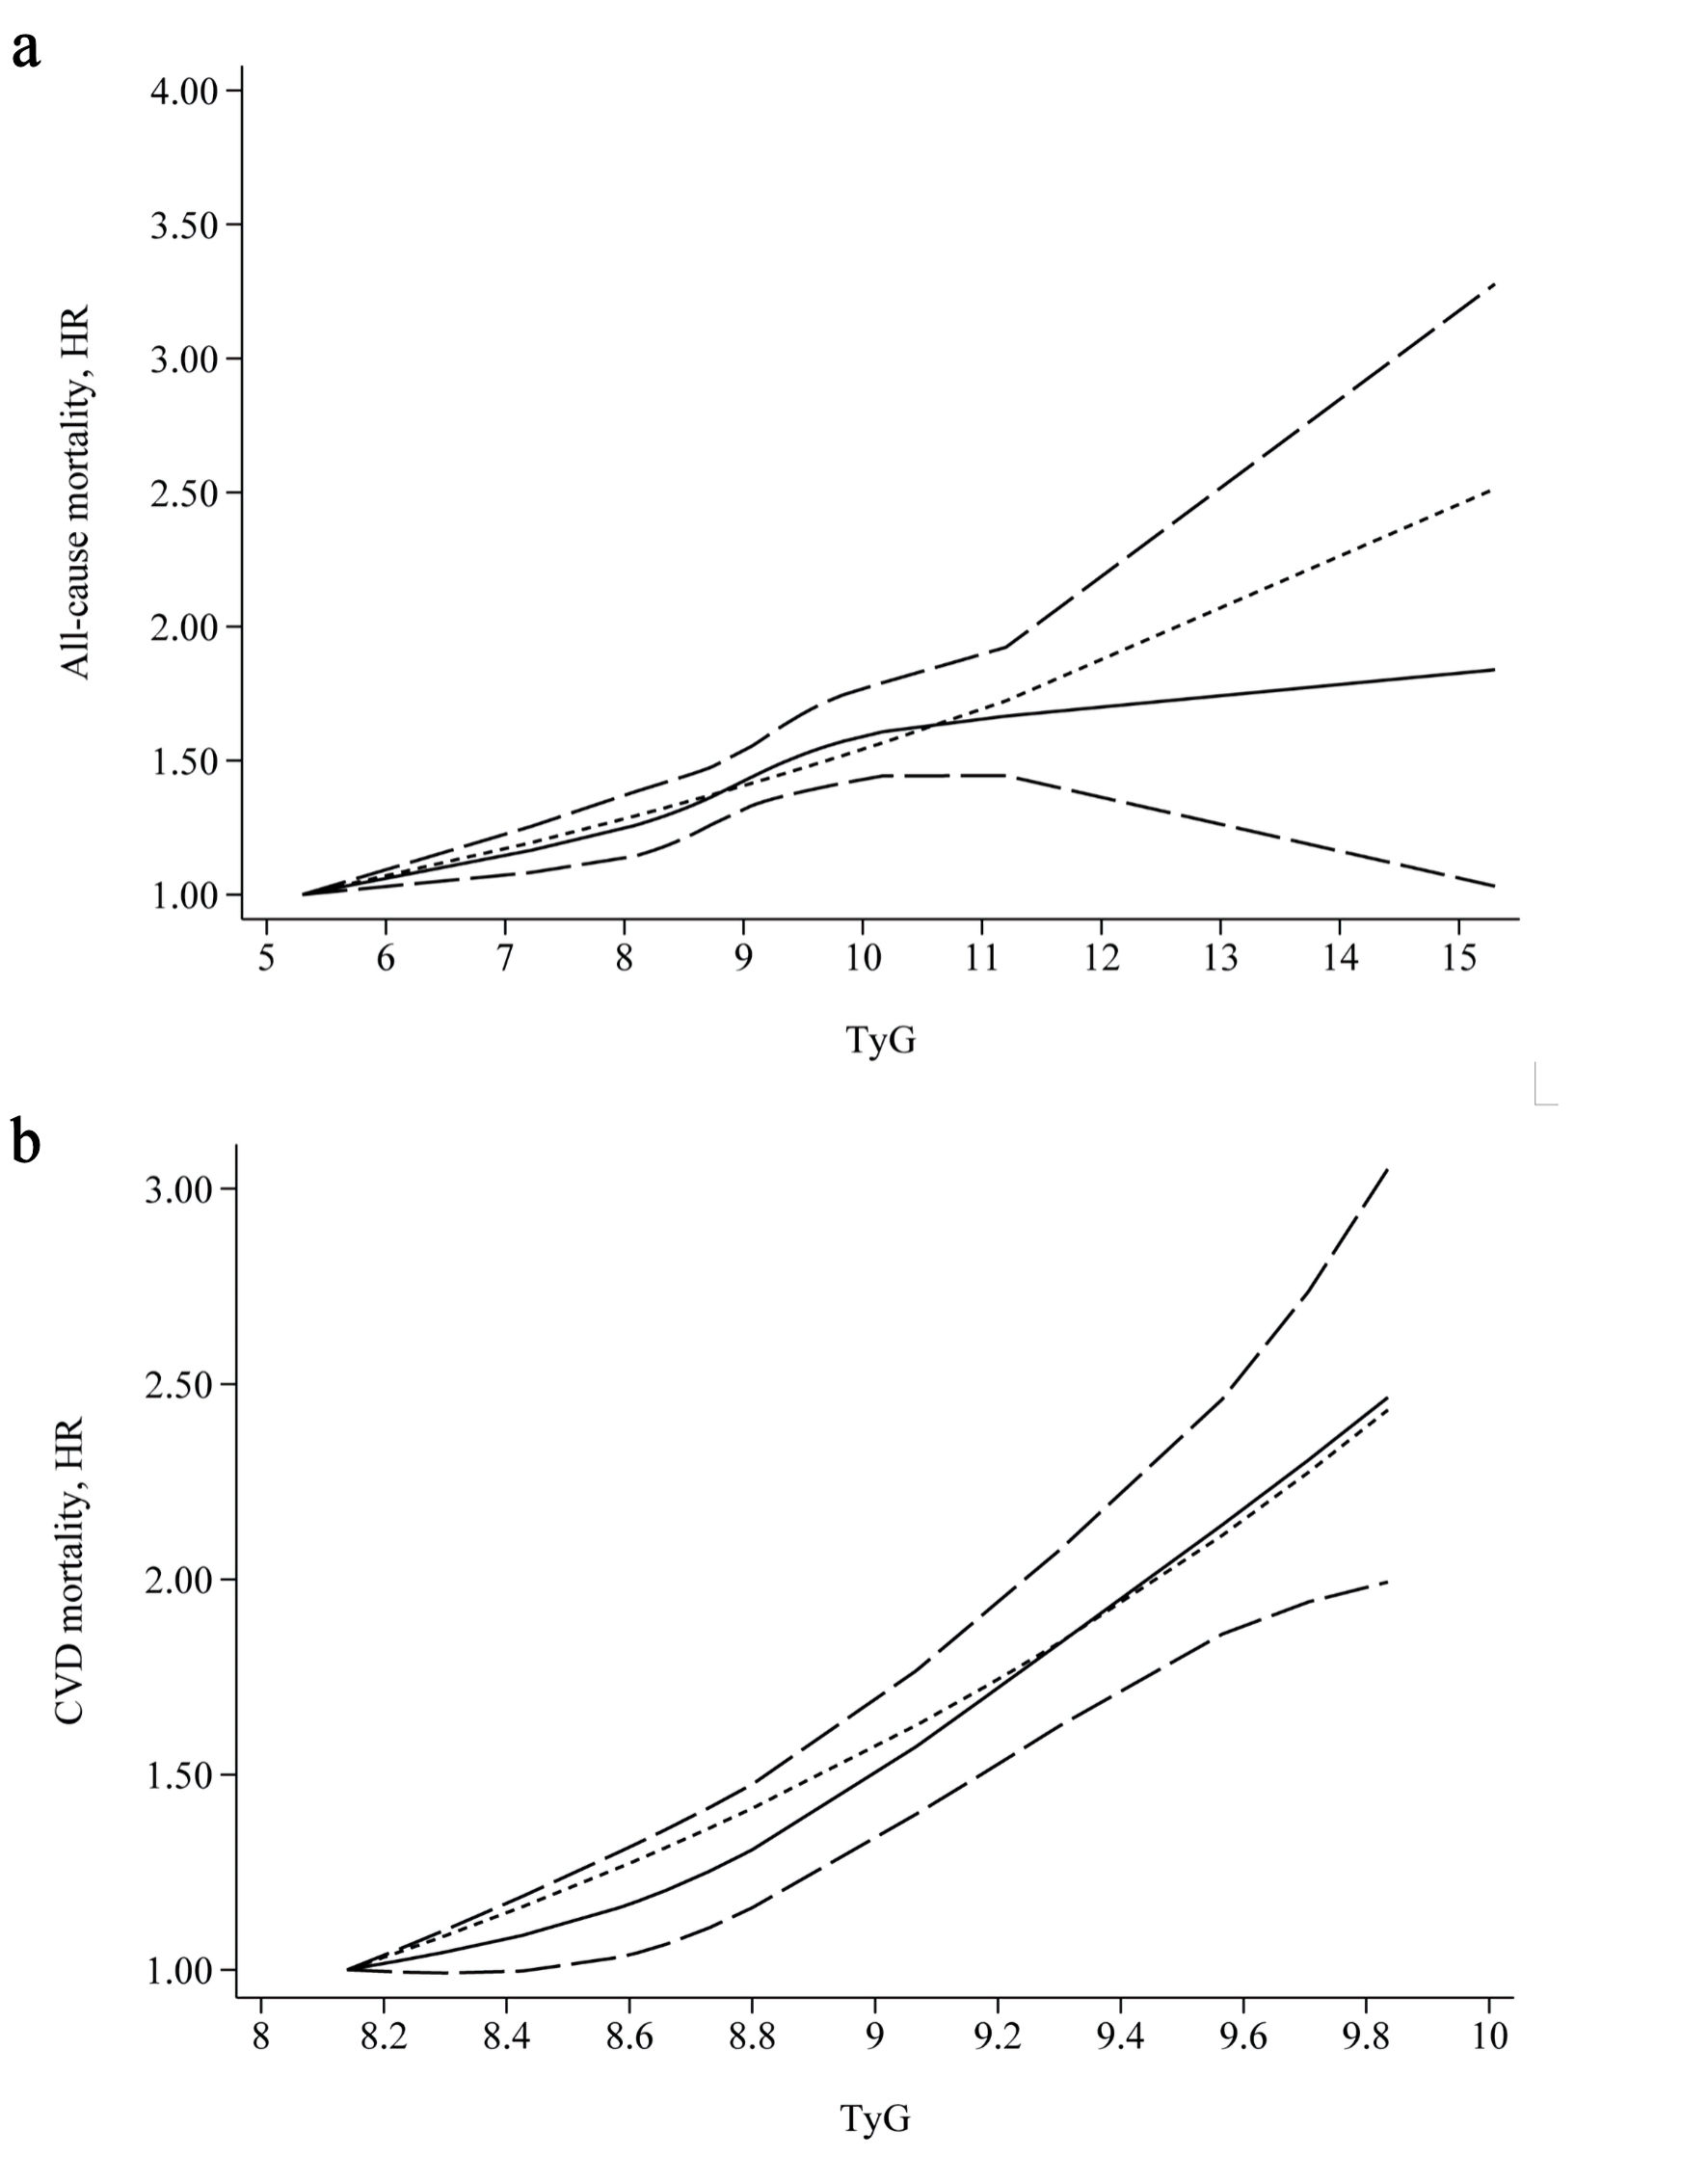
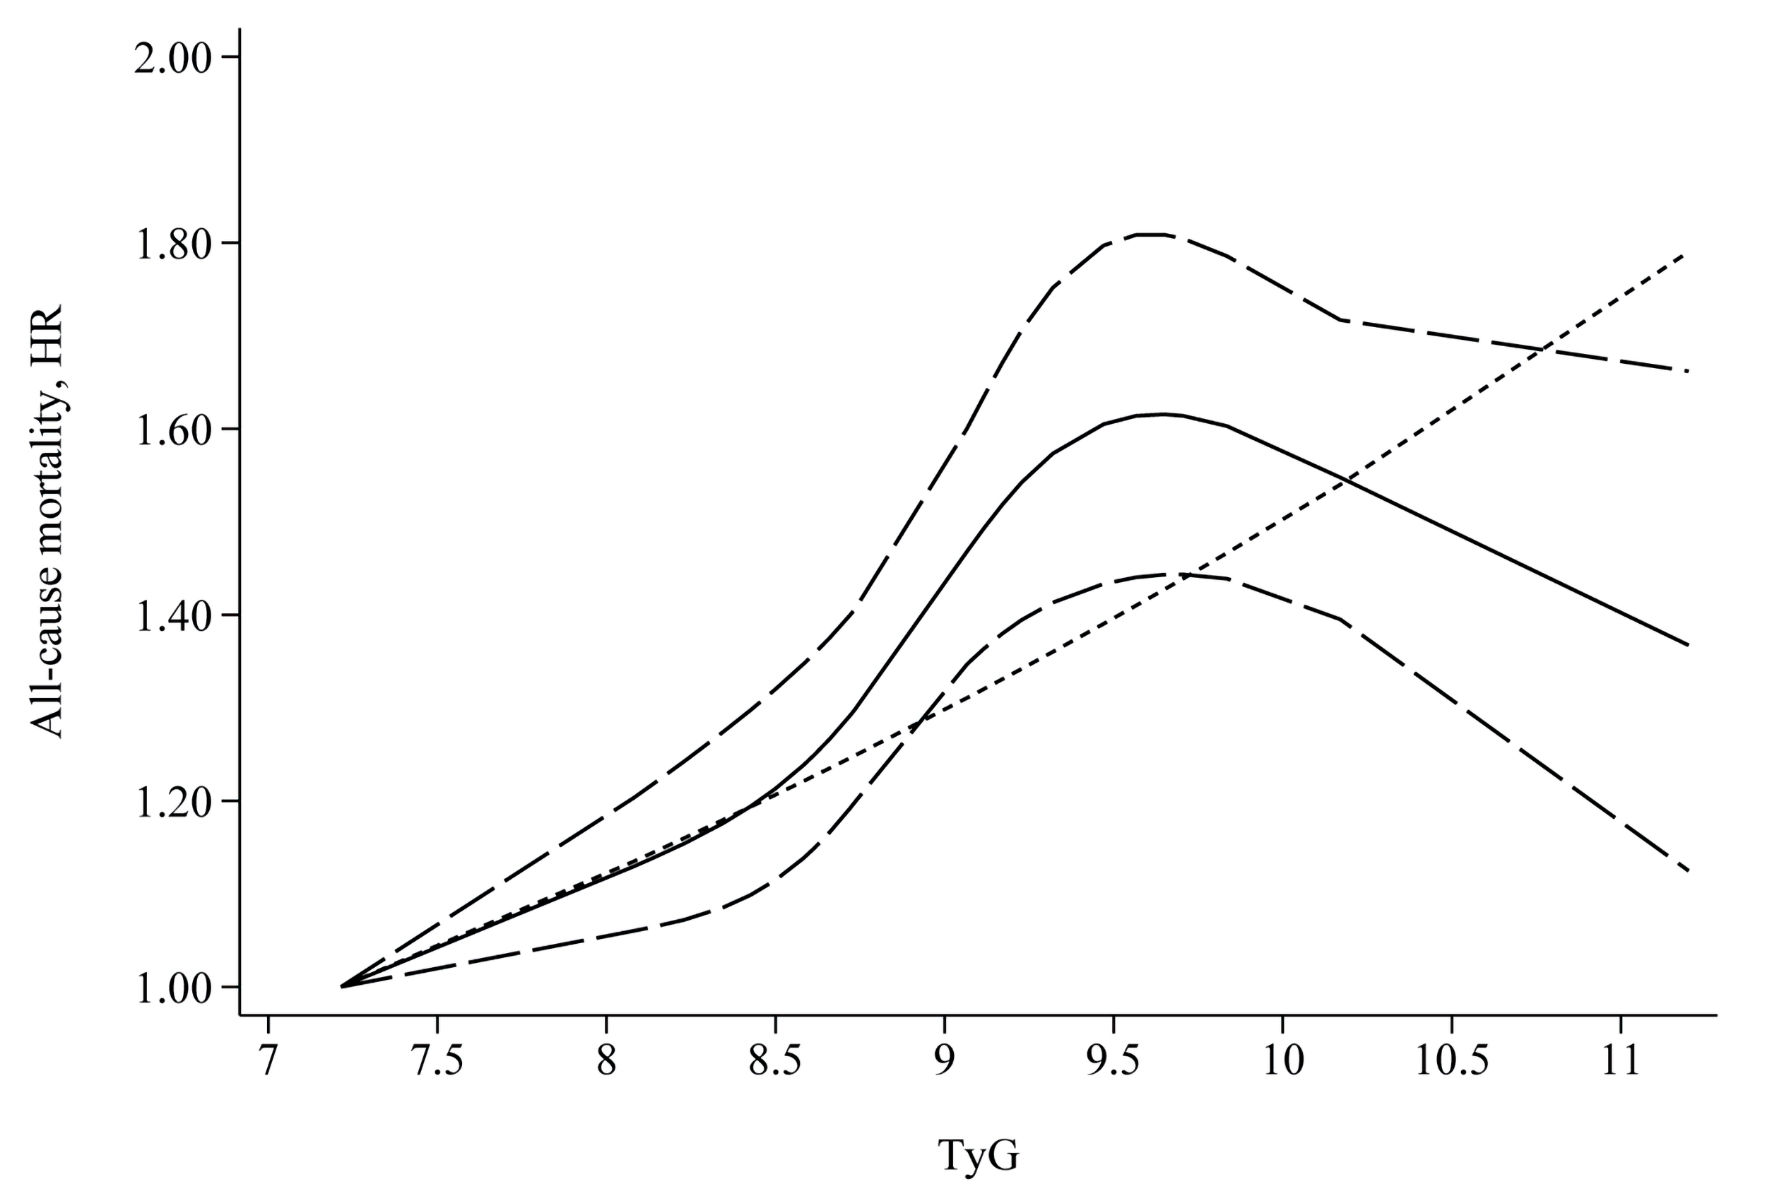
| All-cause mortality | 14 | 1.43 (1.27, 1.62) | < 0.001 | 0.150 | 28.5 |
| Type of CVD | |||||
| Acute | 9 | 1.38 (1.13, 1.68) | 0.001 | 0.217 | 25.5 |
| Chronic | 2 | 1.62 (1.28, 2.05) | < 0.001 | 0.699 | 0.0 |
| With T2DM | |||||
| Yes | 5 | 1.50 (1.10, 2.05) | 0.011 | 0.120 | 45.4 |
| No | 4 | 1.76 (0.53, 5.86) | 0.358 | < 0.001 | 90.9 |
| CVD mortality | 7 | 1.62 (1.33, 1.97) | < 0.001 | 0.249 | 22.7 |
| Type of CVD | |||||
| Acute | 5 | 1.47 (1.09, 1.99) | 0.012 | 0.323 | 14.3 |
| Chronic | 2 | 2.21 (1.03, 4.73) | 0.042 | 0.073 | 68.9 |
| Outcomes | Number of studies | Sensitivity analysis | Egger’ s test | |
|---|---|---|---|---|
| HR (95% CI) | Robust | P value | ||
| CVD: cardiovascular disease; HR: hazard ratio; CI: confidence interval. | ||||
| All-cause mortality | 14 | 1.38 (1.23, 1.54) to 1.47 (1.29, 1.69) | Yes | 0.619 |
| CVD mortality | 8 | 1.55 (1.32, 1.82) to 1.70 (1.38, 2.10) | Yes | 0.549 |