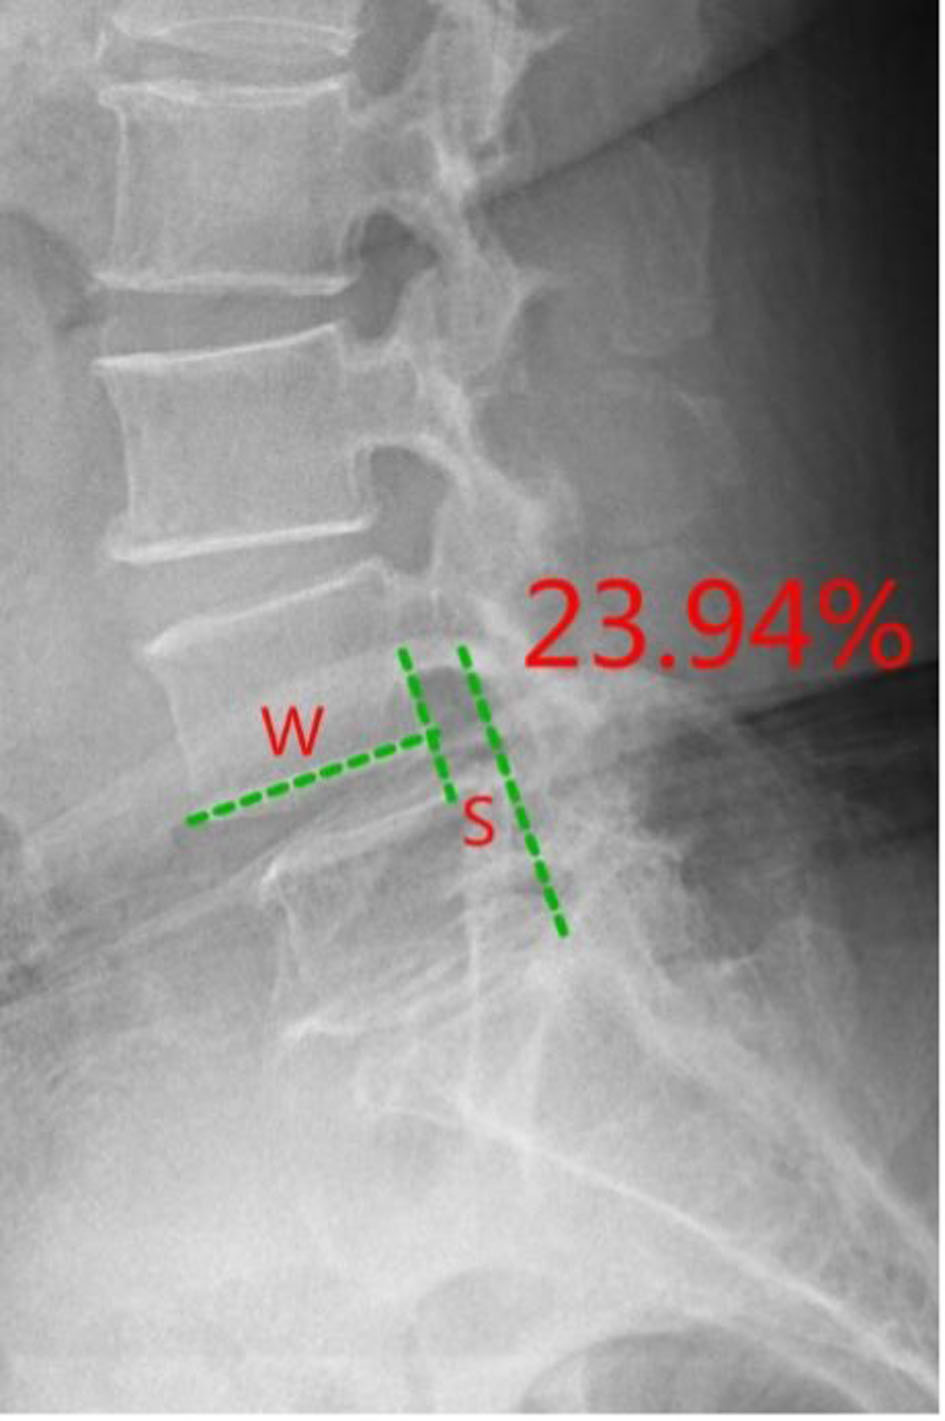
↓ Figure 1. Lumbar spondylolisthesis ratio measurement.
| Journal of Clinical Medicine Research, ISSN 1918-3003 print, 1918-3011 online, Open Access |
| Article copyright, the authors; Journal compilation copyright, J Clin Med Res and Elmer Press Inc |
| Journal website https://jocmr.elmerjournals.com |
Original Article
Volume 18, Number 6, June 2026, pages 369-378
Quantitative Facet Joint Effusion on Magnetic Resonance Imaging Is Associated With Dynamic Segmental Instability and Pain Severity in Degenerative Lumbar Spondylolisthesis
Figures
Tables
| Grade | Criteria |
|---|---|
| 0 | Normal facet joint width (2–4 mm) |
| 1 | Facet joint space narrowing, small osteophytes, and/or mild articular process hypertrophy |
| 2 | Facet joint space narrowing, moderate osteophytes, moderate articular process hypertrophy, and/or small subarticular bone erosions |
| 3 | Facet joint space narrowing, large osteophytes, severe articular process hypertrophy, subarticular bone erosions, and/or subchondral cyst formation |
| Variable | Total (n = 151) | LSI unstable (n = 72) | LSI stable (n = 79) | P value |
|---|---|---|---|---|
| Values are presented as mean ± standard deviation (SD) or median (interquartile range, IQR) for continuous variables, and n (%) for categorical variables. Tests used: independent t-test for normally distributed continuous variables; Mann–Whitney U test (MW) for non-normal continuous variables; Pearson’s χ2 test or Fisher’s exact test for categorical variables as appropriate. P values two-sided. max FJE: maximum facet joint effusion (mm); LSI: lumbar segmental instability (LSI = 1: unstable; 0: stable). For reproducibility: dataset variable names are max_FJE and instability_bin. BMI: body mass index; FJE: facet joint effusion; LSI: lumbar spine instability; VAS: Visual Analog Scale. | ||||
| Age, years | 64.52 ± 9.76 | 63.81 ± 8.47 | 65.16 ± 10.81 | 0.372 |
| Sex, male, n (%) | 33/151 (21.85%) | 13/72 (18.06%) | 20/79 (25.32%) | 0.330 |
| BMI, kg/m2, mean ± SD | 26.33 ± 4.20 | 27.42 ± 4.19 | 25.35 ± 4.00 | 0.002 |
| Hypertension, n (%) | 61/151 (40.40%) | 36/72 (50%) | 25/79 (31.65%) | 0.030 |
| Diabetes, n (%) | 57/151 (37.75%) | 32/72 (44.44%) | 25/79 (31.65%) | 0.077 |
| Smoking, n (%) | 17/151 (11.26%) | 6/72 (8.33%) | 11/79 (13.92%) | 0.409 |
| Alcohol, n (%) | 13/151 (8.61%) | 5/72 (6.94%) | 8/79 (10.13%) | 0.567 |
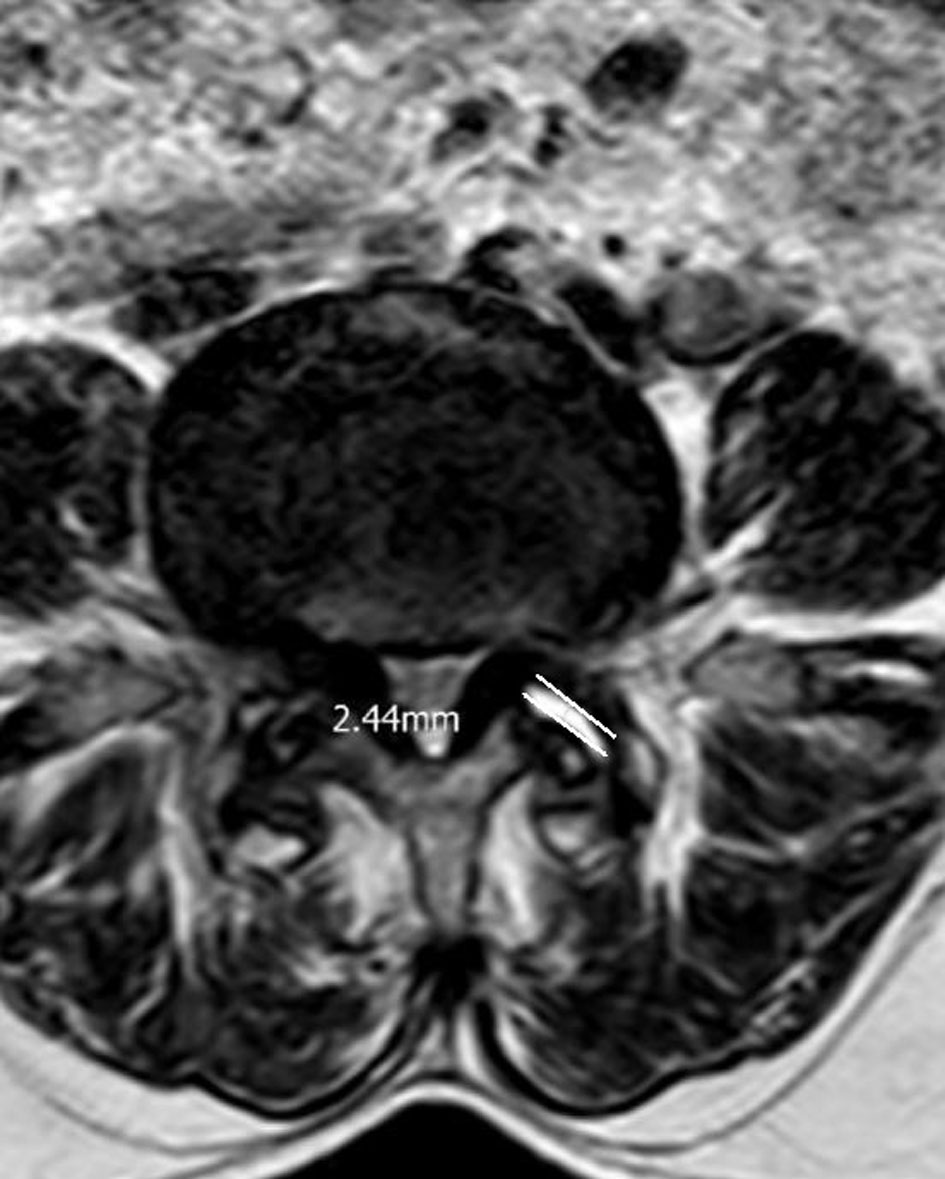
| max FJE, mm, median (IQR) | 1.16 (2.78) | 2.81 (0.963) | 0.00 (0.500) | < 0.001 |
| FJE present, n (%) | 88/151 (58.28%) | 67/72 (93.06%) | 21/79 (26.59%) | < 0.001 |
| VAS, median (IQR) | 3 (2) | 5 (1) | 3 (1) | < 0.001 |
| Predictor | Coefficient (β) | SE | OR | 95% CI | P value |
|---|---|---|---|---|---|
| Model: multivariable binary logistic regression with dependent variable LSI (unstable = 1, stable = 0). max FJE entered as continuous (mm). OR = exp(β). Model diagnostics performed: assessed linearity in the logit for continuous predictors, multicollinearity (variance inflation factor), goodness-of-fit (Hosmer–Lemeshow), and discrimination (AUC). BMI: body mass index; CI: confidence interval; FJE: facet joint effusion; OR: odds ratio; SE: standard error. | |||||
| Intercept | −2.863 | 2.898 | - | - | 0.323 |
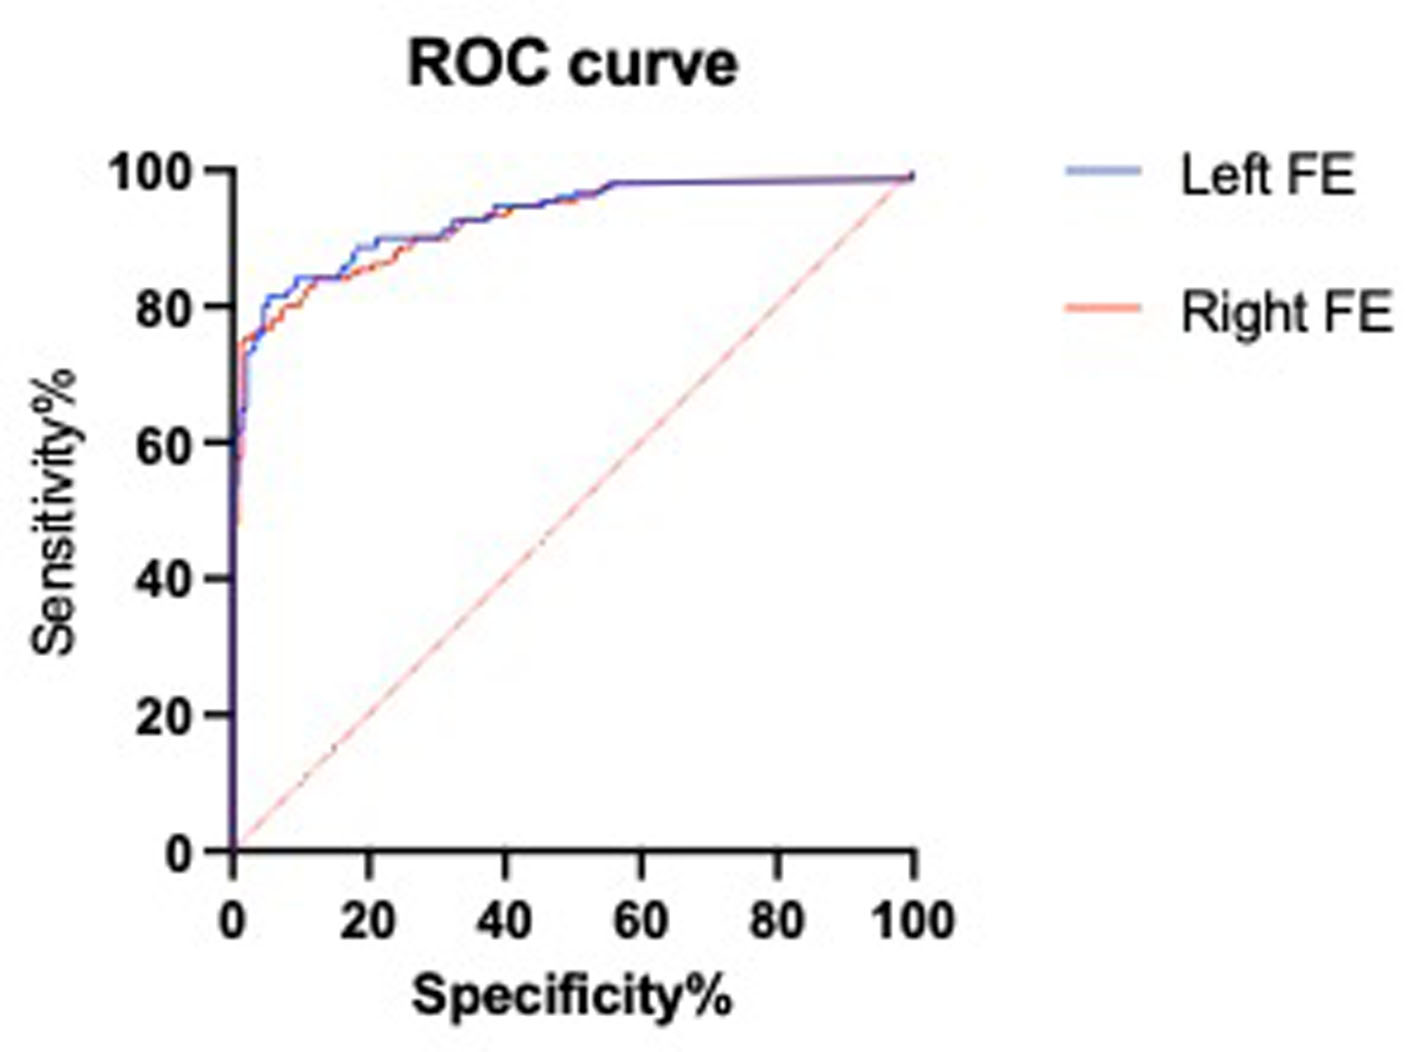
| max FJE (per 1 mm) | 1.825 | 0.268 | 6.20 | 3.67–10.48 | < 0.001 |
| Sex (male vs. female) | 0.047 | 0.887 | 1.05 | 0.18–5.97 | 0.958 |
| Age (per year) | −0.0078 | 0.031 | 0.99 | 0.93–1.05 | 0.801 |
| BMI (per kg/m2) | 0.0102 | 0.071 | 1.01 | 0.88–1.16 | 0.886 |
| Hypertension (yes vs. no) | 0.683 | 0.624 | 1.98 | 0.58–6.72 | 0.274 |
| Diabetes (yes vs. no) | 0.481 | 0.612 | 1.62 | 0.49–5.37 | 0.432 |
| Smoking (yes vs. no) | −0.925 | 1.127 | 0.40 | 0.04–3.61 | 0.412 |
| Alcohol (yes vs. no) | 0.576 | 1.157 | 1.78 | 0.18–17.19 | 0.619 |
| Number of joint effusions (151) | LSI (72) | Non-LSI (79) | P |
|---|---|---|---|
| LSI: lumbar spine instability. | |||
| Left | 66/72 | 17/79 | |
| Number | |||
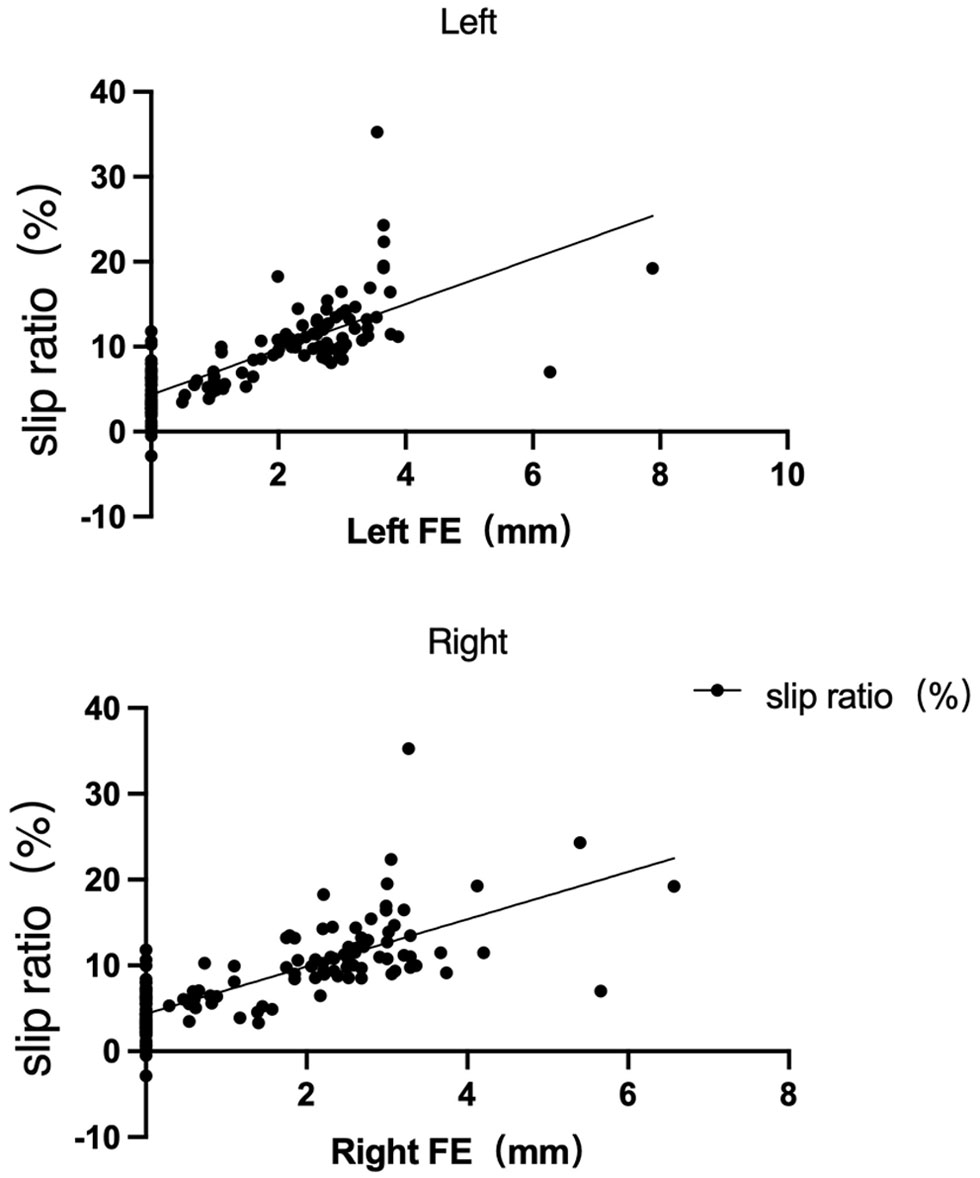
| Effusions width (mm) | 2.80 ± 0.90 | 1.31 ± 1.32 | < 0.001 |
| Right | 66/72 | 18/79 | |
| Number | |||
| Effusions width (mm) | 2.70 ± 0.88 | 1.20 ± 1.22 | < 0.001 |
| Bilateral | 67/72 | 21/79 | |
| Number | |||
| Effusions width (mm) | 2.75 ± 0.89 | 1.25 ± 1.25 | < 0.001 |
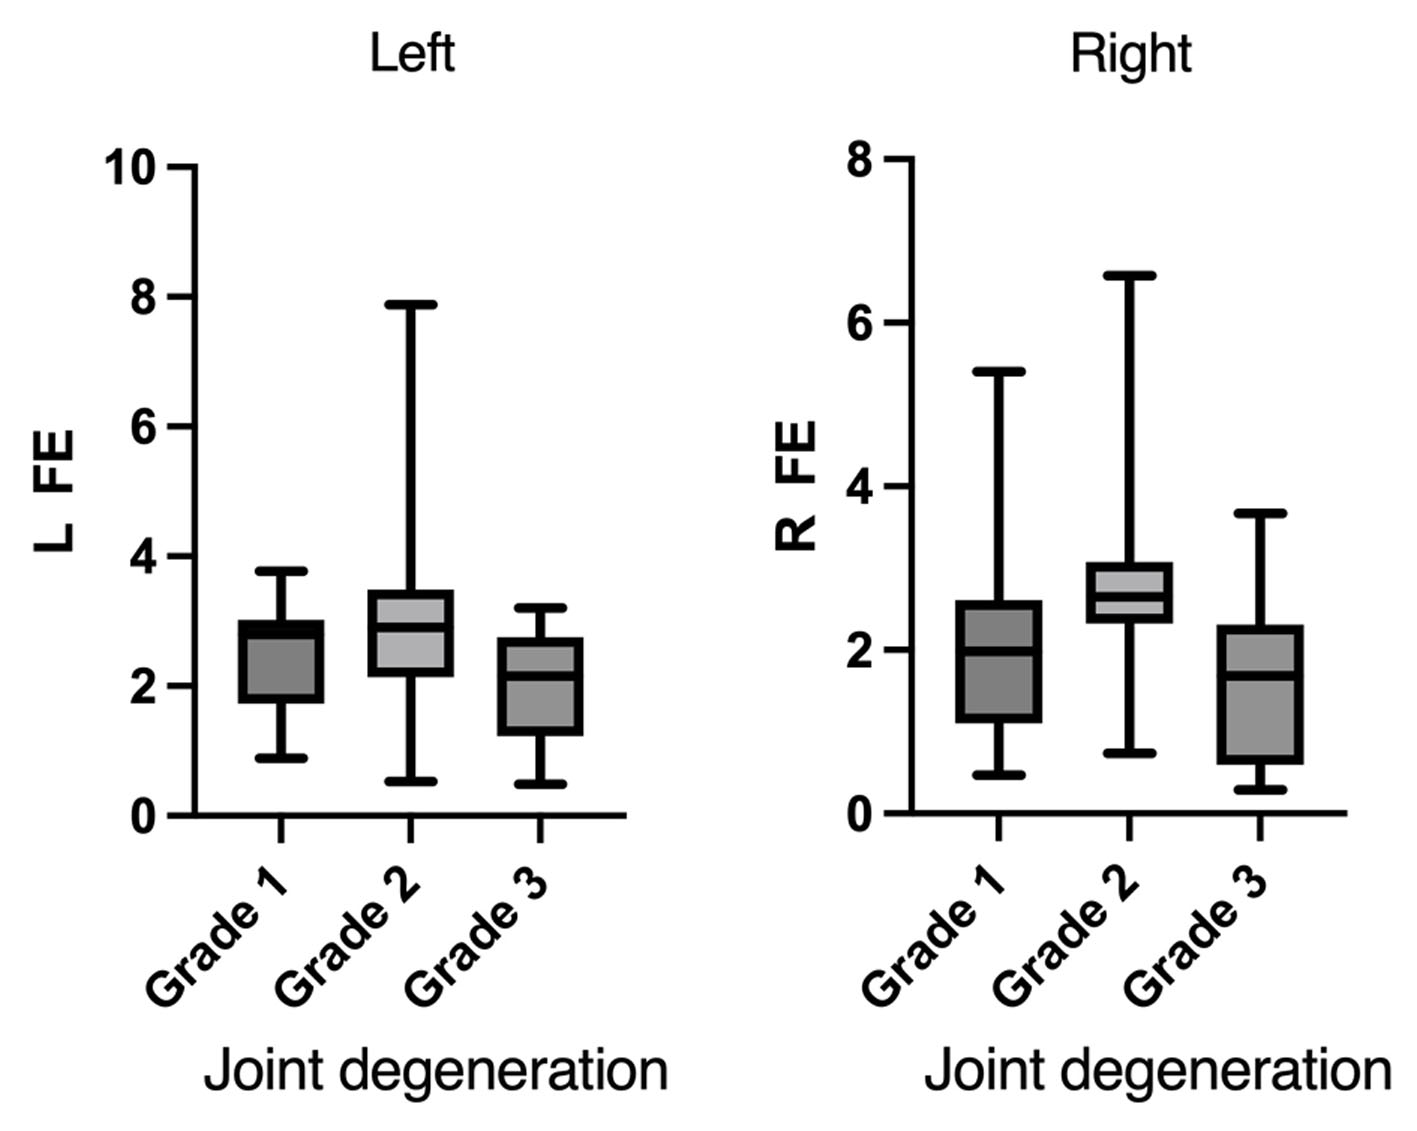
| Grade | Number of FJE/degenerated joints | Effusions width (mm) | VAS | |
|---|---|---|---|---|
| FJE: facet joint effusion; VAS: Visual Analog Scale. | ||||
| 1 | Left | 18/21 | 2.49 ± 0.84 | 3.77 ± 0.99 |
| Right | 18/34 | 2.07 ± 1.27 | ||
| 2 | Left | 37/58 | 2.84 ± 1.42 | 3.86 ± 1.29 |
| Right | 50/62 | 2.73 ± 0.96 | ||
| 3 | Left | 28/62 | 2.04 ± 0.76 | 3.44 ± 1.16 |
| Right | 16/55 | 1.62 ± 1.05 | ||