| Journal of Clinical Medicine Research, ISSN 1918-3003 print, 1918-3011 online, Open Access |
| Article copyright, the authors; Journal compilation copyright, J Clin Med Res and Elmer Press Inc |
| Journal website https://jocmr.elmerjournals.com |
Original Article
Volume 18, Number 7, July 2026, pages 449-455
Dysmenorrhea and Absence of Restorative Sleep
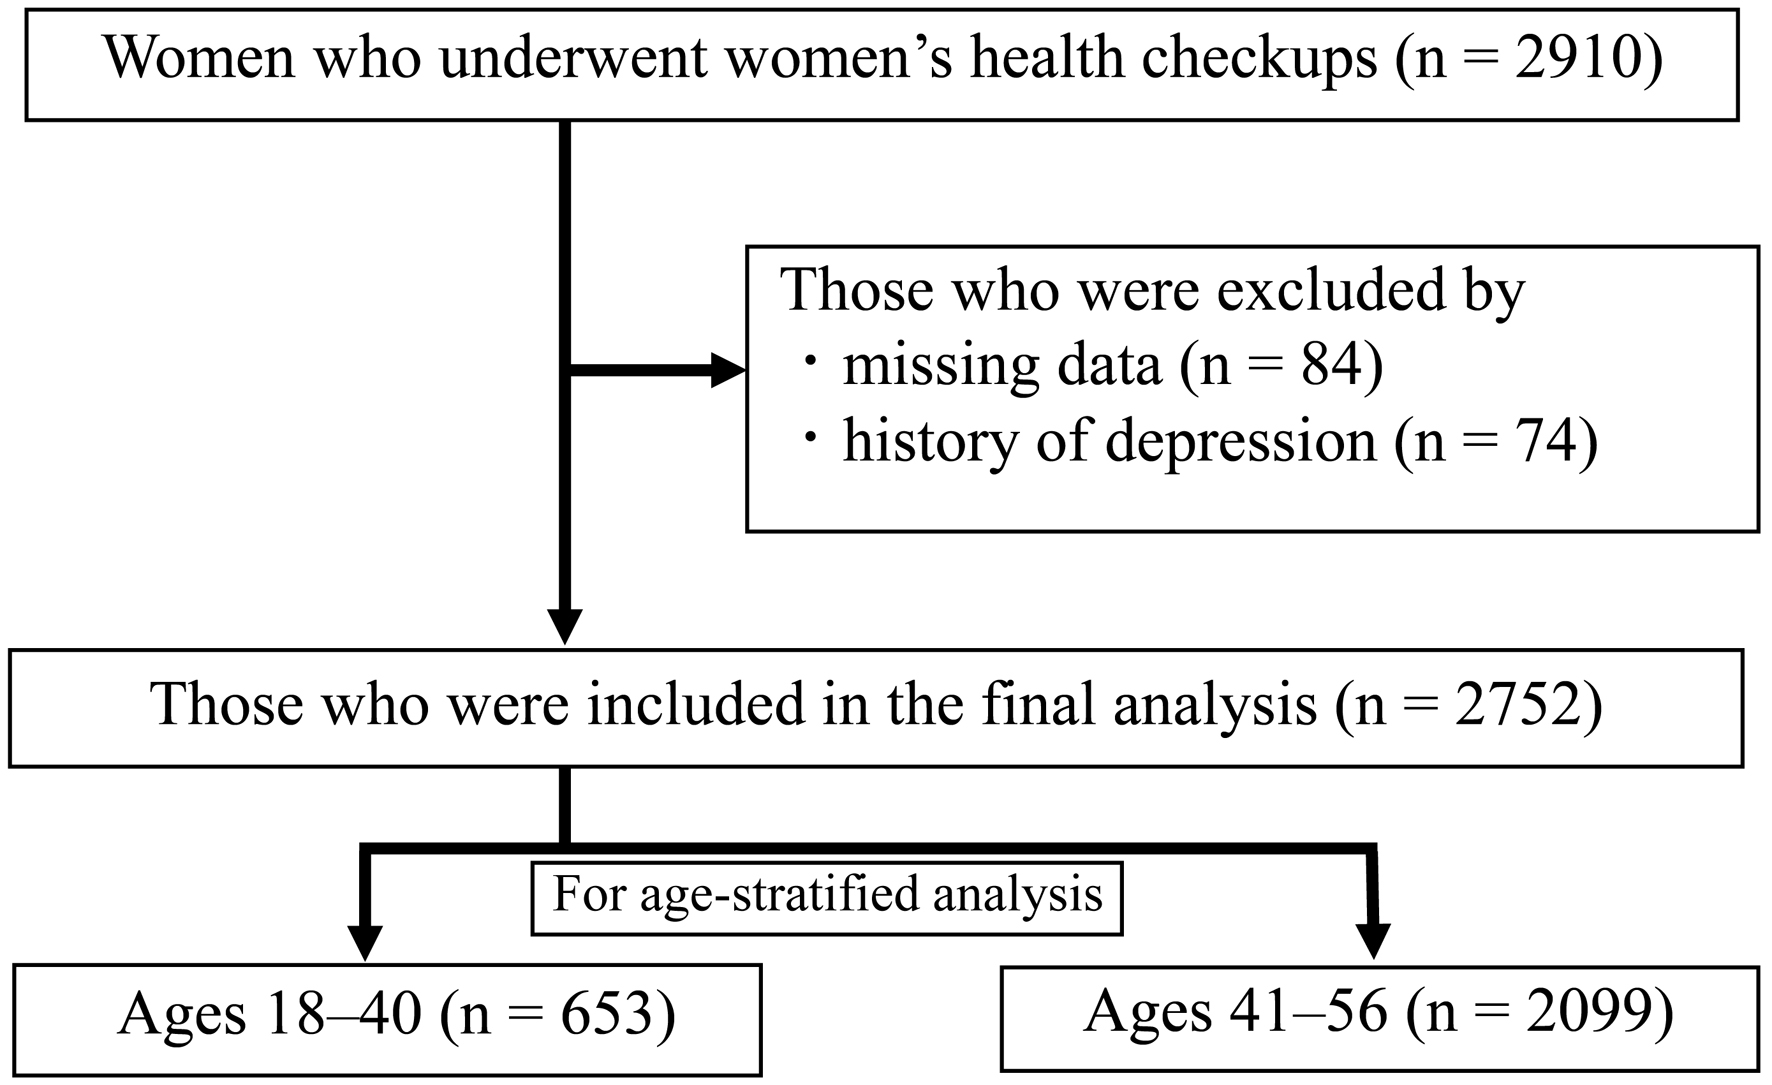
Figure

Tables
| Variable | All (n = 2,752) | Restorative sleep (+) (n = 1,694) | Restorative sleep (-) (n = 1,058) | P value |
|---|---|---|---|---|
| Data are shown as the mean ± standard deviation, median (interquartile range), and percentage. P-values represent the difference in each variable among women with mild to severe dysmenorrhea (by Chi-square test or analysis of variance). *P < 0.05, in comparison to the mild dysmenorrhea group (by residual tests following Chi-squared test or t-test). BMI: body mass index; LDL-C: low-density lipoprotein cholesterol. | ||||
| Age, years | 43.7 ± 4.8 | 43.6 ± 4.8 | 44.0 ± 4.8 | 0.016* |
| BMI, kg/m2 | 22.3 ± 4.0 | 22.1 ± 3.7 | 22.7 ± 4.3 | < 0.001* |
| LDL-C, mg/dL | 114 ± 29 | 113 ± 28 | 117 ± 30 | < 0.001* |
| Fasting plasma glucose, mg/dL | 95 ± 10 | 95 ± 11 | 95 ± 10 | 0.498 |
| Current smoking habit, n (%) | 262 (9.5%) | 154 (9.1%) | 108 (10.2%) | 0.331 |
| Exercise habit, n (%) | 364 (13.2%) | 248 (14.6%) | 116 (11.0%) | 0.006* |
| Alcohol habit, n (%) | 1,338 (48.6%) | 870 (51.4%) | 468 (44.2%) | < 0.001* |
| Menstrual irregularity, present | 673 (24.5%) | 367 (21.7%) | 306 (28.9%) | < 0.001* |
| Dysmenorrhea | < 0.001* | |||
| Non-to-mild state | 1,377 (50.0%) | 898 (53.0%) | 479 (45.3%) | |
| Moderate state | 1,102 (40.0%) | 671 (39.6%) | 431 (40.7%) | |
| Severe state | 273 (10.0%) | 125 (7.4%) | 148 (14.0%) | |
| Variable | Univariate analysis | Multivariate analysis | ||
|---|---|---|---|---|
| OR (95% CI) | P value | OR (95% CI) | P value | |
| *P < 0.05. BMI: body mass index; CI: confidence interval; LDL-C: low-density lipoprotein cholesterol; OR: odds ratio. | ||||
| Age, years | 1.020 (1.004–1.037) | 0.016* | 1.017 (1.000–1.035) | 0.057 |
| BMI, kg/m2 | 1.037 (1.017–1.057) | < 0.001* | 1.026 (1.005–1.048) | 0.017* |
| LDL–C, mg/dL | 1.005 (1.002–1.007) | < 0.001* | 1.002 (1.000–1.005) | 0.113 |
| Fasting plasma glucose, mg/dL | 1.003 (0.995–1.010) | 0.500 | 1.000 (1.000–1.006) | 0.547 |
| Current smoking habit, presence | 1.137 (0.877–1.473) | 0.332 | 1.074 (0.823–1.400) | 0.600 |
| Exercise habit, absence | 1.393 (1.101–1.762) | 0.006* | 1.409 (1.108–1.792) | 0.005* |
| Alcohol habit, presence | 0.751 (0.644–0.877) | < 0.0001* | 0.767 (0.654–0.898) | 0.001* |
| Menstrual irregularity, presence | 1.471 (1.234–1.755) | < 0.001* | 1.368 (1.138–1.644) | 0.001* |
| Dysmenorrhea: moderate vs. non-to-mild state | 1.048 (0.896–1.226) | 0.557 | 1.241 (1.049–1.467) | 0.012* |
| Dysmenorrhea: severe vs. non-to-mild state | 2.041 (1.587–2.626) | < 0.001* | 2.282 (1.744–2.986) | < 0.001* |
| Variable | All (n = 653) | Restorative sleep (+) (n = 424) | Restorative sleep (-) (n = 229) | P value |
|---|---|---|---|---|
| Data are shown as the mean ± standard deviation, median (interquartile range), and percentage. P-values represent the difference in each variable among women with mild to severe dysmenorrhea (by chi-square test or analysis of variance). *P < 0.05, in comparison to the mild dysmenorrhea group (by residual tests following Chi-squared test or t-test). BMI, body mass index; LDL-C, low-density lipoprotein cholesterol. | ||||
| Age, years | 37.1 ± 2.8 | 37.2 ± 2.8 | 37.0 ± 3.0 | 0.456 |
| BMI, kg/m2 | 21.8 ± 4.1 | 21.5 ± 3.8 | 22.2 ± 4.7 | 0.038* |
| LDL-C, mg/dL | 106 ± 28 | 104 ± 27 | 109 ± 31 | 0.057 |
| Fasting plasma glucose, mg/dL | 93 ± 9 | 93 ± 7 | 93 ± 12 | 0.590 |
| Current smoking habit, n (%) | 61 (9.3%) | 41 (9.7%) | 20 (8.7%) | 0.695 |
| Exercise habit, n (%) | 66 (10.1%) | 50 (11.8%) | 16 (7.0%) | 0.052 |
| Alcohol habit, n (%) | 322 (49.3%) | 221 (52.1%) | 101 (44.1%) | 0.051 |
| Menstrual irregularity, present | 112 (17.2%) | 57 (13.4%) | 55 (24.0%) | < 0.001* |
| Dysmenorrhea | < 0.001* | |||
| Non-to-mild state | 246 (38.0%) | 175 (41.3%) | 73 (31.9%) | |
| Moderate state | 313 (47.9%) | 203 (47.9%) | 110 (48.0%) | |
| Severe state | 92 (14.1%) | 46 (10.8%) | 46 (20.1%) | |
| Variable | Univariate analysis | Multivariate analysis | ||
|---|---|---|---|---|
| OR (95% CI) | P value | OR (95% CI) | P value | |
| *P < 0.05. BMI: body mass index; CI: confidence interval; LDL-C: low-density lipoprotein cholesterol; OR: odds ratio. | ||||
| Age, years | 0.979 (0.925–1.035) | 0.454 | 0.982 (0.926–1.041) | 0.537 |
| BMI, kg/m2 | 1.041 (1.002–1.082) | 0.040* | 1.036 (0.992–1.083) | 0.111 |
| LDL-C, mg/dL | 1.005 (1.000–1.011) | 0.058 | 1.003 (0.997–1.009) | 0.391 |
| Fasting plasma glucose, mg/dL | 1.005 (0.988–1.022) | 0.591 | 0.997 (0.978–1.016) | 0.732 |
| Current smoking habit, presence | 0.894 (0.510–1.566) | 0.695 | 0.751 (0.415–1.361) | 0.345 |
| Exercise habit, absence | 1.780 (0.989–3.203) | 0.054 | 1.889 (1.022–3.492) | 0.042* |
| Alcohol habit, presence | 0.725 (0.525–1.001) | 0.051 | 0.738 (0.527–1.035) | 0.078 |
| Menstrual irregularity, presence | 2.035 (1.348–3.073) | < 0.001* | 1.914 (1.246–2.939) | 0.003* |
| Dysmenorrhea: moderate vs. non-to-mild state | 1.006 (0.729–1.388) | 0.969 | 1.360 (0.942–1.965) | 0.101 |
| Dysmenorrhea: severe vs. non-to-mild state | 2.066 (1.323–3.224) | 0.001* | 2.569 (1.545–4.272) | < 0.001* |
| Variable | All (n = 2,099) | Restorative sleep (+) (n = 1,270) | Restorative sleep (-) (n = 829) | P value |
|---|---|---|---|---|
| Data are shown as the mean ± standard deviation, median (interquartile range), and percentage. P-values represent the difference in each variable among women with mild to severe dysmenorrhea (by chi-square test or analysis of variance). *P < 0.05, in comparison to the mild dysmenorrhea group (by residual tests following Chi-squared test or t-test). BMI: body mass index; LDL-C: low-density lipoprotein cholesterol. | ||||
| Age, years | 45.8 ± 3.1 | 45.7 ± 3.1 | 45.9 ± 3.1 | 0.066 |
| BMI, kg/m2 | 22.5 ± 3.9 | 22.3 ± 3.7 | 22.8 ± 4.2 | 0.003* |
| LDL-C, mg/dL | 117 ± 29 | 115 ± 28 | 119 ± 29 | 0.008* |
| Fasting plasma glucose, mg/dL | 95 ± 11 | 95 ± 11 | 95 ± 10 | 0.767 |
| Current smoking habit, n (%) | 201 (9.6%) | 113 (8.9%) | 88 (10.6%) | 0.191 |
| Exercise habit, n (%) | 298 (14.2%) | 198 (15.6%) | 100 (12.1%) | 0.024* |
| Alcohol habit, n (%) | 1,016 (48.4%) | 649 (51.1%) | 367 (44.3%) | 0.002* |
| Menstrual irregularity, present | 561 (26.7%) | 310 (24.4%) | 251 (30.2%) | 0.003* |
| Dysmenorrhea | < 0.001* | |||
| Non-to-mild state | 1,129 (53.8%) | 723 (56.9%) | 406 (49.0%) | |
| Moderate state | 789 (37.6%) | 468 (36.9%) | 321 (38.7%) | |
| Severe state | 181 (8.6%) | 79 (6.2%) | 102 (12.3%) | |
| Variable | Univariate analysis | Multivariate analysis | ||
|---|---|---|---|---|
| OR (95% CI) | P value | OR (95% CI) | P value | |
| *P < 0.05. BMI: body mass index; CI: confidence interval; LDL-C: low-density lipoprotein cholesterol; OR: odds ratio. | ||||
| Age, years | 1.027 (0.998–1.056) | 0.066 | 1.019 (0.988–1.051) | 0.232 |
| BMI, kg/m2 | 1.034 (1.011–1.057) | 0.003* | 1.024 (0.999–1.050) | 0.056 |
| LDL-C, mg/dL | 1.004 (1.001–1.007) | 0.009* | 1.002 (0.999–1.005) | 0.208 |
| Fasting plasma glucose, mg/dL | 1.001 (0.993–1.009) | 0.767 | 0.997 (0.988–1.007) | 0.583 |
| Current smoking habit, presence | 1.216 (0.907–1.631) | 0.192 | 1.179 (0.873–1.591) | 0.282 |
| Exercise habit, absence | 1.346 (1.040–1.743) | 0.024* | 1.335 (1.027–1.736) | 0.031* |
| Alcohol habit, presence | 0.760 (0.638–0.906) | 0.002* | 0.773 (0.646–0.925) | 0.005* |
| Menstrual irregularity, presence | 1.345 (1.106–1.636) | 0.003* | 1.256 (1.020–1.546) | 0.032* |
| Dysmenorrhea | ||||
| Moderate vs. non-to-mild state | 1.083 (0.904–1.297) | 0.387 | 1.219 (1.009–1.474) | 0.040* |
| Dysmenorrhea: severe vs. non-to-mild state | 2.115 (1.555–2.878) | < 0.001* | 2.242 (1.624–3.095) | < 0.001* |