Journal of Clinical Medicine Research, ISSN 1918-3003 print, 1918-3011 online, Open Access
Article copyright, the authors; Journal compilation copyright, J Clin Med Res and Elmer Press Inc
Journal website https://jocmr.elmerjournals.com

Original Article

Volume 18, Number 6, June 2026, pages 379-393


Baseline Lactate Dehydrogenase Predicts Early Treatment Failure in Diffuse Large B-Cell Lymphoma Treated With R-CHOP: A Real-World Cohort Study

Figures

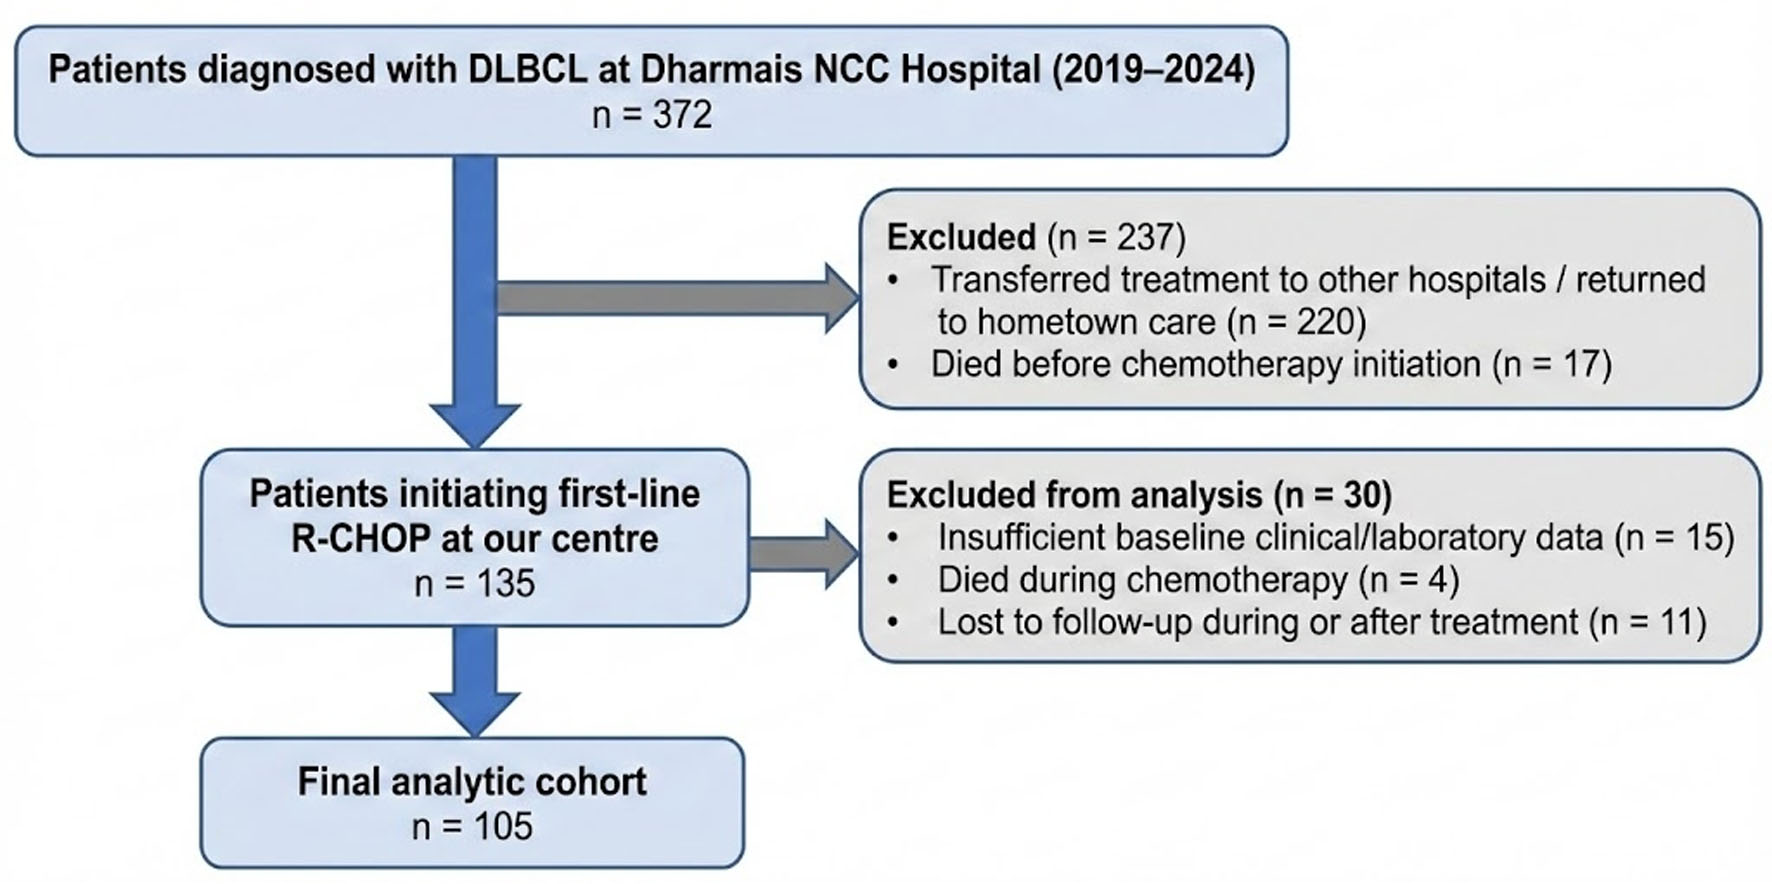
↓  Figure 1. Flow diagram of patient selection and study cohort derivation. Patients diagnosed with DLBCL at Dharmais National Cancer Center Hospital between 2019 and 2024 were retrospectively screened from hospital medical records. The diagram shows sequential exclusions before cohort entry and before final analysis. The final analytic cohort consisted of 105 patients who initiated first-line R-CHOP at our center and had sufficient baseline and outcome data for early treatment failure classification. DLBCL: diffuse large B-cell lymphoma; R-CHOP: rituximab, cyclophosphamide, doxorubicin, vincristine, and prednisone.
Figure 1.
↓  Figure 2. Discriminative performance of the multivariable logistic regression model for ETF in DLBCL (AUC = 0.646; 95% CI 0.540–0.752). The ROC curve demonstrates limited-to-modest discriminative ability of the model incorporating ECOG performance status, disease stage, anemia, LDH level, and age group. The AUC was 0.646 (95% CI 0.540–0.752; P = 0.010). AUC: area under the curve; CI: confidence interval; DLBCL: diffuse large B-cell lymphoma; ECOG: Eastern Cooperative Oncology Group; ETF: early treatment failure; LDH: lactate dehydrogenase; ROC: receiver operating characteristic.
Figure 2.

Tables

↓  Table 1. Baseline Clinical Characteristics According to LDH Category
 
VariableOverall cohort (n = 105)Normal LDH ≤ 250 U/L (n = 37)High LDH > 250 U/L (n = 68)P value
LDH groups were defined using the institutional upper limit of normal: normal LDH ≤ 250 U/L and high LDH > 250 U/L. Continuous variables are presented as mean ± SD or median (IQR), depending on data distribution. Categorical variables are presented as number (percentage). Between-group p values are descriptive. BMI: body mass index; ECOG: Eastern Cooperative Oncology Group; IQR: interquartile range; LDH: lactate dehydrogenase; SD: standard deviation.
Age at diagnosis (years)52.2 ± 13.452.5 ± 13.952.0 ± 13.20.863
Age group0.684
  Below 4019 (18.1)8 (21.6)11 (16.2)
  40–6056 (53.3)20 (54.1)36 (52.9)
  Above 6030 (28.6)9 (24.3)21 (30.9)
Sex0.656
  Male57 (54.3)19 (51.4)38 (55.9)
  Female48 (45.7)18 (48.6)30 (44.1)
Cancer in first-degree family member(s)0.488
  No96 (91.4)35 (94.6)61 (89.7)
  Yes9 (8.6)2 (5.4)7 (10.3)
Diabetes mellitus0.178
  No80 (76.2)31 (83.8)49 (72.1)
  Yes25 (23.8)6 (16.2)19 (27.9)
Hypertension0.401
  No68 (64.8)22 (59.5)46 (67.6)
  Yes37 (35.2)15 (40.5)22 (32.4)
Cardiac disease0.533
  No93 (88.6)34 (91.9)59 (86.8)
  Yes12 (11.4)3 (8.1)9 (13.2)
Hepatitis B1.000
  No94 (89.5)33 (89.2)61 (89.7)
  Yes11 (10.5)4 (10.8)7 (10.3)
Hepatitis C-
  No105 (100.0)37 (100.0)68 (100.0)
  Yes0 (0.0)0 (0.0)0 (0.0)
Chronic kidney disease0.299
  No82 (78.1)31 (83.8)51 (75.0)
  Yes23 (21.9)6 (16.2)17 (25.0)
Chronic obstructive pulmonary disease0.539
  No103 (98.1)37 (100.0)66 (97.1)
  Yes2 (1.9)0 (0.0)2 (2.9)
Human immunodeficiency virus infection1.000
  No104 (99.0)37 (100.0)67 (98.5)
  Yes1 (1.0)0 (0.0)1 (1.5)
Number of comorbidities0.110
  0–1 comorbidity72 (68.6)29 (78.4)43 (63.2)
  Multiple comorbidities (> 1)33 (31.4)8 (21.6)25 (36.8)
BMI (kg/m2)21.8 (19.3–26.0)21.2 (18.8–26.1)21.9 (19.7–26.1)0.415
BMI category0.894
  Underweight (< 18.5)22 (21.0)9 (24.3)13 (19.1)
  Normoweight (18.5–22.9)38 (36.2)13 (35.1)25 (36.8)
  Overweight (23.0–24.9)13 (12.4)5 (13.5)8 (11.8)
  Obese (≥ 25.0)32 (30.5)10 (27.0)22 (32.4)
ECOG performance status0.216
  014 (13.3)4 (10.8)10 (14.7)
  161 (58.1)25 (67.6)36 (52.9)
  227 (25.7)6 (16.2)21 (30.9)
  33 (2.9)2 (5.4)1 (1.5)
  40 (0.0)0 (0.0)0 (0.0)
Ann Arbor stage at diagnosis0.241
  I12 (11.4)6 (16.2)6 (8.8)
  II30 (28.6)13 (35.1)17 (25.0)
  III32 (30.5)11 (29.7)21 (30.9)
  IV31 (29.5)7 (18.9)24 (35.3)


↓  Table 2. Baseline Hematological and Inflammatory Profile According to LDH Category
 
VariableOverall cohort (n = 105)Normal LDH ≤ 250 U/L (n = 37)High LDH > 250 U/L (n = 68)P value
LDH groups were defined using the institutional upper limit of normal: normal LDH ≤ 250 U/L and high LDH > 250 U/L. Continuous variables are presented as mean ± SD or median (IQR), depending on data distribution. Categorical variables are presented as number (percentage). Between-group P values are descriptive. P value for LDH itself is not shown because LDH was used as the grouping variable. ALC: absolute lymphocyte count; ANC: absolute neutrophil count; LMR: lymphocyte-to-monocyte ratio; IQR: interquartile range; LDH: lactate dehydrogenase; NLR: neutrophil-to-lymphocyte ratio; PLR: platelet-to-lymphocyte ratio; SD: standard deviation.
Hemoglobin level (g/dL)12.0 ± 2.412.1 ± 2.111.9 ± 2.50.737
Anemia0.317
  Not anemic47 (44.8)19 (51.4)28 (41.2)
  Anemic (male < 13; female < 12)58 (55.2)18 (48.6)40 (58.8)
Leukocyte count (× 103/µL)8.9 (5.8–11.6)8.5 (4.9–10.6)9.1 (6.4–11.9)0.125
ANC (× 103/µL)5.8 (3.7–8.8)5.3 (3.0–7.8)6.1 (3.9–9.5)0.073
ANC category0.204
  Low (< 1.5)6 (5.7)3 (8.1)3 (4.4)
  Normal (1.5–7.0)59 (56.2)24 (64.9)35 (51.5)
  High (> 7.0)40 (38.1)10 (27.0)30 (44.1)
ALC (× 103/µL)1.6 ± 0.81.7 ± 0.91.5 ± 0.80.343
ALC category0.939
  Low (< 1.0)26 (24.8)9 (24.3)17 (25.0)
  Normal (≥ 1.0–4.8)79 (75.2)28 (75.7)51 (75.0)
NLR3.6 (2.2–7.0)2.9 (2.0–5.9)4.1 (2.5–7.6)0.042
NLR category0.013
  ≤ 340 (38.1)20 (54.1)20 (29.4)
  > 365 (61.9)17 (45.9)48 (70.6)
LMR2.2 (1.4–3.4)2.3 (1.6–3.8)2.1 (1.4–3.3)0.294
LMR category0.555
  Low (< 2.5)58 (55.2)19 (51.4)39 (57.4)
  High (≥ 2.5)47 (44.8)18 (48.6)29 (42.6)
PLR205.3 (146.5–334.3)186.3 (126.1–281.0)231.1 (148.5–351.4)0.216
PLR category0.601
  Normal (≤ 150)28 (26.7)11 (29.7)17 (25.0)
  High (> 150)77 (73.3)26 (70.3)51 (75.0)
Platelet count (× 103/µL)325.0 ± 123.5321.5 ± 110.1326.9 ± 131.00.822
Platelet category0.497
  Thrombocytopenia (< 150)6 (5.7)1 (2.7)5 (7.4)
  Normal (150–450)82 (78.1)31 (83.8)51 (75.0)
  Thrombocytosis (> 450)17 (16.2)5 (13.5)12 (17.6)


↓  Table 3. Treatment Response
 
Treatment responseEarly treatment failure (n = 54)Stays on remissionc (n = 51)
Primary refractory diseasea (n = 45)Early relapseb (n = 9)
aPrimary refractory disease was defined as: (1) stable disease or progressive disease occurring during first-line chemoimmunotherapy or by EOT, or (2) partial response as the best response at EOT. bEarly relapse was defined as relapse occurring within ≤ 12 months after achieving CR at EOT. cPatients classified as “stays on remission” achieved CR and had no evidence of relapse during follow-up. Patients without a failure event were administratively censored at 12 months. Data are presented as n (%) for categorical variables. CR: complete response; EOT: end of treatment; PD: progressive disease; PR: partial response; SD: stable disease.
CR-9 (100)51 (100)
PR22 (48.8)--
SD6 (13.4)--
PD17 (37.8)--


↓  Table 4. Univariate Analysis
 
VariableOutcomeOR (95% CI)P value
Stay on remissionEarly treatment failure (refractory and early relapse)
*Statistically significant. ALC: absolute lymphocyte count; ANC: absolute neutrophil count; BMI: body mass index; CI: confidence interval; CKD: chronic kidney disease; COPD: chronic obstructive pulmonary disease; ECOG: Eastern Cooperative Oncology Group; HIV: human immunodeficiency virus; LDH: lactate dehydrogenase; LMR: lymphocyte to monocyte ratio; NLR: neutrophil to lymphocyte ratio; OR: odds ratio; PLR: platelet to lymphocyte ratio.
Age (years)
  ≤ 6036 (48.0)39 (52.0)RefRef
  > 6015 (50.0)15 (50.0)0.923 (0.396–2.153)0.853
Sex
  Male28 (49.1)29 (50.9)RefRef
  Female23 (47.9)25 (52.1)1.049 (0.487–2.263)0.902
Cancer history in first-degree family
  No45 (46.9)51 (53.1)RefRef
  Yes6 (66.7)3 (33.3)0.441 (0.104–1.867)0.266
Diabetes mellitus
  No40 (50.0)40 (50.0)RefRef
  Yes11 (44.0)14 (56.0)1.273 (0.516–3.140)0.601
Hypertension
  No30 (44.1)38 (55.9)RefRef
  Yes21 (56.8)16 (43.2)0.602 (0.268–1.349)0.217
Heart disease
  No45 (48.4)48 (51.6)RefRef
  Yes6 (50.0)6 (50.0)0.938 (0.282–3.120)0.916
Hepatitis B
  No48 (51.1)46 (48.9)RefRef
  Yes3 (27.3)8 (72.7)2.783 (0.695–11.140)0.148
CKD
  No41 (50.0)41 (50.0)RefRef
  Yes10 (43.5)13 (56.5)1.300 (0.512–3.299)0.581
Comorbidity
  0–1 comorbidity34 (47.2)38 (52.8)RefRef
  Multiple comorbidities (> 1)17 (51.5)16 (48.5)0.842 (0.369–1.921)0.683
BMI (kg/m2)
  Underweight (<18.5)8 (36.4)14 (63.6)RefRef
  Not underweight (≥18.5)43 (51.8)40 (48.2)0.532 (0.202–1.402)0.201
ECOG score
  Favorable ECOG (0–1)42 (56.0)33 (44.0)RefRef
  Unfavorable ECOG (2–4)9 (30.0)21 (70.0)2.970 (1.202–7.335)0.018*
Stage at diagnosis
  Limited-stage (I–II)26 (61.9)16 (38.1)RefRef
  Advanced-stage (III–IV)25 (39.7)38 (60.3)2.470 (1.108–5.506)0.027*
Hemoglobin level (g/dL)
  Not anemic28 (59.6)19 (40.4)RefRef
  Anemic (male < 13; female < 12)23 (39.7)35 (60.3)2.243 (1.023–4.916)0.044*
ANC
  Low–normal (≤ 7)35 (53.8)30 (46.2)RefRef
  High (> 7)16 (40.0)24 (60.0)1.750 (0.787–3.890)0.170
ALC
  Low (< 1)10 (38.5)16 (61.5)RefRef
  Normal (≥ 1–4.8)41 (51.9)38 (48.1)0.579 (0.234–1.432)0.237
NLR
  ≤ 322 (55.0)18 (45.0)RefRef
  > 329 (44.6)36 (55.4)1.517 (0.687–3.350)0.302
LMR
  Low (< 2.5)25 (43.1)33 (56.9)RefRef
  High (≥ 2.5)26 (55.3)21 (44.7)0.612 (0.282–1.328)0.214
PLR
  Normal (≤ 150)13 (46.4)15 (53.6)RefRef
  High (> 150)38 (49.4)39 (50.6)0.889 (0.374–2.116)0.791
Platelet count
  Low to normal (≤ 450)43 (48.9)45 (51.1)RefRef
  Thrombocytosis (> 450)8 (47.1)9 (52.9)1.075 (0.380–3.042)0.892
LDH
  Normal (≤ 250)24 (64.9)13 (35.1)RefRef
  High (> 250)27 (39.7)41 (60.3)2.803 (1.220–6.439)0.015*


↓  Table 5. Multivariable Logistic Regression Analysis of All Prespecified Predictors for Early Treatment Failure
 
VariableAdjusted OR (95% CI)P value
*Statistically significant. Adjusted odds ratios were derived from a prespecified multivariable logistic regression model including age > 60 years, ECOG performance status, Ann Arbor stage, anemia, and LDH category. CI: confidence interval; ECOG: Eastern Cooperative Oncology Group; LDH: lactate dehydrogenase; OR: odds ratio.
Unfavorable ECOG (vs. 0–1)2.228 (0.846–5.869)0.105
Advanced stage III–IV (vs. I–II)1.843 (0.782–4.341)0.162
Anemia (vs. not anemia)1.611 (0.684–3.797)0.276
High LDH (vs. normal)2.412 (1.006–5.785)0.048*
Age > 60 (vs. ≤ 60)0.888 (0.357–2.209)0.799