Figures
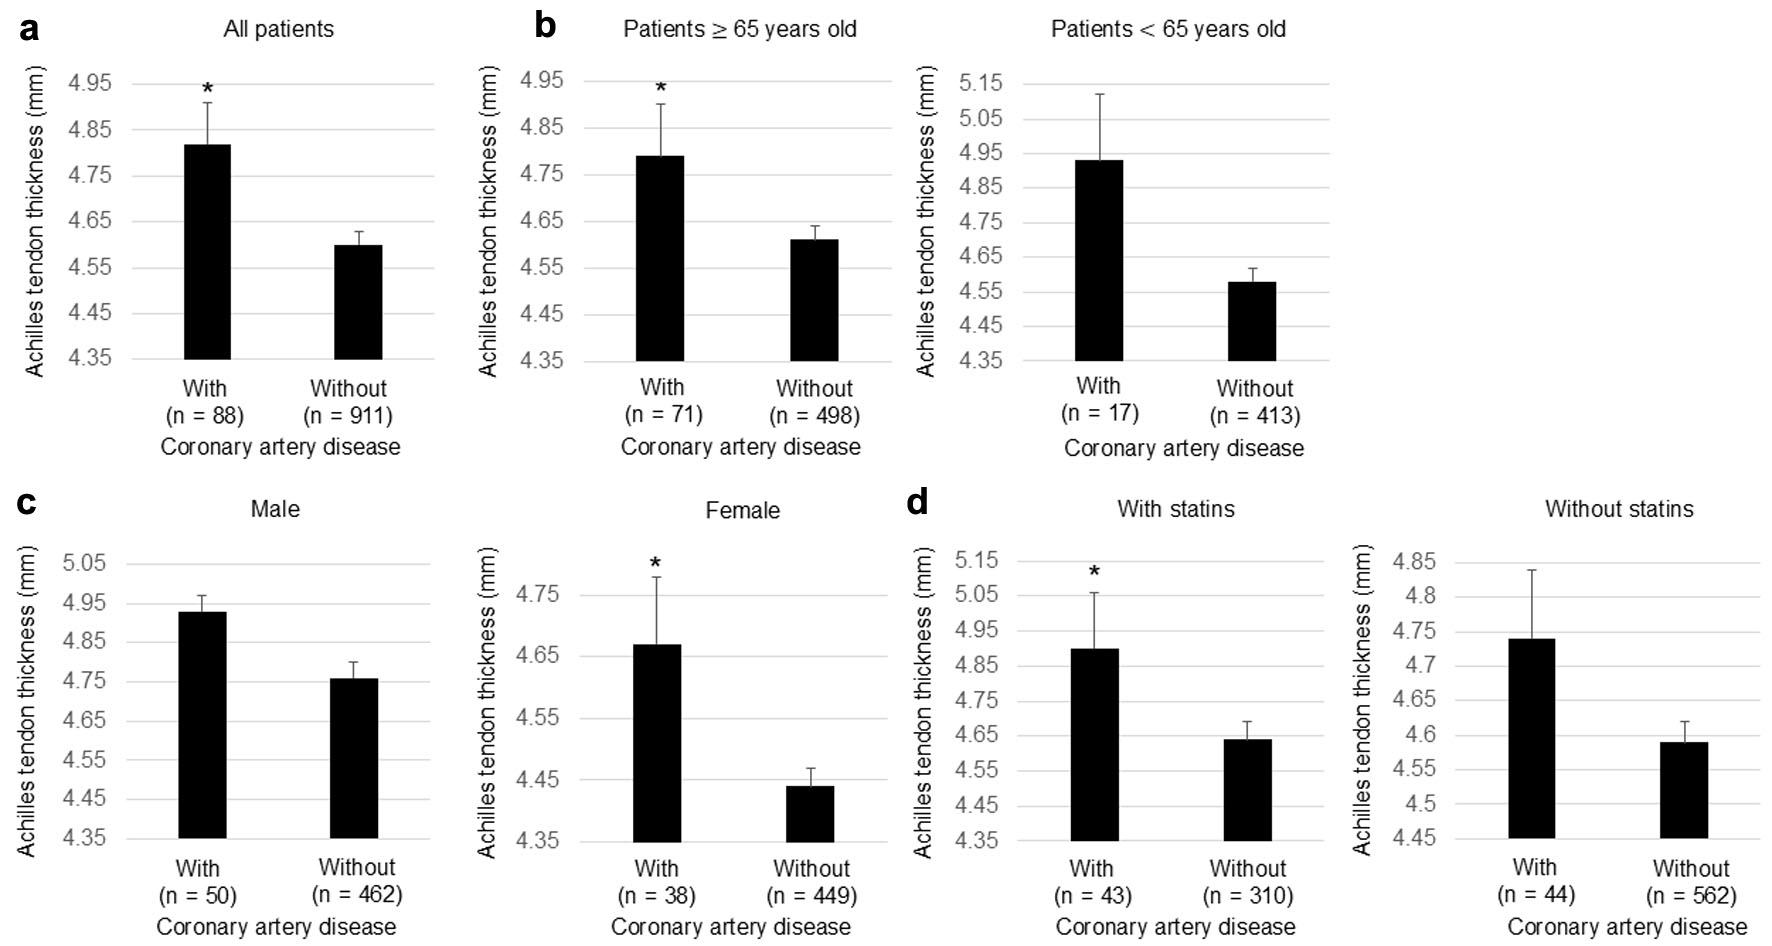
↓ Figure 1. Achilles tendon thickness in patients with and without coronary artery disease in all patients (a), in patients ≥ 65 years old and patients < 65 years old (b), in male and female patients (c), and in patients treated with statins and patients untreated with statins (d). Error bars indicate mean ± SE. *P < 0.01 vs. patients without coronary artery disease. SE: standard error.
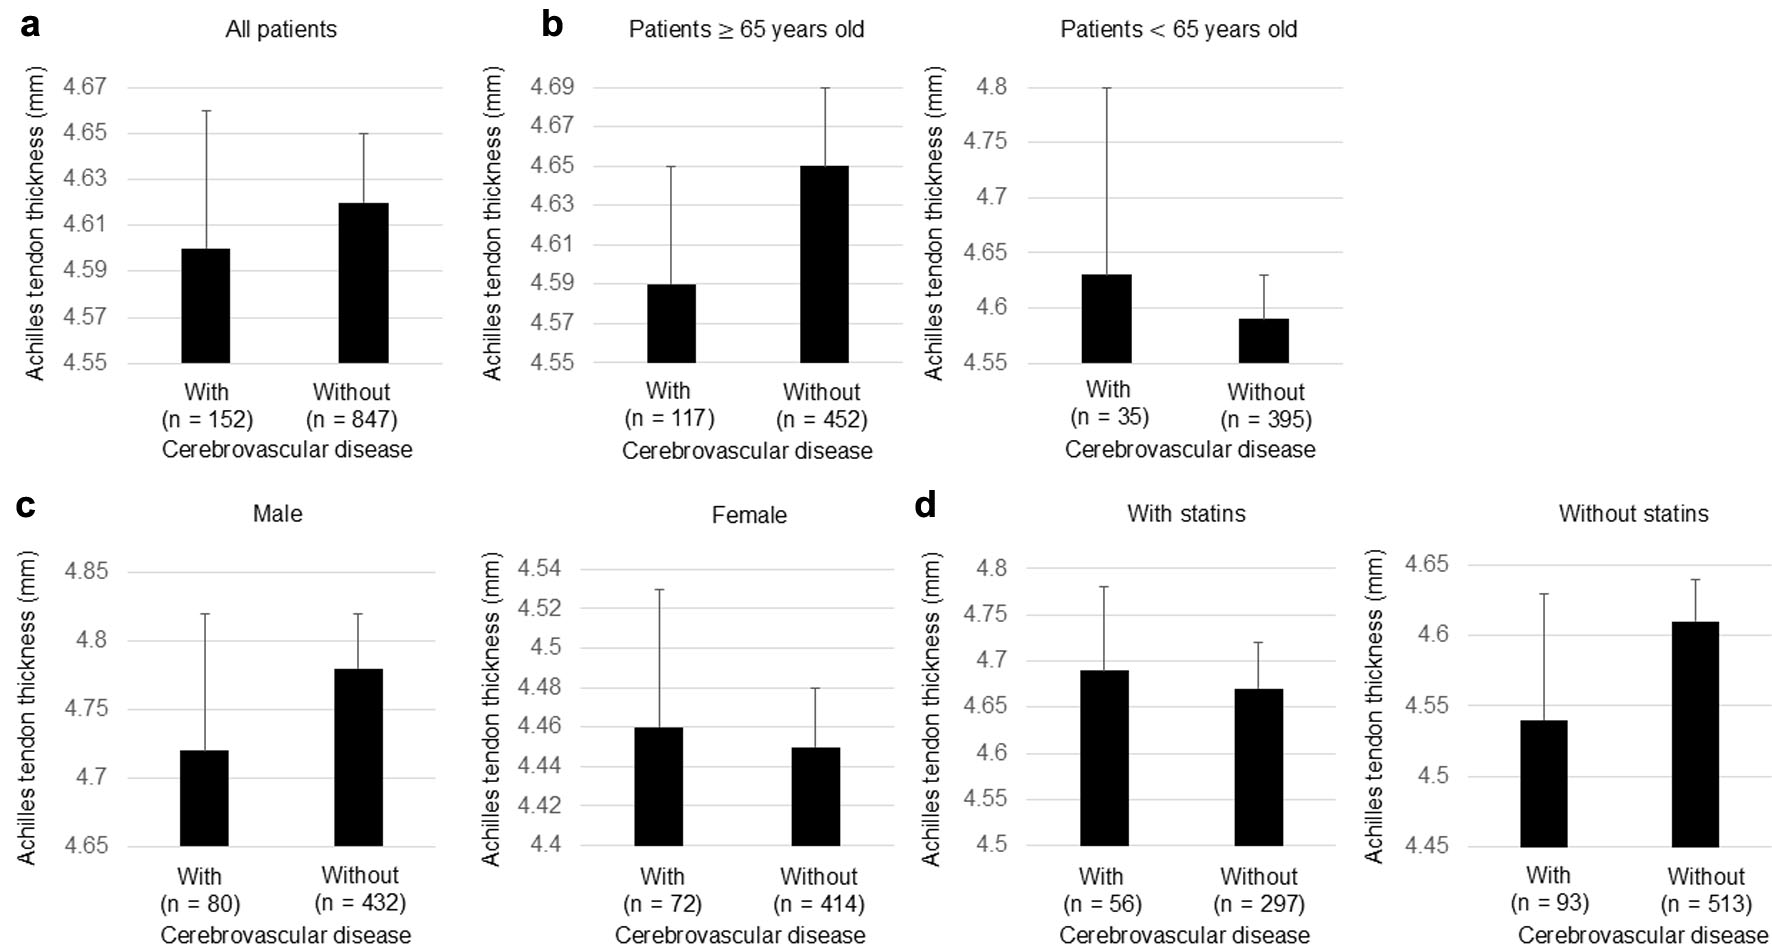
↓ Figure 2. Achilles tendon thickness in patients with and without cerebrovascular disease in all patients (a), in patients ≥ 65 years old and patients < 65 years old (b), in male and female patients (c), and in patients treated with statins and patients untreated with statins (d). Error bars indicate mean ± SE. SE: standard error.
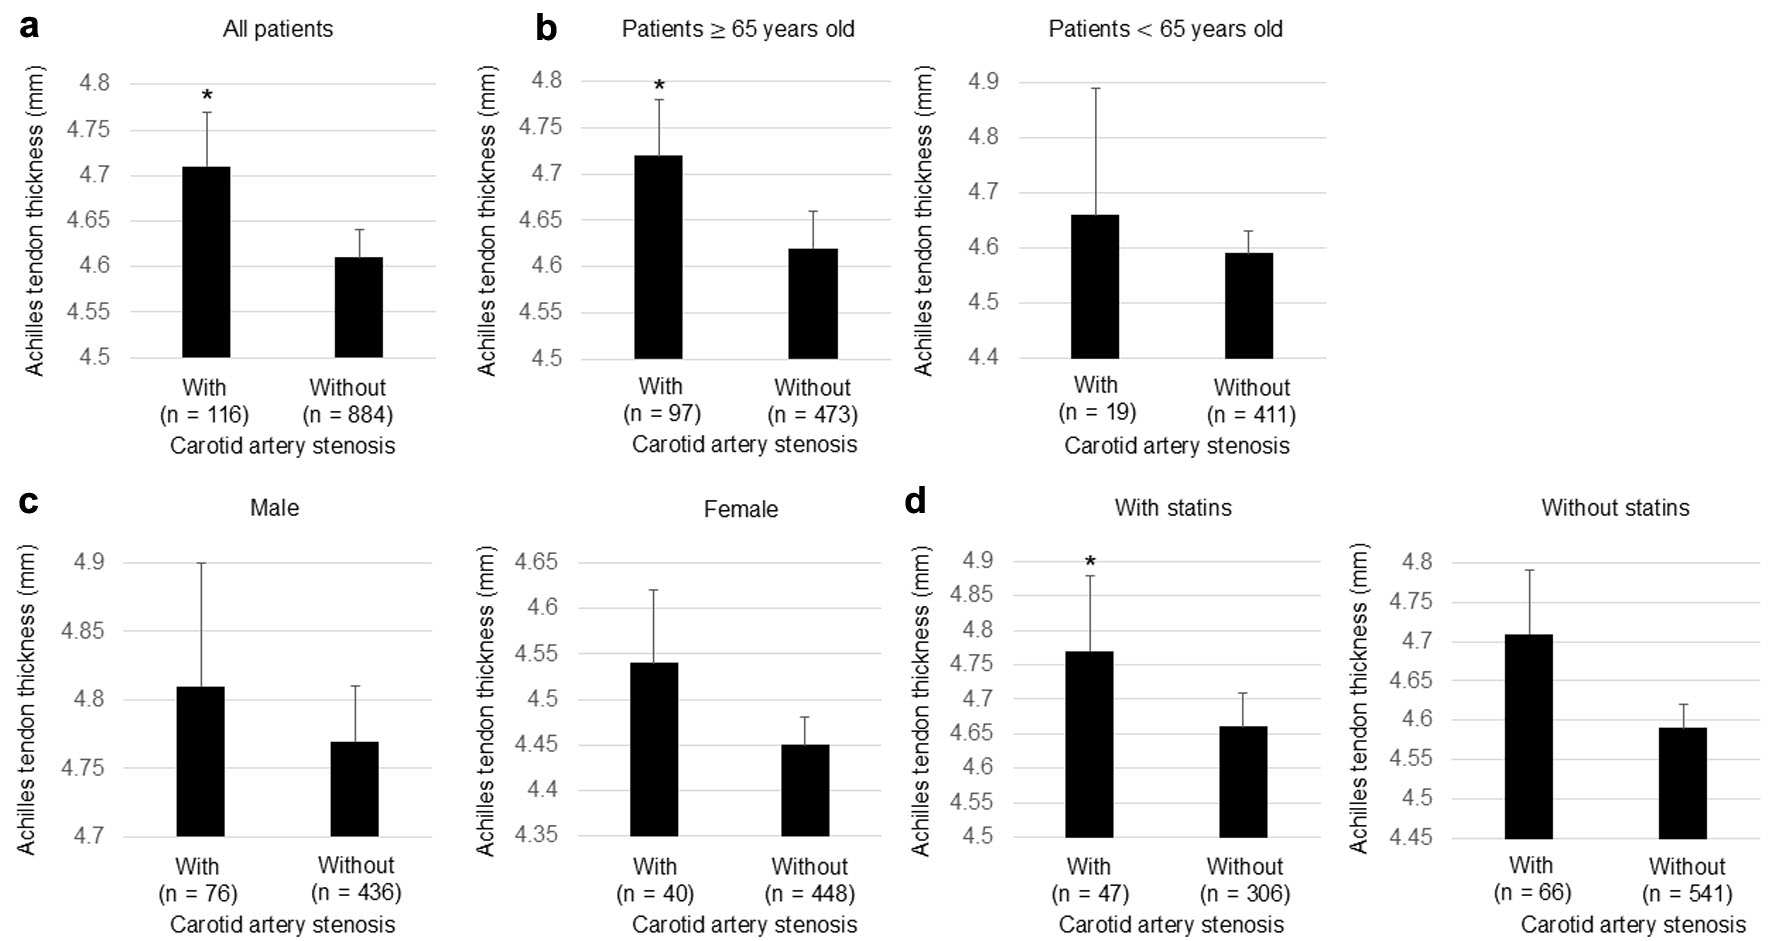
↓ Figure 3. Achilles tendon thickness in patients with and without carotid artery stenosis in all patients (a), in patients ≥ 65 years old and patients < 65 years old (b), in male and female patients (c), and in patients treated with statins and patients untreated with statins (d). Error bars indicate mean ± SE. *P < 0.01 vs. patients without carotid artery stenosis. SE: standard error.
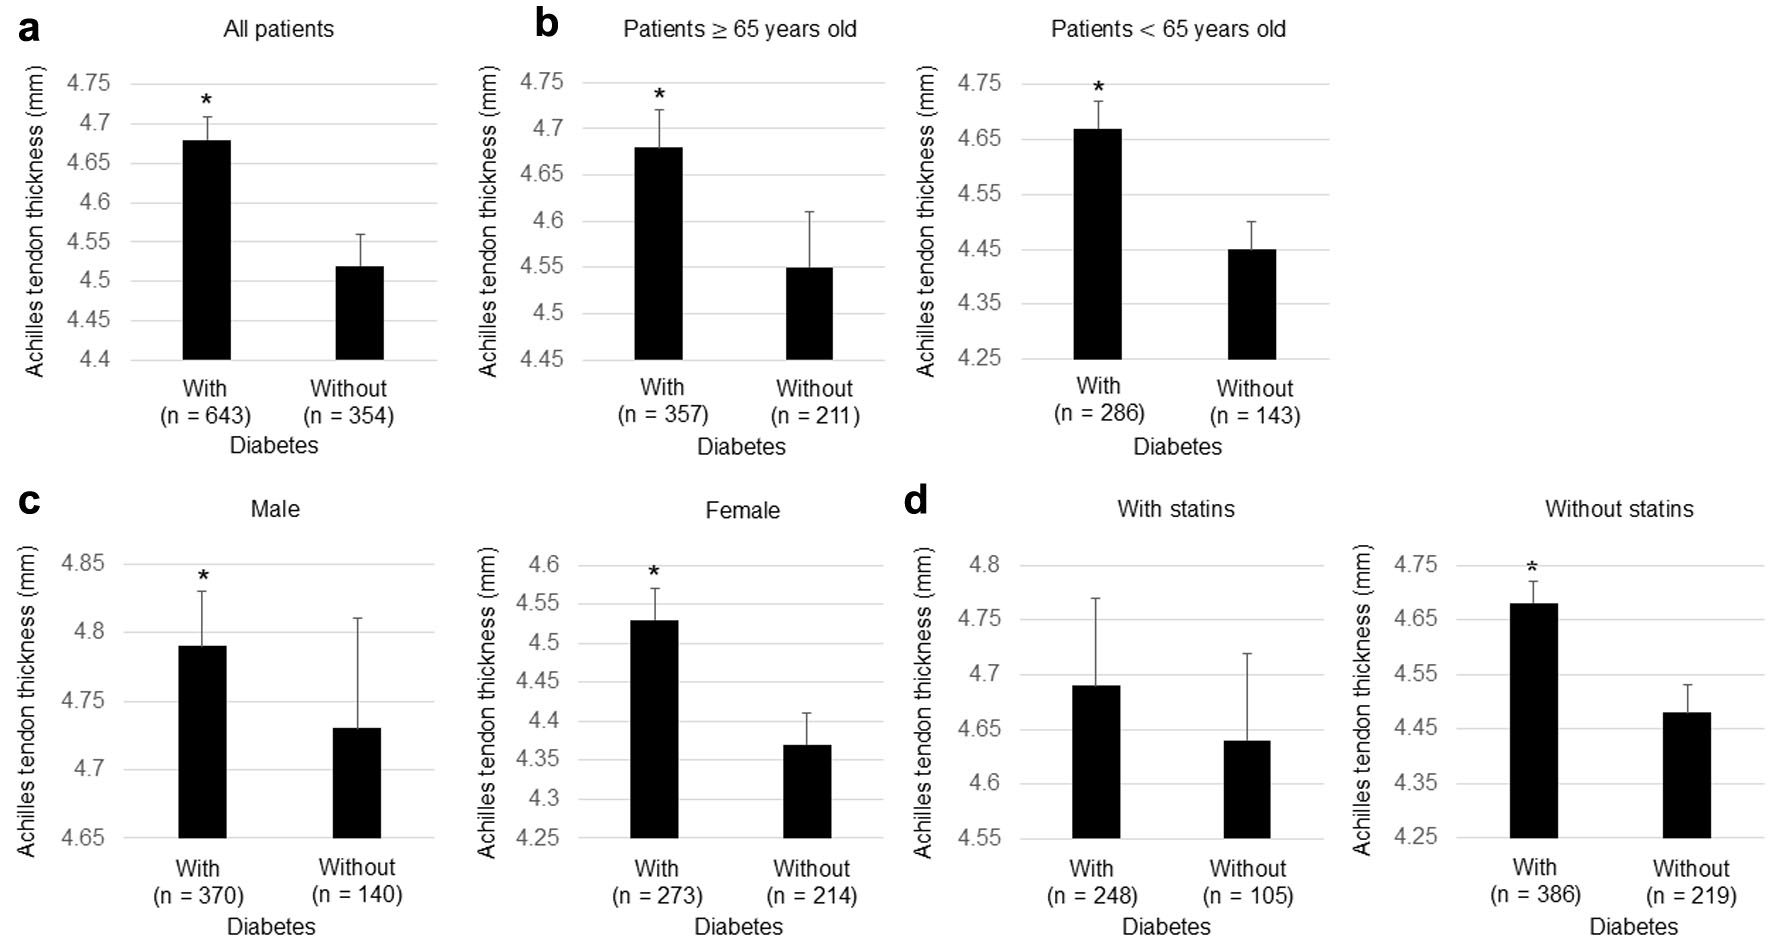
↓ Figure 4. Achilles tendon thickness in patients with and without diabetes in all patients (a), in patients ≥ 65 years old and patients < 65 years old (b), in male and female patients (c), and in patients treated with statins and patients untreated with statins (d). Error bars indicate mean ± SE. *P < 0.01 vs. patients without diabetes. SE: standard error.
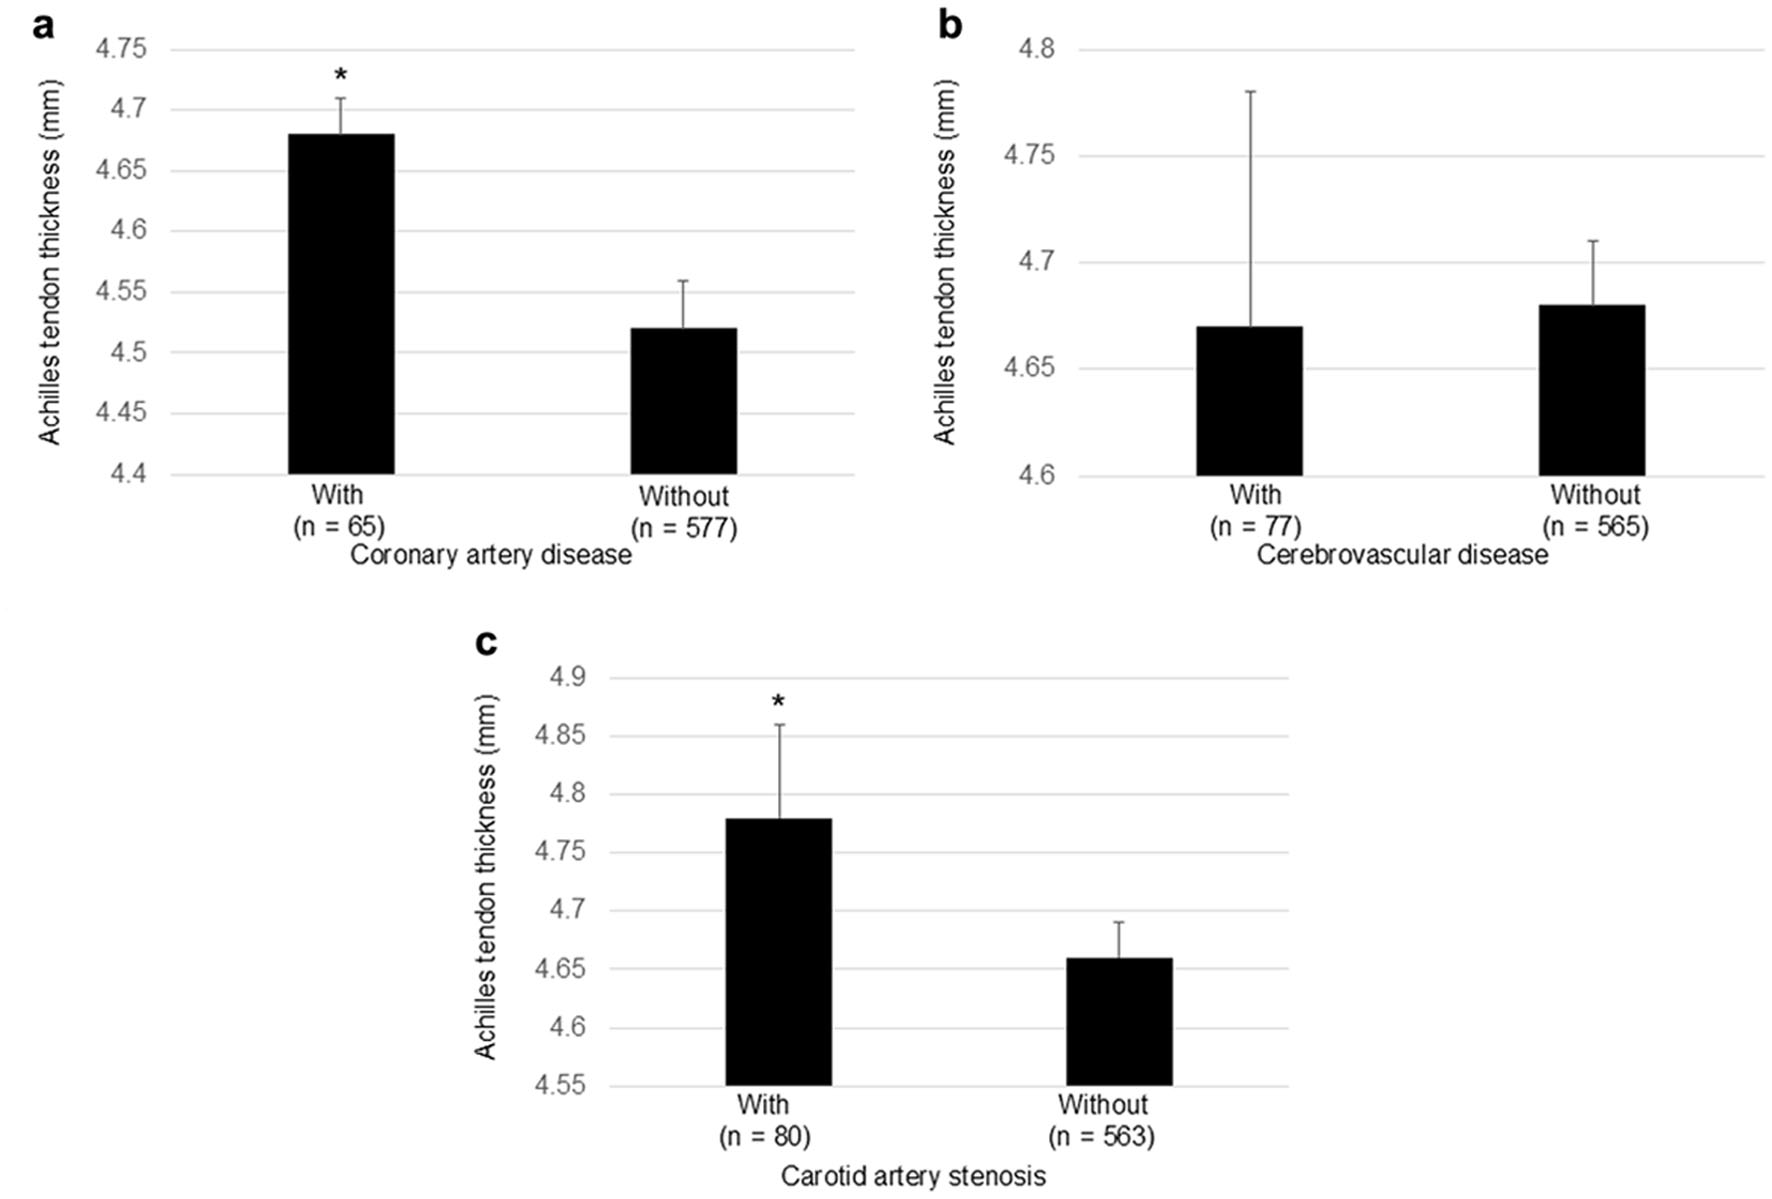
↓ Figure 5. Achilles tendon thickness in patients with and without coronary artery disease (a), cerebrovascular disease (b), and carotid artery stenosis (c) in patients with diabetes. Error bars indicate mean ± SE. *P < 0.01 vs. patients without coronary artery disease (a) and without carotid artery disease (c). SE: standard error.
Tables
↓ Table 1. Clinical Characteristics of the Studied Patients
| Clinical characteristics | |
|---|
| Values are expressed as mean ± SD. BMI: body mass index; SD: standard deviation. |
| Age (years) | 64 ± 14 |
| Gender (male/female) | 512/488 |
| Body height (cm) | 161 ± 10 |
| Body weight (kg) | 64 ± 16 |
| BMI (kg/m2) | 24.6 ± 4.9 |
| Systolic blood pressure (mm Hg) | 131 ± 20 |
| Diastolic blood pressure (mm Hg) | 77 ± 13 |
| Comorbidities | |
| Coronary artery disease (n, %) | 88/998, 8.8 |
| Cerebrovascular disease (n, %) | 152/998, 15.2 |
| Carotid artery stenosis (n, %) | 114/1,000, 11.4 |
| Diabetes (n, %) | 643/997, 64.0 |
↓ Table 2. Pharmacotherapies for Dyslipidemia, Hypertension, and Diabetes
| Pharmacotherapies | |
|---|
| α-GIs: α-glucosidase inhibitors; CCBs: calcium channel blockers; DPP4: dipeptidyl peptidase 4; GLP-1RAs: glucagon-like peptide 1 receptor agonists; MRAs: mineralocorticoid receptor antagonists; RAS: renin-angiotensin system; SGLT2: sodium-glucose co-transporter 2. |
| Anti-hyperlipidemic drugs | |
| Statins | 353 (37%) |
| Fibrates | 55 (6%) |
| Omega-3 fatty acids | 47 (5%) |
| Ezetimibe | 64 (7%) |
| Probucol | 1 (0.1%) |
| Anti-hypertensive drugs | |
| RAS inhibitors | 277 (29%) |
| CCBs | 302 (31%) |
| β-blockers | 73 (8%) |
| α-blockers | 14 (1%) |
| MRAs | 28 (3%) |
| Diuretics | 52 (5%) |
| Anti-diabetic drugs | |
| Biguanide | 217 (23%) |
| DPP4 inhibitors | 270 (28%) |
| SGLT2 inhibitors | 192 (20%) |
| GLP-1RAs | 59 (6%) |
| Thiazolidinediones | 66 (7%) |
| α-GIs | 48 (5%) |
| Insulin | 115 (12%) |
↓ Table 3. Ultrasonographic Measurements of the Carotid Artery and Achilles Tendon and Biochemical Data
| Ultrasonographic measurements | |
|---|
| Values are expressed as mean ± SD. HbA1c: hemoglobin A1c; HDL-C: high-density lipoprotein-cholesterol; IMT: intima-media thickness; LDL-C: low-density lipoprotein-cholesterol; SD: standard deviation. |
| Maximal IMT of carotid artery (mm) | 1.8 ± 1.0 |
| Achilles tendon thickness (mm) | 4.6 ± 0.8 |
| Biochemical data | |
| LDL-C (mg/dL) | 115 ± 39 |
| HDL-C (mg/dL) | 54 ± 17 |
| Triglyceride (mg/dL) | 145 ± 90 |
| Non-HDL-C | 142 ± 43 |
| Plasma glucose (mg/dL) | 167 ± 92 |
| HbA1c (%) | 8.2 ± 2.7 |
↓ Table 4. Correlations of Achilles Tendon Thickness With Carotid Artery IMT and Metabolic Parameters in All Patients (n = 1,000)
| Correlation coefficient | P values |
|---|
| Values are expressed as mean ± SD. BMI: body mass index; HbA1c: hemoglobin A1c; HDL-C: high-density lipoprotein-cholesterol; IMT: intima-media thickness; LDL-C: low-density lipoprotein-cholesterol; SD: standard deviation. |
| Maximal carotid IMT | 0.09 | 0.005 |
| Age | −0.001 | 0.983 |
| Body weight | 0.28 | < 0.001 |
| BMI | 0.18 | < 0.001 |
| Systolic blood pressure | 0.05 | 0.131 |
| Diastolic blood pressure | 0.06 | 0.084 |
| LDL-C | −0.05 | 0.206 |
| HDL-C | −0.18 | < 0.001 |
| Triglyceride | 0.06 | 0.066 |
| Non-HDL-C | −0.04 | 0.239 |
| Plasma glucose | 0.04 | 0.240 |
| HbA1c | 0.01 | 0.766 |
↓ Table 5. Correlations of Achilles Tendon Thickness With Carotid Artery IMT and Metabolic Parameters in Patients With Diabetes (n = 643)
| Correlation coefficient | P values |
|---|
| Values are expressed as mean ± SD. BMI: body mass index; HbA1c: hemoglobin A1c; HDL-C: high-density lipoprotein-cholesterol; IMT: intima-media thickness; LDL-C: low-density lipoprotein-cholesterol; SD: standard deviation. |
| Maximal carotid IMT | 0.12 | 0.002 |
| Age | 0.003 | 0.939 |
| Body weight | 0.26 | < 0.001 |
| BMI | 0.16 | < 0.001 |
| Systolic blood pressure | 0.06 | 0.120 |
| Diastolic blood pressure | 0.07 | 0.095 |
| LDL-C | 0.01 | 0.868 |
| HDL-C | −0.14 | < 0.001 |
| Triglyceride | 0.08 | 0.832 |
| Non-HDL-C | −0.04 | 0.282 |
| Plasma glucose | 0.02 | 0.651 |
| HbA1c | −0.06 | 0.170 |