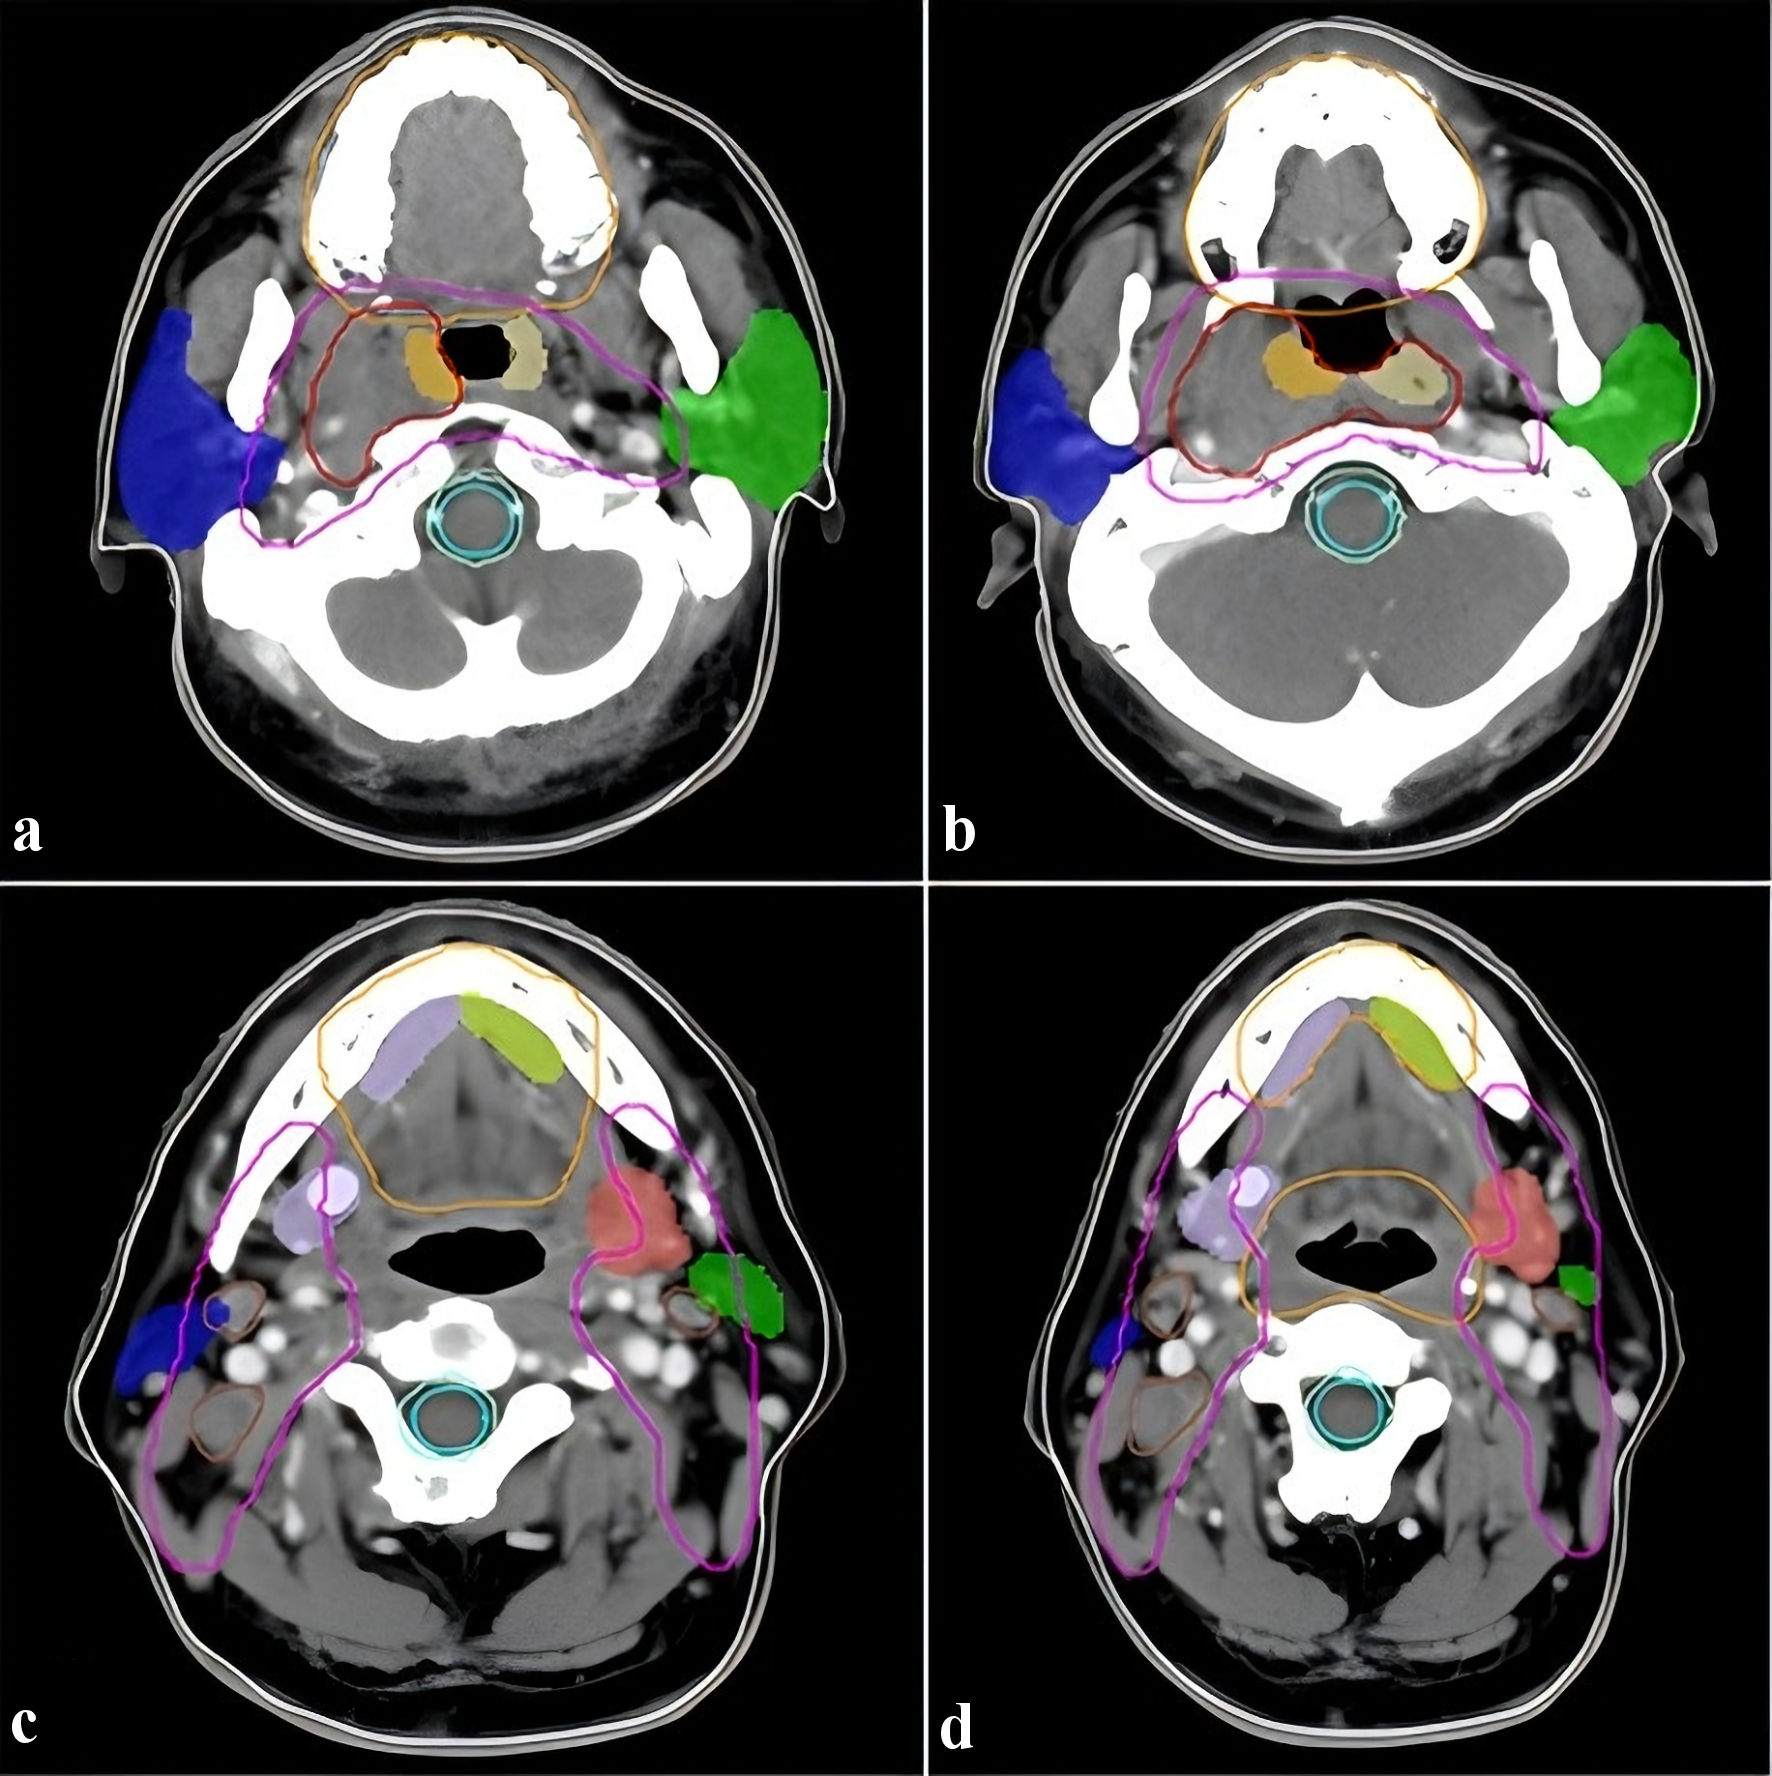
↓ Figure 1. Illustration of target volume and salivary glands (fixed four layers). Panels a–d display different anatomical structures of the head and neck across four fixed layers, with each panel presenting a different view of the tumor volume, target volumes, and key salivary glands. Red line: GTVnx; brown line: GTVnd; pink line: CTV1; orange line: oral cavity; blue and green blocks: parotid glands; bright red and bright blue blocks: submandibular glands; yellow and faint yellow blocks: tubarial glands. GTVnx: gross tumor volume of nasopharynx; GTVnd: gross tumor volume of lymph nodal; CTV1: clinical target volume 1.
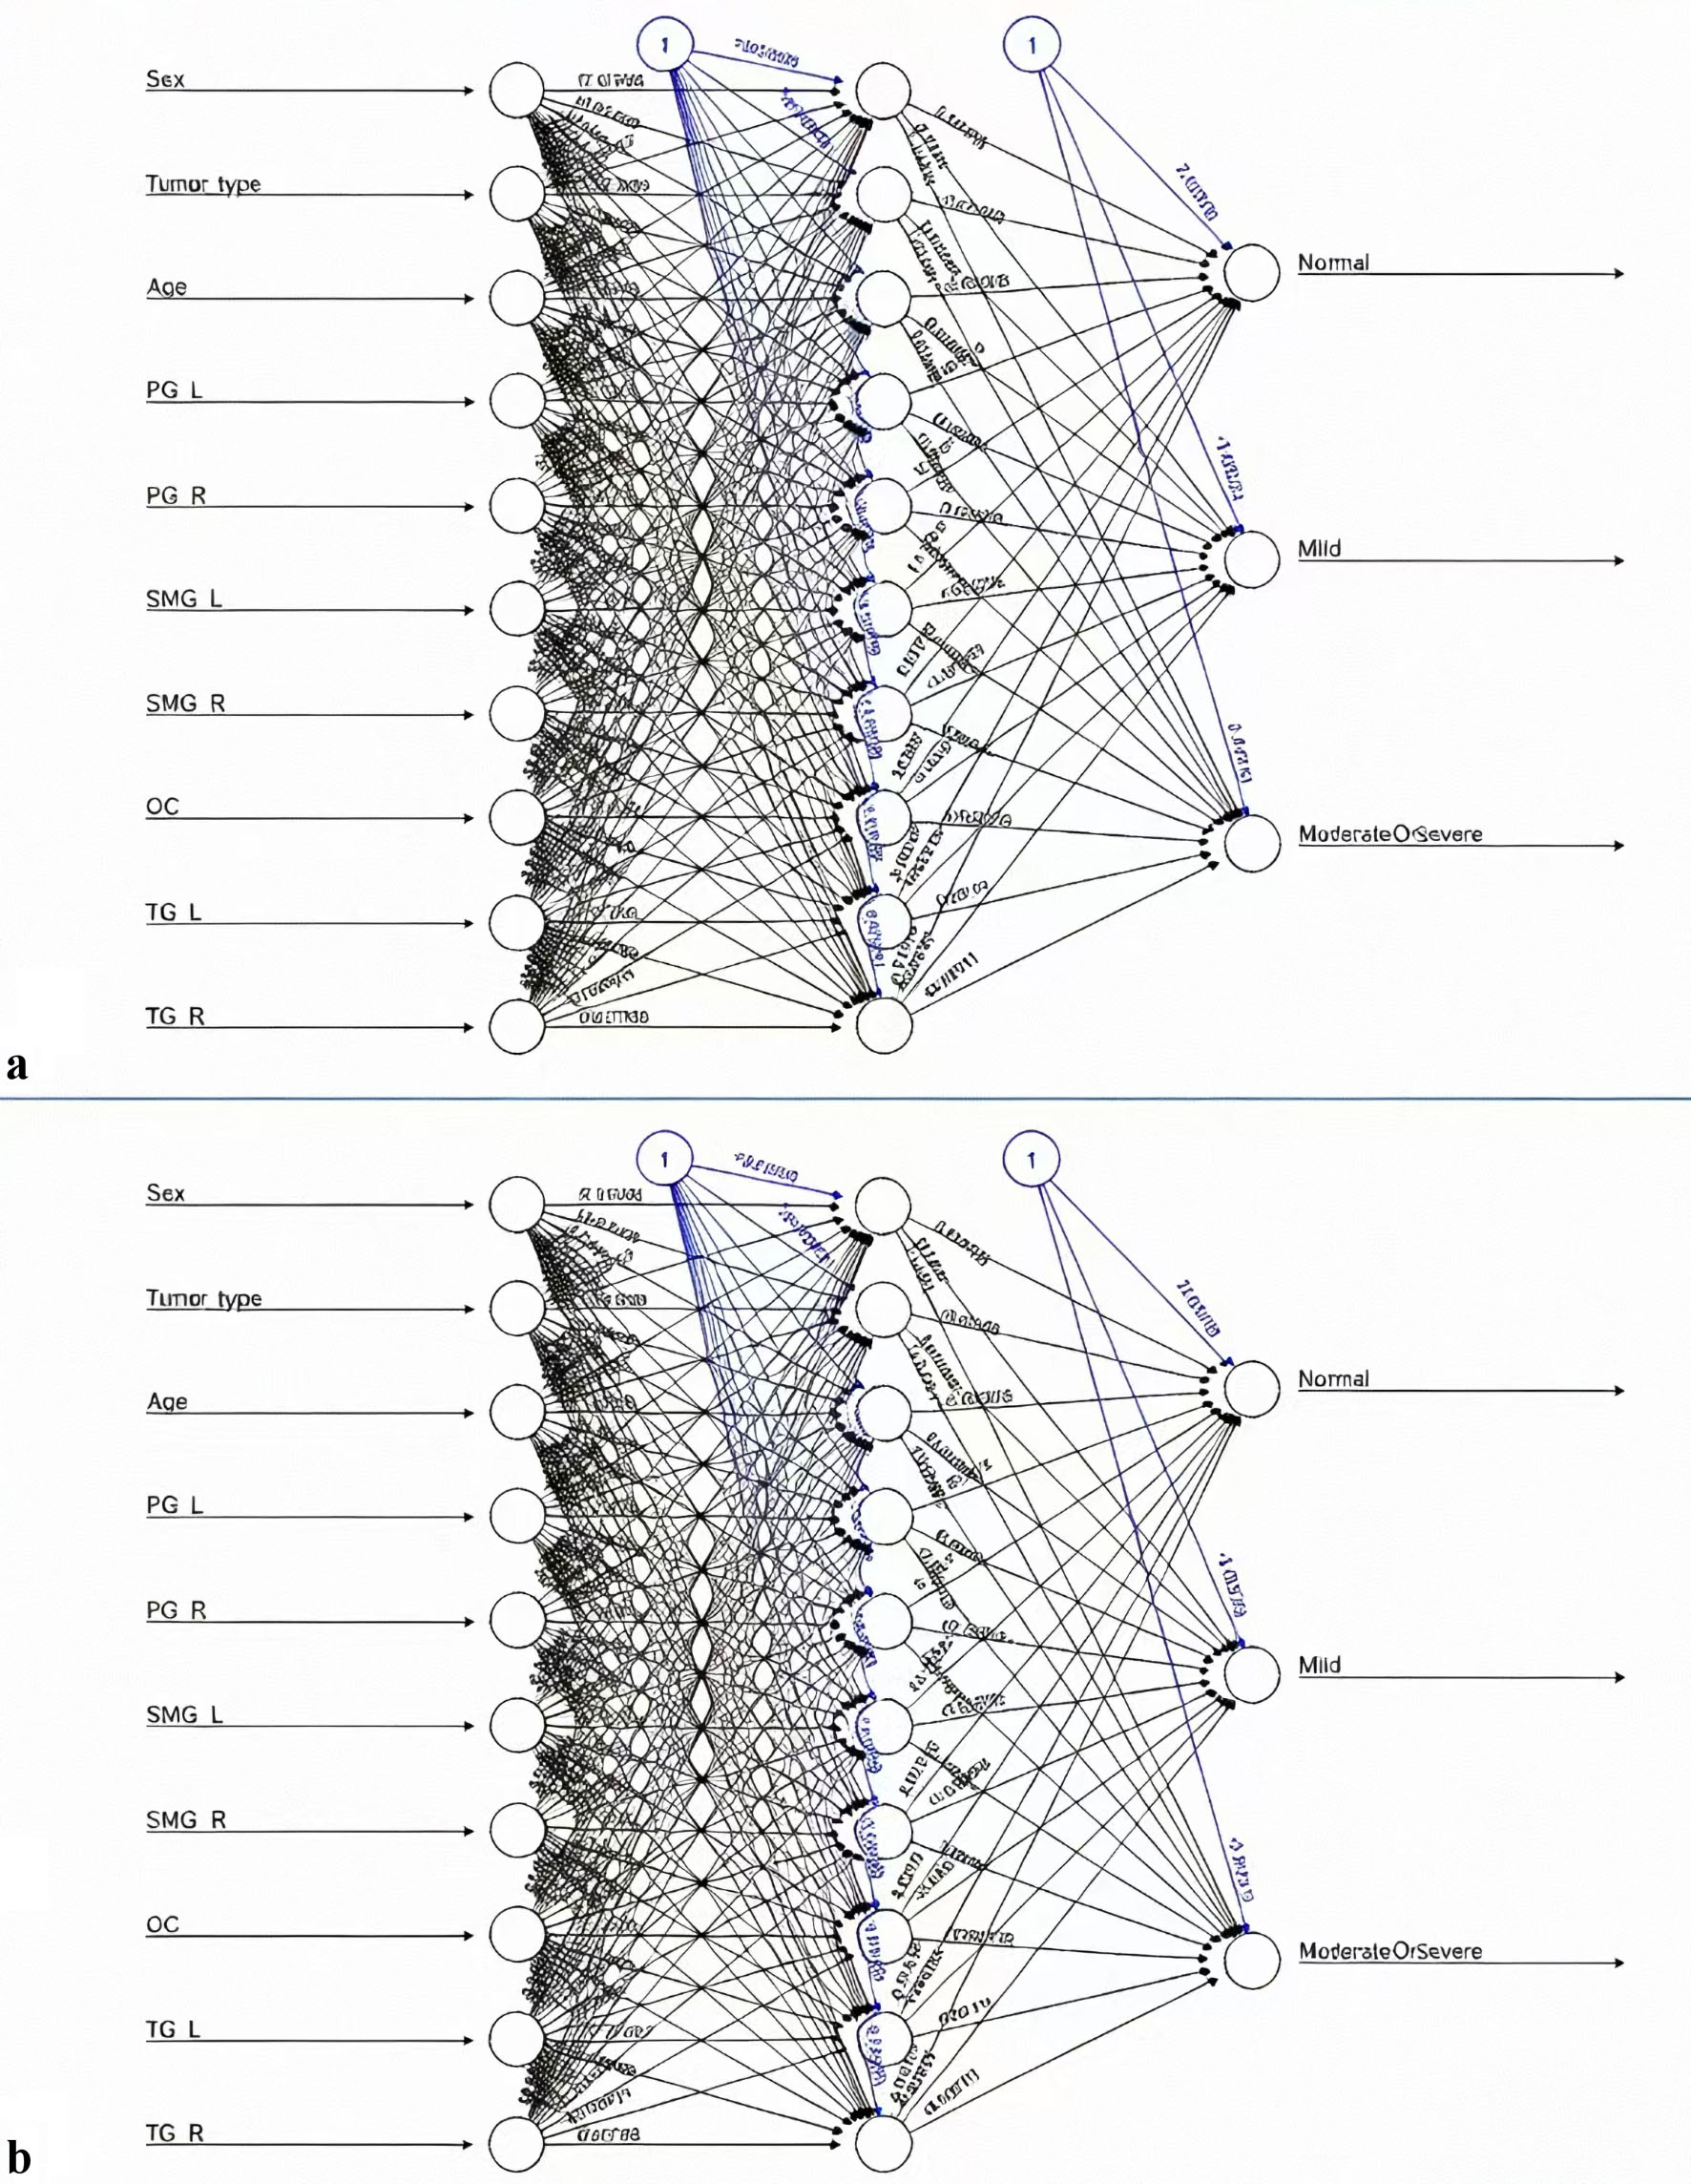
↓ Figure 2. Topology diagrams of the BPANN prediction models at (a) 1 year and (b) 2 years post-radiotherapy. The input layer consists of the selected predictors including age, gender, tumor type, and bilateral radiation doses of parotid, submandibular, oral cavity and tubarial glands; the middle hidden layers represent the multilayer neural network architecture capturing nonlinear interactions among variables; the output layer generates three categories of predicted xerostomia risk (no xerostomia, mild xerostomia, moderate/severe xerostomia).Model training metrics are listed as follows: (a) 1-year prediction model: error = 0.37836, training steps = 85,429; (b) 2-year prediction model: error = 0.175809, training steps = 187,816. BPANN: back propagation artificial neural network.
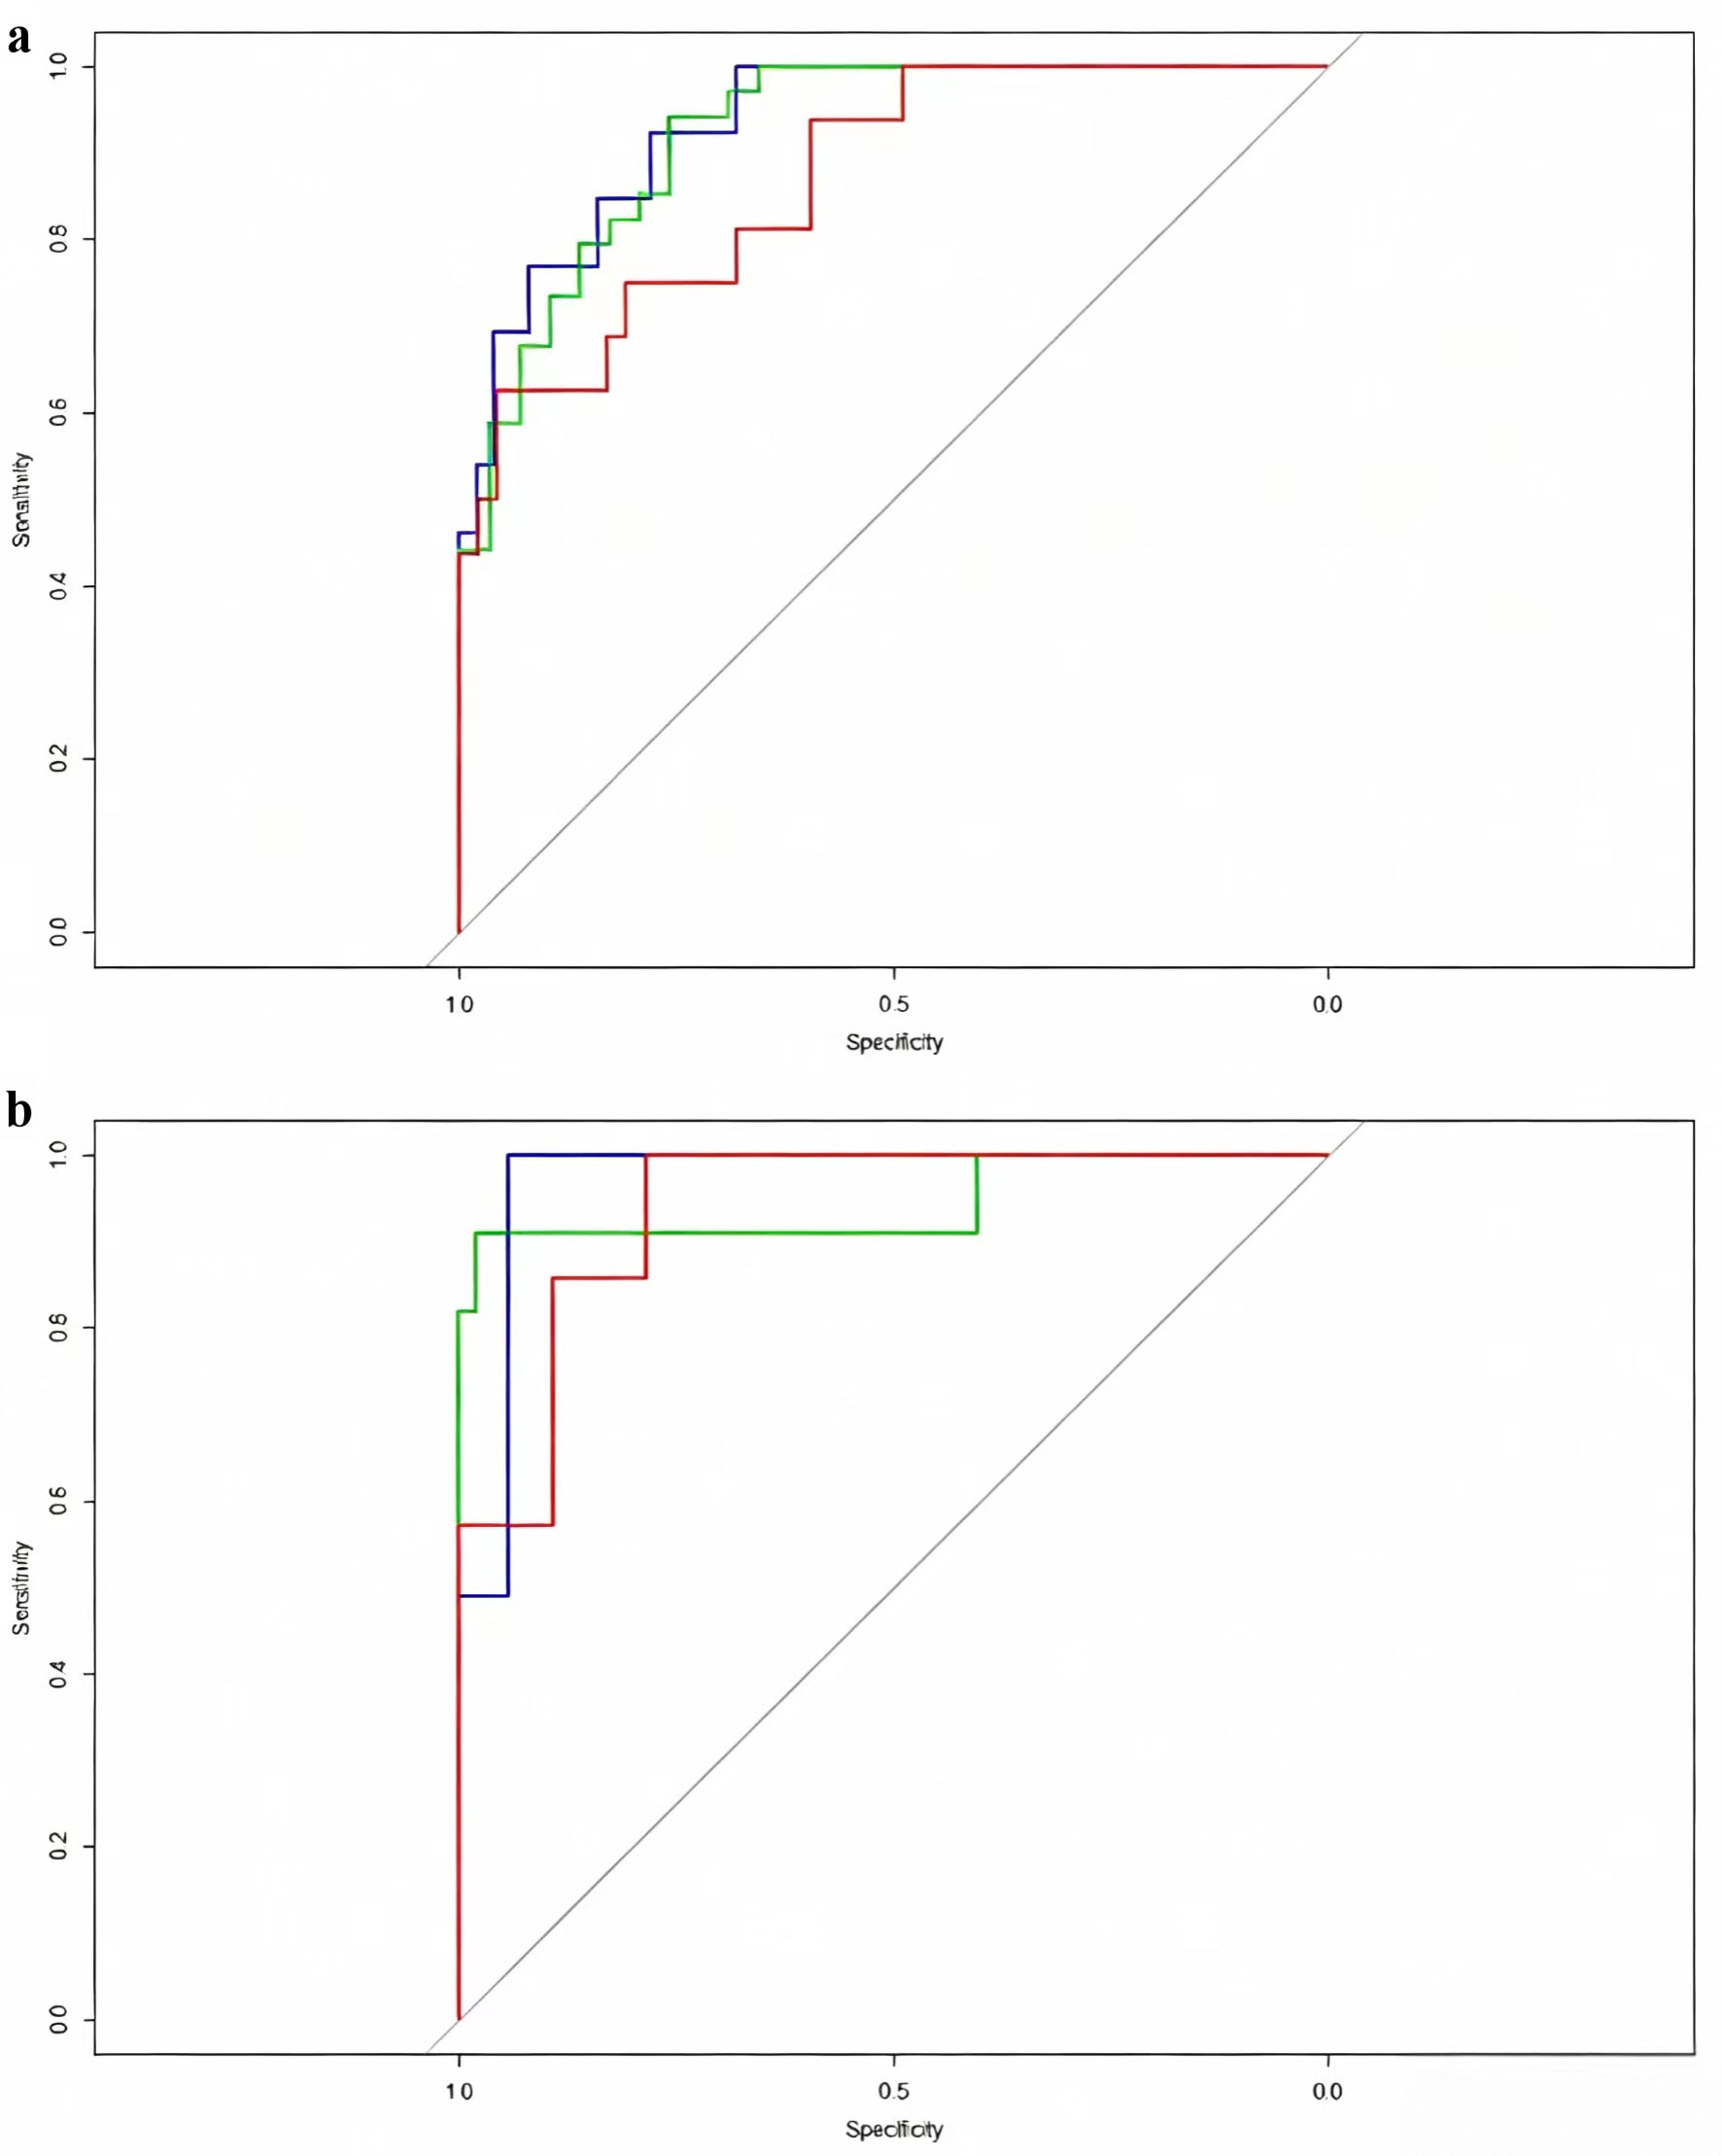
↓ Figure 3. ROC curves of the BPANN prediction models for xerostomia risk at (a) 1 year and (b) 2 years post-radiotherapy. Blue curves represent the discrimination performance for patients without xerostomia, green curves for mild xerostomia, and red curves for moderate/severe xerostomia, with corresponding AUC values marked on each curve. AUC results: (a) 1-year model: no xerostomia = 0.8835, mild xerostomia = 0.9474, moderate/severe xerostomia = 0.9650; (b) 2-year model: no xerostomia = 0.9417, mild xerostomia = 0.9000, moderate/severe xerostomia = 0.8901. BPANN: back propagation artificial neural network; ROC: receiver operating characteristic.