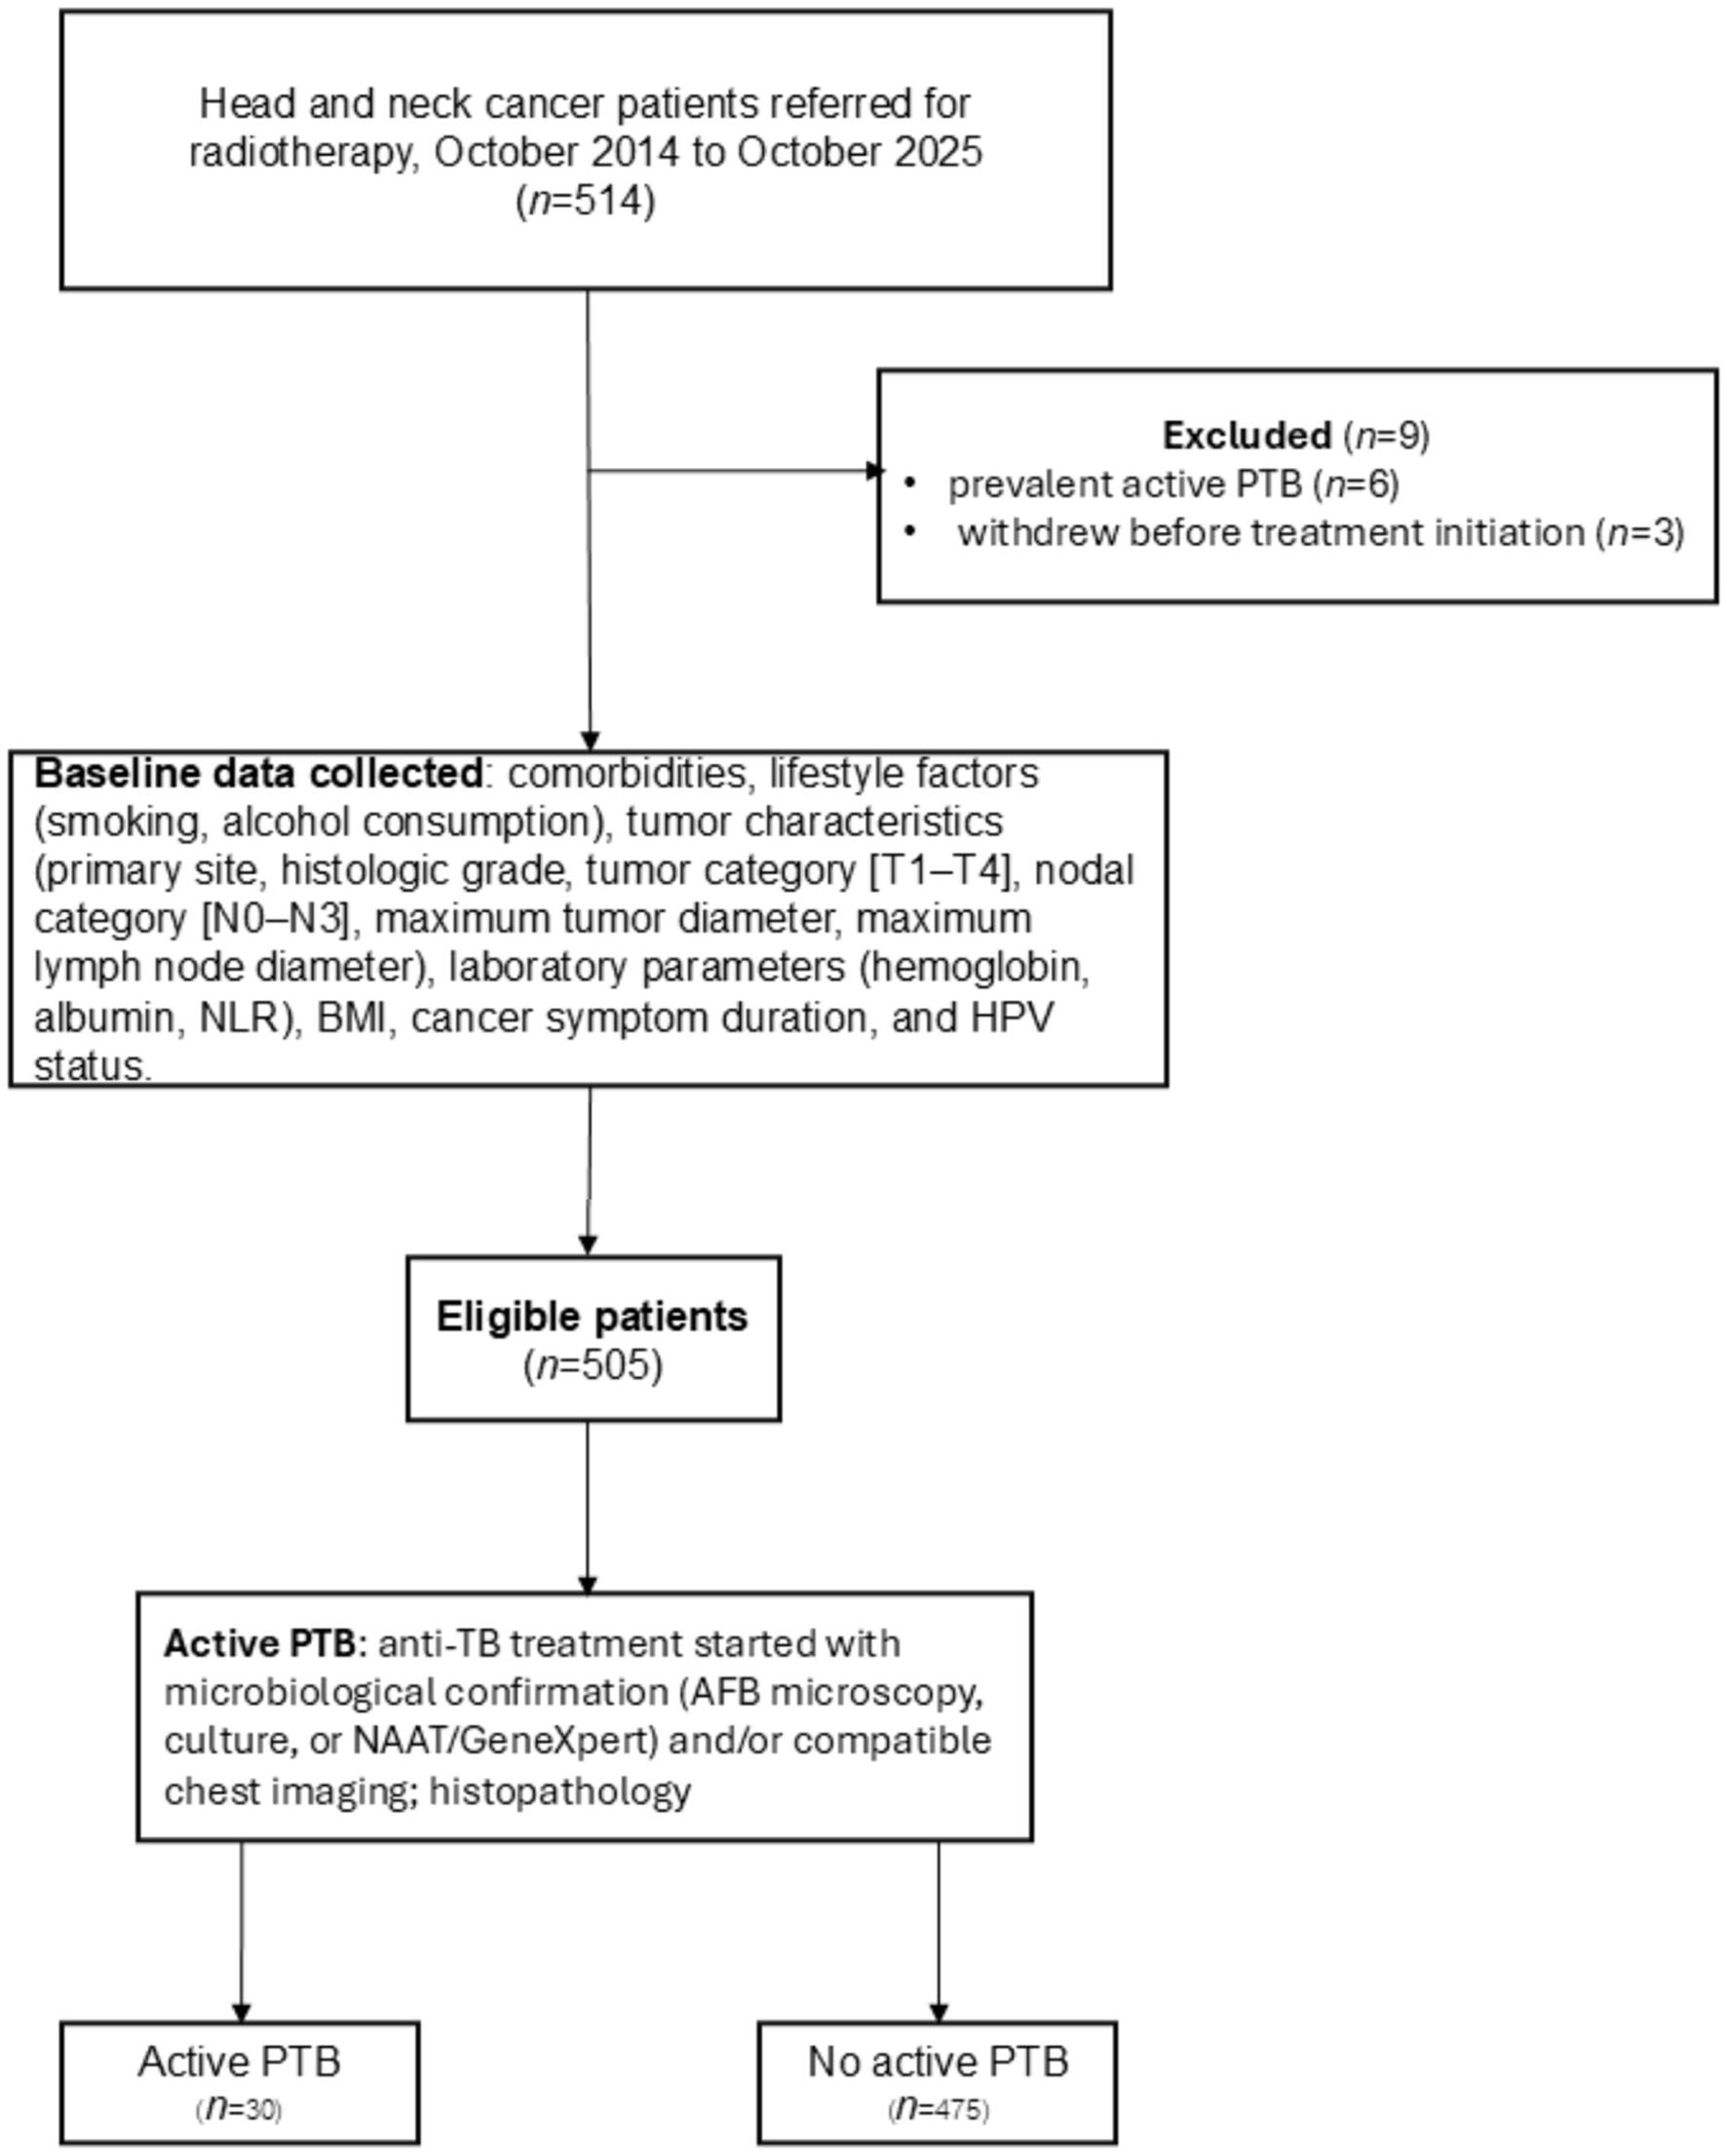
↓ Figure 1. Study flow diagram of eligible patients with head and neck cancer.
| Journal of Clinical Medicine Research, ISSN 1918-3003 print, 1918-3011 online, Open Access |
| Article copyright, the authors; Journal compilation copyright, J Clin Med Res and Elmer Press Inc |
| Journal website https://jocmr.elmerjournals.com |
Original Article
Volume 18, Number 9, September 2026, pages 612-622
Prediction Model for Detecting Active Pulmonary Tuberculosis in Patients With Head and Neck Cancer Prior to Concurrent Chemoradiotherapy
Figures
Tables
| Baseline characteristics | Active PTB (n = 30), n (%) | No active PTB (n = 475), n (%) | P-value | AuROC |
|---|---|---|---|---|
| Albumin was missing in 80 patients. HPV testing was performed mainly in patients with oropharyngeal tumors. Percentages are calculated among those with available HPV results (n = 148). AuROC: area under the receiver operating characteristic curve; BMI: body mass index; HPV: human papillomavirus; IQR: interquartile range; NLR: neutrophil-to-lymphocyte ratio; PTB: pulmonary tuberculosis; SD: standard deviation. | ||||
| Sex, male, n (%) | 9 (30.0) | 212 (44.6) | 0.131 | 0.573 |
| Age (years), (mean ± SD) | 59.8 ± 11.4 | 57.3 ± 11.4 | 0.234 | 0.544 |
| Comorbidities | ||||
| Diabetes mellitus | 5 (16.7) | 30 (6.3) | 0.048 | 0.551 |
| Hypertension | 4 (13.3) | 78 (16.4) | 0.802 | 0.515 |
| Dyslipidemia | 0 (0) | 40 (8.4) | 0.156 | 0.500 |
| Smoking history | 19 (63.3) | 260 (54.7) | 0.450 | 0.543 |
| Alcohol consumption | 19 (63.3) | 250 (52.6) | 0.266 | 0.553 |
| Tumor site | ||||
| Larynx | 8 (26.7) | 63 (13.3) | 0.082 | 0.643 |
| Oropharynx | 7 (23.3) | 167 (35.2) | ||
| Hypopharynx | 10 (33.3) | 98 (20.6) | ||
| Oral cavity | 3 (10.0) | 83 (17.5) | ||
| Nasopharynx | 2 (6.7) | 64 (13.5) | ||
| Histologic grade | ||||
| Well differentiated | 9 (30.0) | 205 (43.2) | 0.326 | 0.575 |
| Moderately differentiated | 16 (53.3) | 192 (40.4) | ||
| Poorly differentiated | 5 (16.7) | 78 (16.4) | ||
| Tumor stage (T-stage) | ||||
| T1 | 0 (0) | 38 (8.0) | 0.165 | 0.580 |
| T2 | 5 (16.7) | 121 (25.5) | ||
| T3 | 9 (30.0) | 140 (29.5) | ||
| T4 | 16 (53.3) | 176 (37.1) | ||
| Nodal stage (N-stage) | ||||
| N0 | 5 (16.7) | 68 (14.3) | 0.054 | 0.625 |
| N1 | 3 (10.0) | 121 (25.5) | ||
| N2 | 15 (50.0) | 239 (50.3) | ||
| N3 | 7 (23.3) | 47 (9.9) | ||
| Hemoglobin (g/dL), mean ± SD | 9.9 ± 1.4 | 11.9 ± 2.0 | < 0.001 | 0.781 |
| Albumin (g/dL), mean ± SD | 3.2 ± 0.5 | 3.8 ± 0.5 | < 0.001 | 0.812 |
| HPV status (positive) | 1/5 (20.0) | 16/143 (11.2) | 0.462 | 0.544 |
| NLR, median (IQR) | 3.9 (2.1, 7.0) | 3.3 (2.1, 5.3) | 0.338 | 0.552 |
| Maximum tumor diameter (cm), mean ± SD | 4.9 ± 1.7 | 4.6 ± 2.1 | 0.483 | 0.557 |
| Maximum lymph node diameter (cm), Median (IQR) | 2.0 (1.2, 5.0) | 1.8 (1.0, 3.0) | 0.169 | 0.563 |
| Unresectable disease | 28 (93.3) | 419 (88.2) | 0.560 | 0.520 |
| BMI (kg/m2), (mean ± SD) | 17.3 ± 3.2 | 20.3 ± 3.8 | < 0.001 | 0.724 |
| Cancer symptom duration (months), mean ± SD | 4.3 ± 2.4 | 2.3 ± 1.8 | < 0.001 | 0.793 |
| Predictors | Univariable OR (95% CI) | P-value | Multivariable OR (95% CI) | P-value | AuROC |
|---|---|---|---|---|---|
| Multivariable odds ratios were estimated from a single model including body mass index, hemoglobin concentration, serum albumin concentration, and cancer symptom duration; each odds ratio is adjusted for the other three variables in the model. AuROC: area under the receiver operating characteristic curve; BMI: body mass index; CI: confidence interval; OR: odds ratio. | |||||
| BMI (kg/m2) | 0.76 (0.67, 0.87) | < 0.001 | 0.86 (0.75, 0.99) | 0.047 | 0.882 |
| Hemoglobin (g/dL) | 0.60 (0.49, 0.74) | < 0.001 | 0.75 (0.58, 0.95) | 0.021 | |
| Albumin (g/dL) | 0.14 (0.07, 0.29) | < 0.001 | 0.25 (0.12, 0.53) | < 0.001 | |
| Cancer symptom duration (months) | 1.41 (1.23, 1.63) | < 0.001 | 1.49 (1.25, 1.76) | < 0.001 | |
| Parameters | Apparent performance (95% CI) | Bootstrap performance (95% CI) |
|---|---|---|
| AuROC: area under the receiver operating characteristic curve; CITL: calibration-in-the-large; E:O ratio: expected-to-observed outcomes ratio. | ||
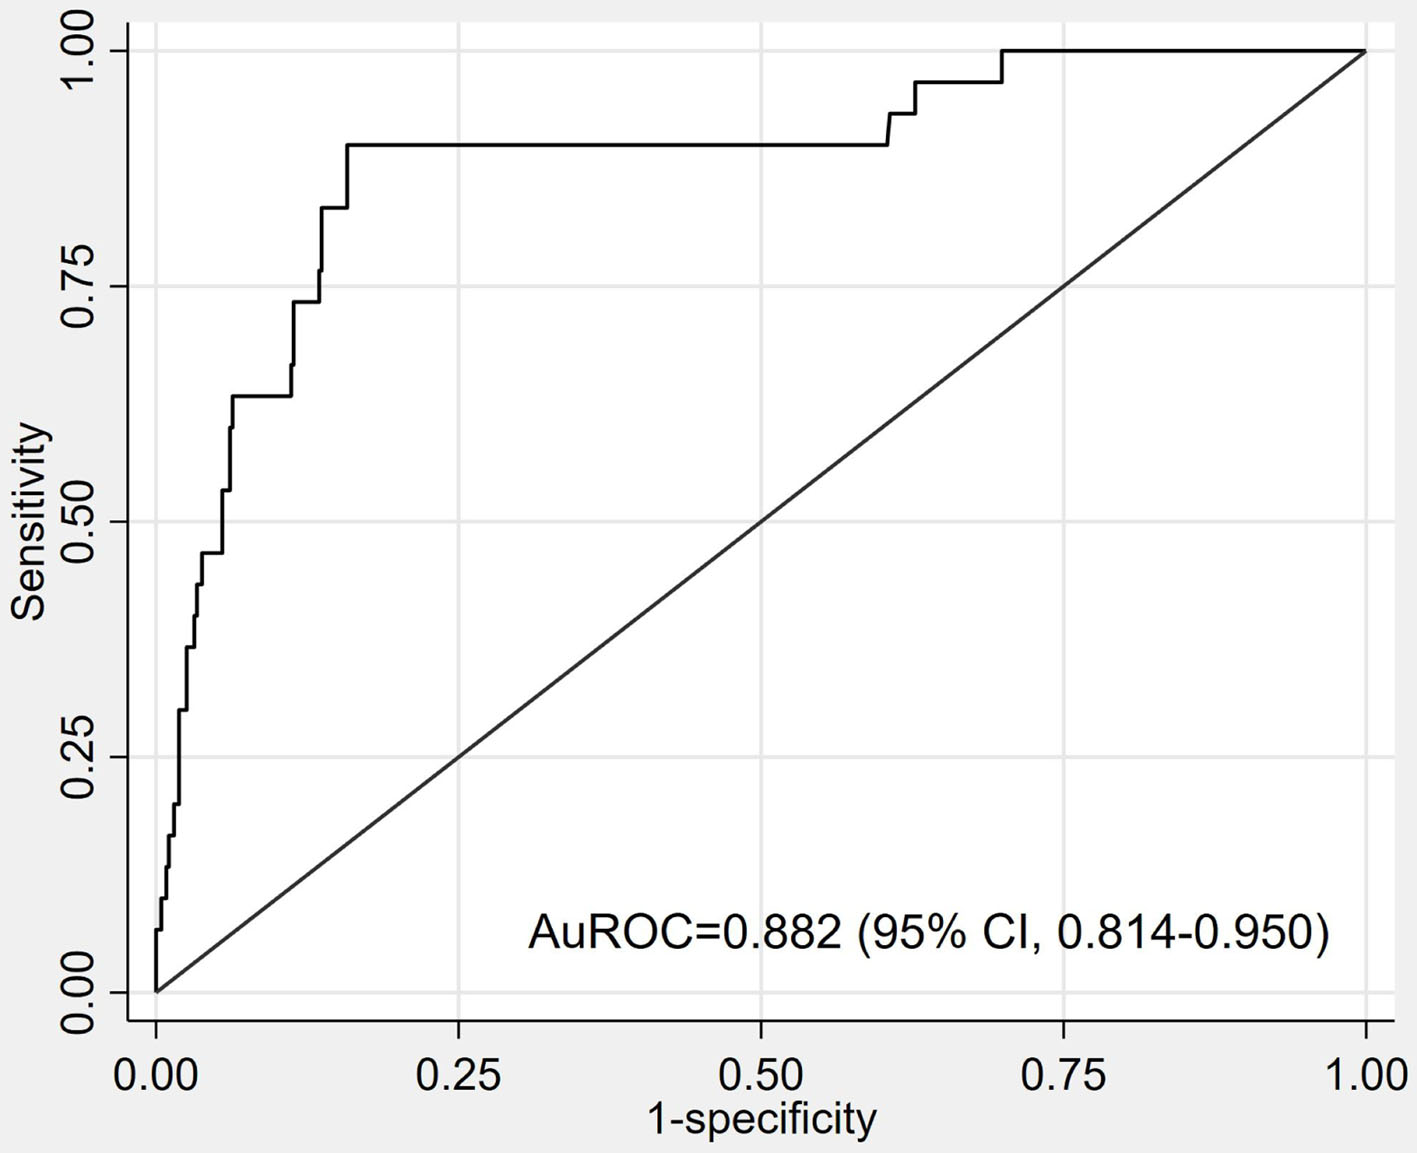
| C-statistic (AuROC) | 0.882 (0.814, 0.950) | 0.872 (0.805, 0.954) |
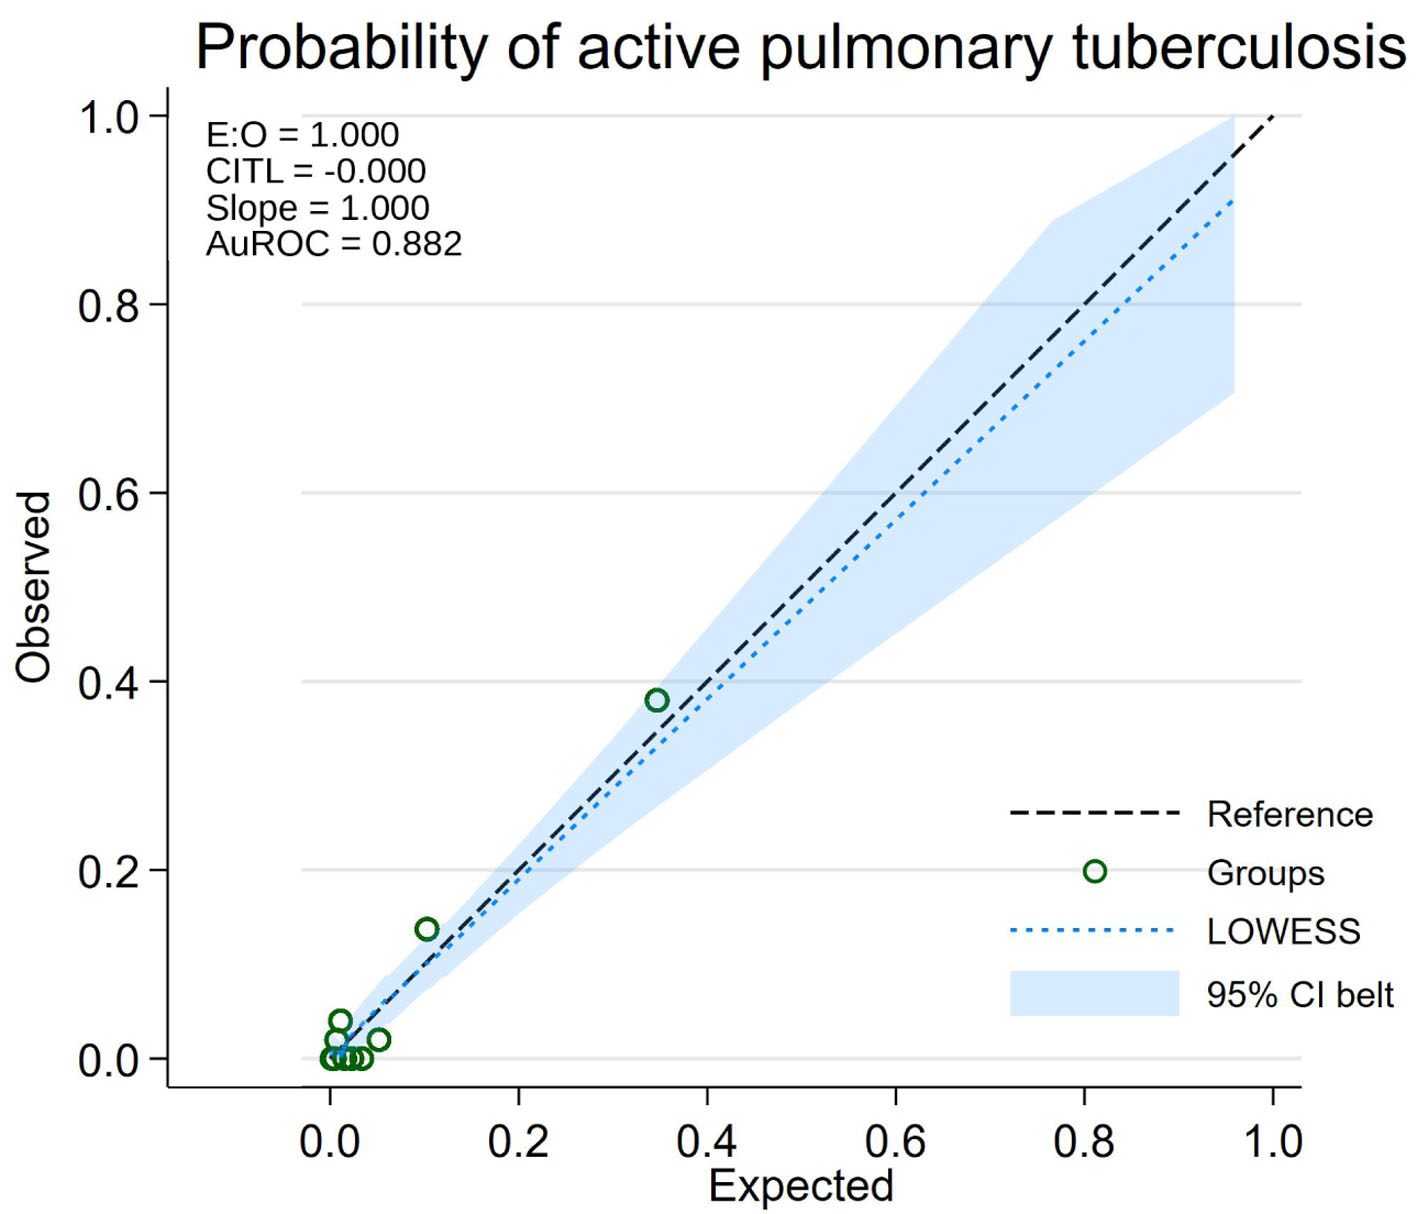
| E:O ratio | 1.000 | 1.034 (0.712, 1.372) |
| CITL | 0.000 (−0.421, 0.421) | −0.024 (−0.512, 0.536) |
| Calibration slope | 1.000 (0.713, 1.287) | 0.917 (0.668, 1.287) |
| Bootstrap shrinkage factor | 0.941 | |
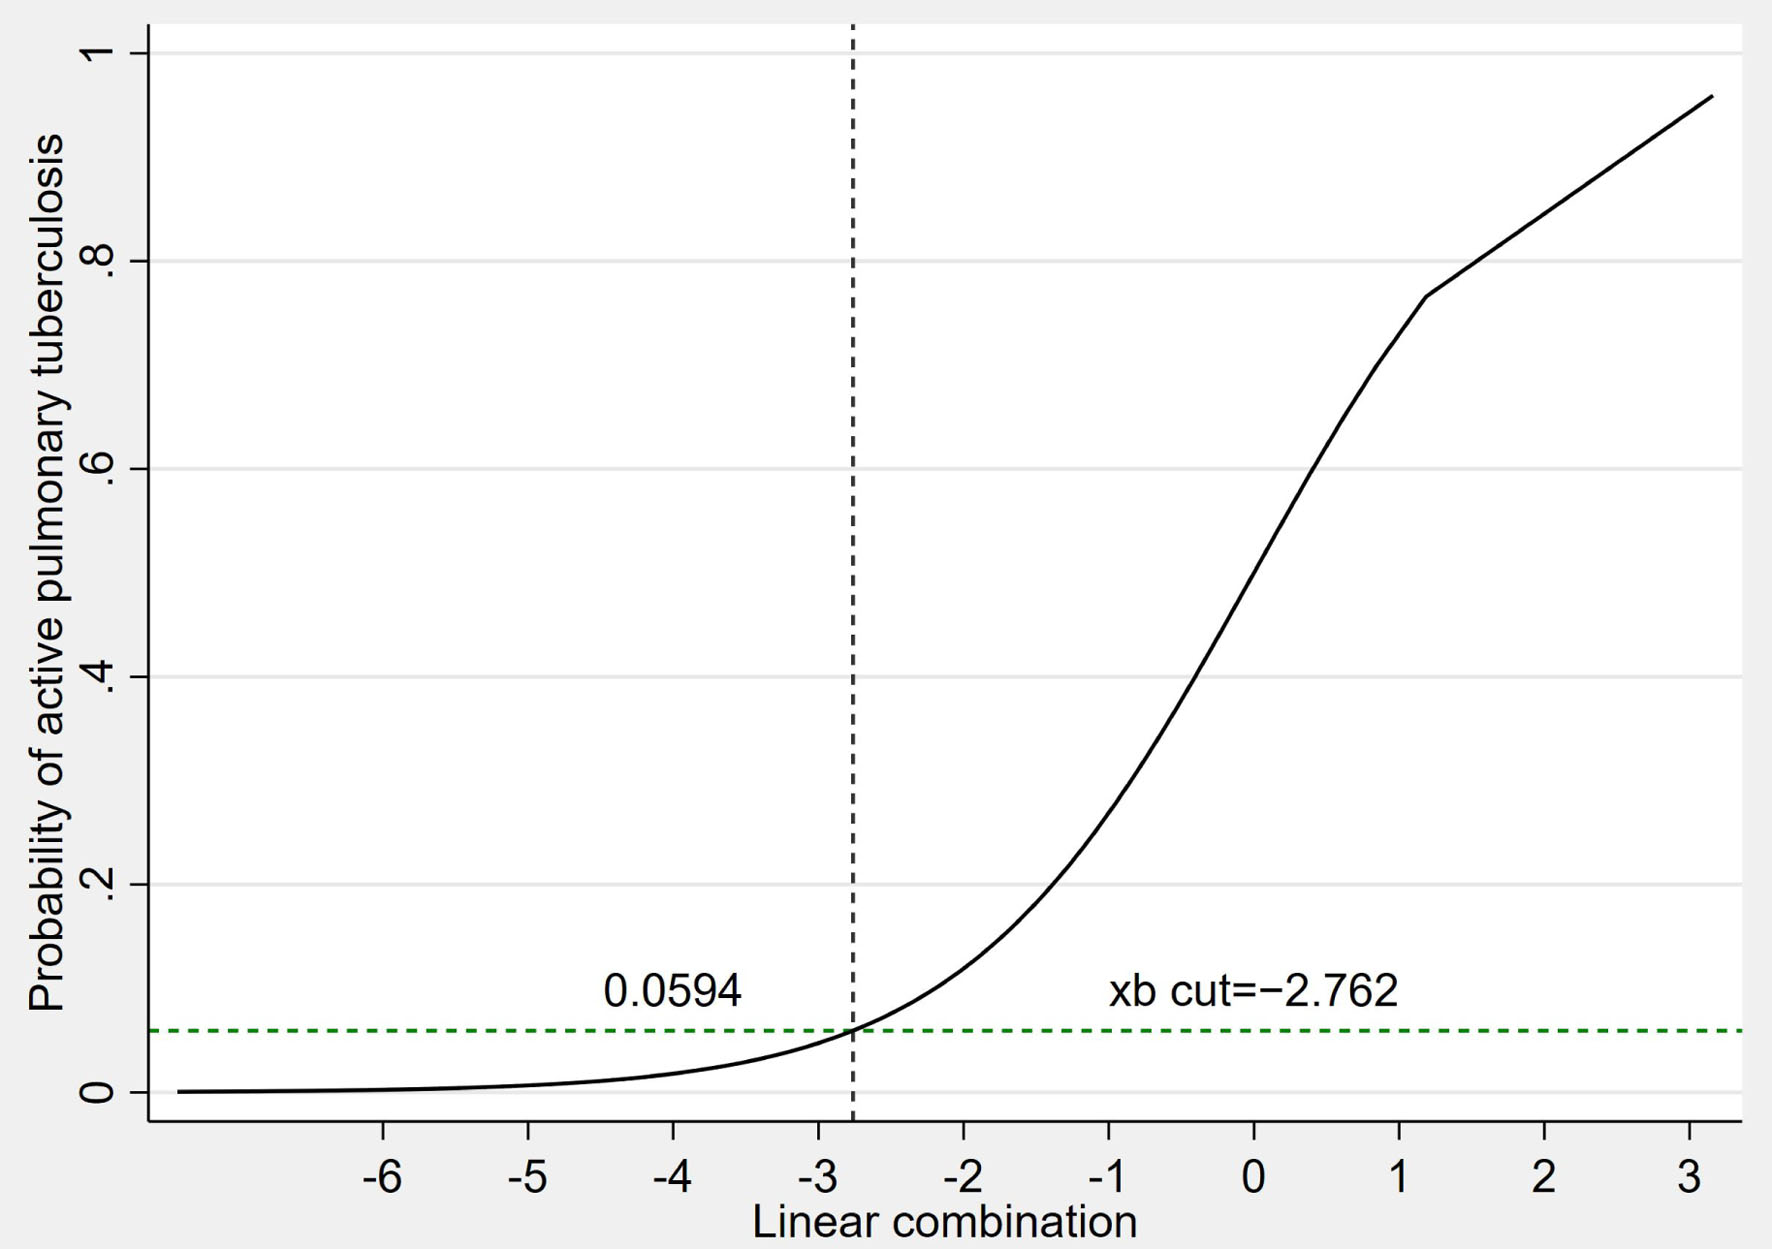
| Model probability of active PTB | Predicted Classification | Active PTB (n = 30), n (% of total) | No active PTB (n = 475), n (% of total) | Diagnostic metrics, % (95% CI) |
|---|---|---|---|---|
| CI: confidence interval; NPV: negative predictive value; PPV: positive predictive value; PTB: pulmonary tuberculosis. | ||||
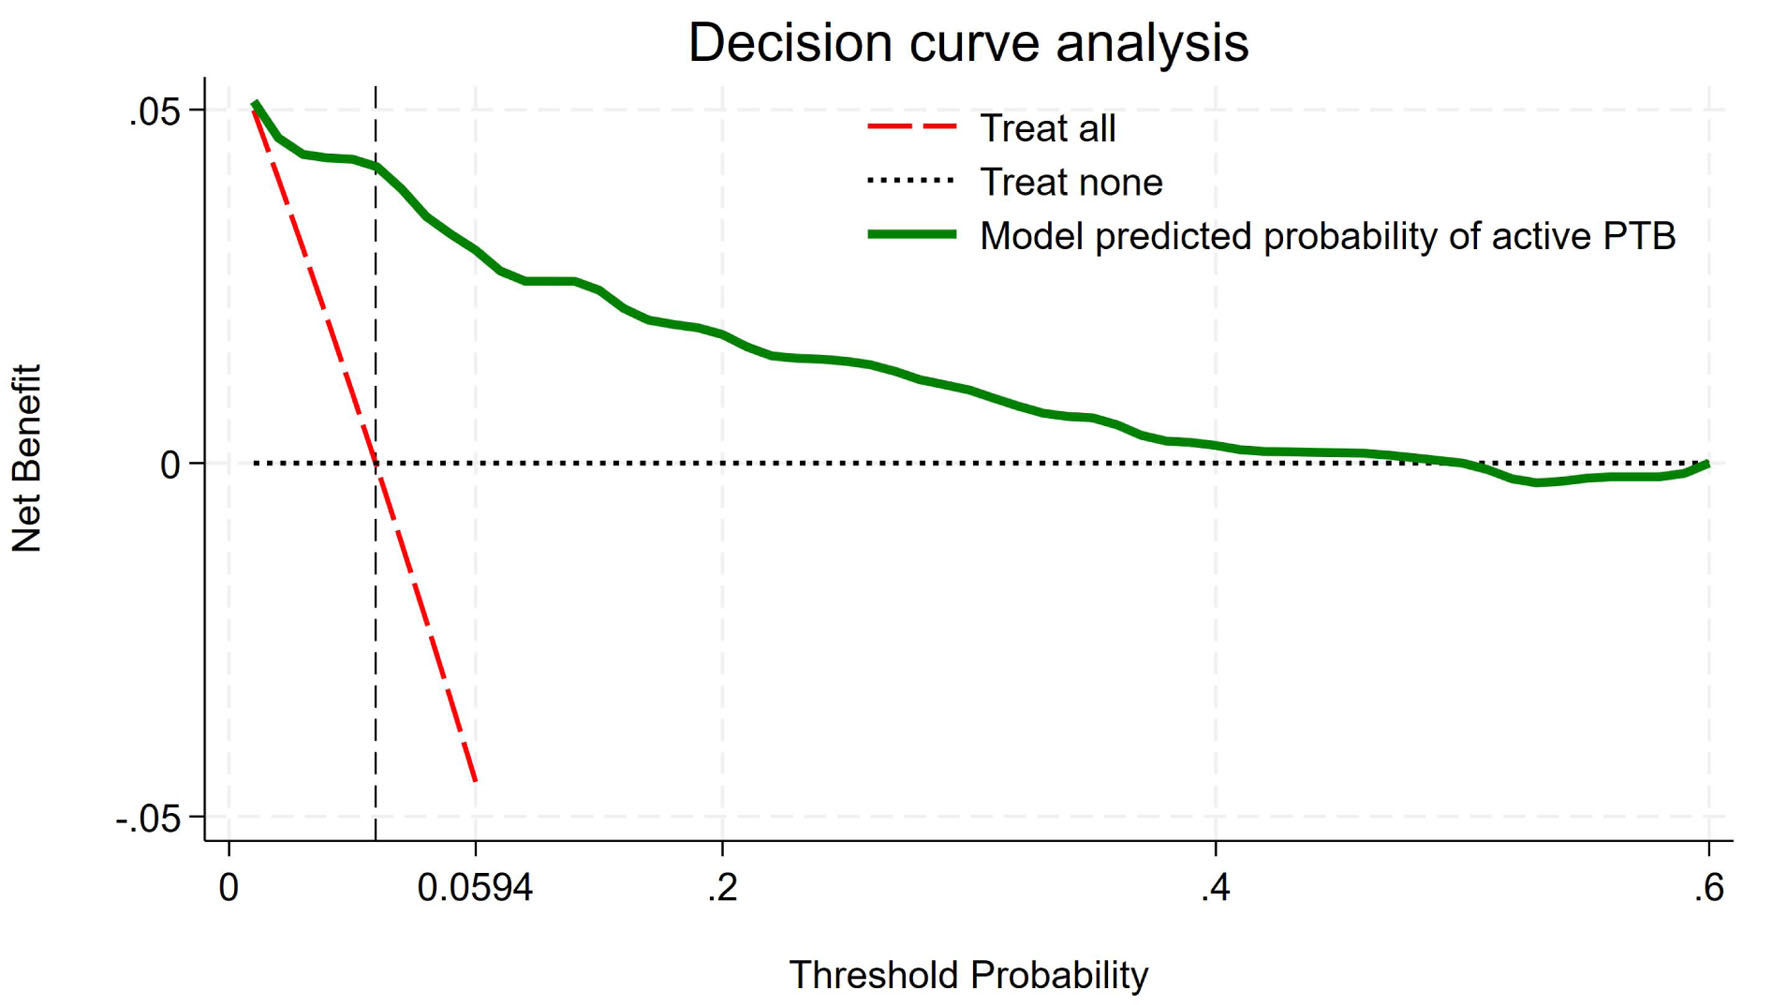
| ≥ 5.94% | Positive | 27 (5.3) | 84 (16.6) | Sensitivity: 90.0% (73.5, 97.9) PPV: 24.3% (16.4, 33.7) |
| < 5.94% | Negative | 3 (0.6) | 391 (77.4) | Specificity: 82.3% (78.6, 85.6) NPV: 99.2% (97.8, 99.8) |