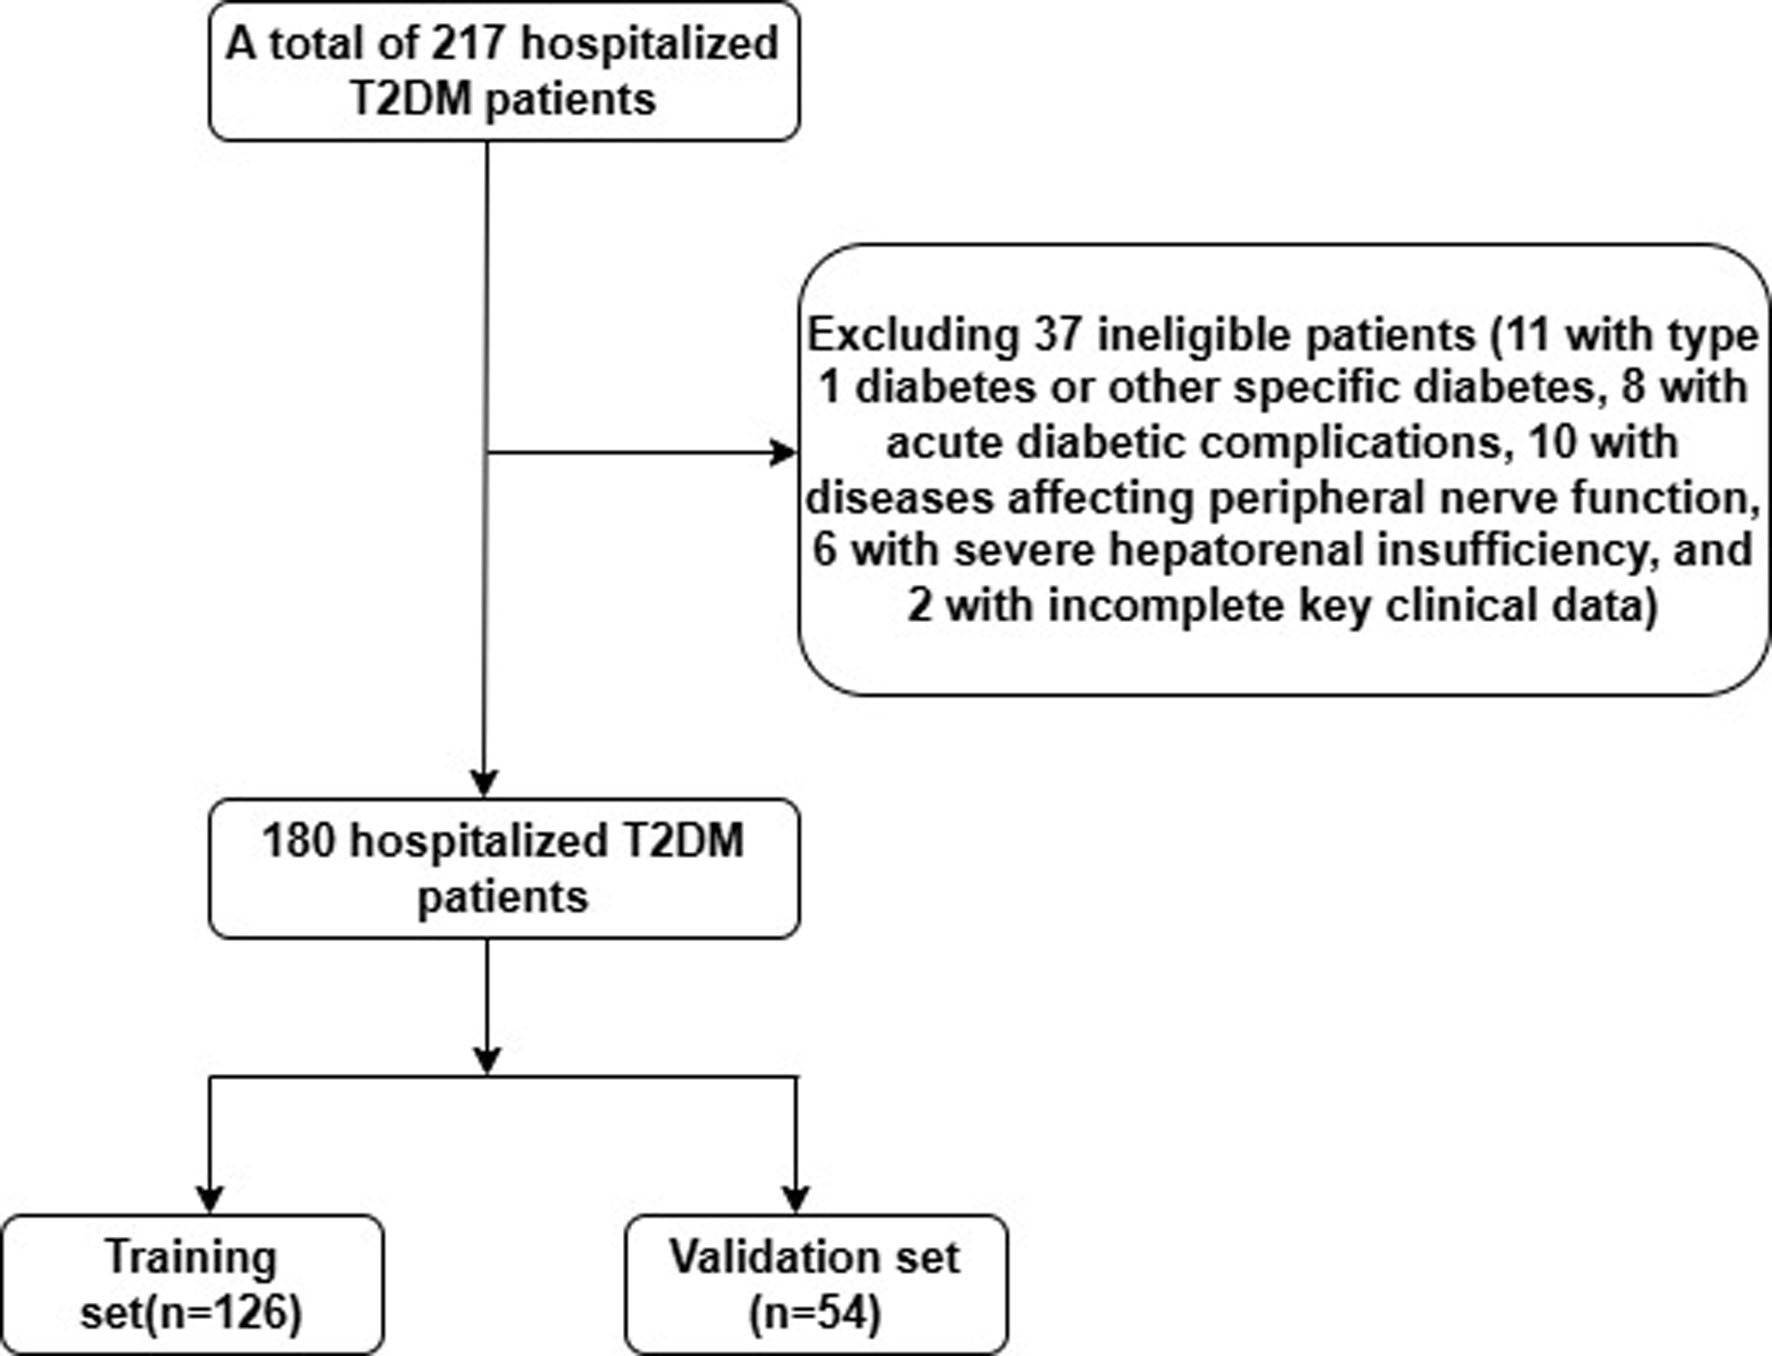
↓ Figure 1. Study flow chart.
| Journal of Clinical Medicine Research, ISSN 1918-3003 print, 1918-3011 online, Open Access |
| Article copyright, the authors; Journal compilation copyright, J Clin Med Res and Elmer Press Inc |
| Journal website https://jocmr.elmerjournals.com |
Original Article
Volume 18, Number 7, July 2026, pages 472-488
Development and Validation of an XGBoost-Based Machine Learning Model With Nomogram for Predicting Diabetic Peripheral Neuropathy Risk in Type 2 Diabetes Patients
Figures
Tables
| Variables | Non-DPN group (n = 92) | DPN group (n = 88) | P-value |
|---|---|---|---|
| *P < 0.05. Independent sample t-test or Mann–Whitney U test was used for continuous variables and χ2 test for categorical variables. ALT: alanine aminotransferase; AST: aspartate aminotransferase; BMI: body mass index; BUN: blood urea nitrogen; DPN: diabetic peripheral neuropathy; eGFR: estimated glomerular filtration rate; FPG: fasting plasma glucose; HbA1c: glycated hemoglobin; HDL-C: high-density lipoprotein cholesterol; HGB: hemoglobin; IQR: interquartile range; LDL-C: low-density lipoprotein cholesterol; LR: logistic regression; MAU: microalbuminuria; NEUT%: neutrophil percentage; PLT: platelet count; SCr: serum creatinine; SD: standard deviation; TC: total cholesterol; TG: triglycerides. | |||
| Demographic characteristics | |||
| Age (years), mean ± SD | 56.8 ± 11.2 | 61.4 ± 10.6 | 0.006* |
| Male, n (%) | 52 (56.5) | 54 (61.4) | 0.505 |
| Duration of diabetes (years), mean (IQR) | 5.2 (2.5–9.0) | 9.5 (5.0–15.0) | < 0.001* |
| Clinical measurements | |||
| BMI (kg/m2), mean ± SD | 25.4 ± 3.2 | 26.8 ± 3.6 | 0.008* |
| Blood glucose metabolism | |||
| FPG (mmol/L), mean ± SD | 8.6 ± 2.8 | 9.8 ± 3.1 | 0.008* |
| HbA1c (%), mean ± SD | 7.8 ± 1.4 | 9.2 ± 1.8 | < 0.001* |
| Lipid profile | |||
| TC (mmol/L), mean ± SD | 4.52 ± 1.02 | 4.78 ± 1.18 | 0.124 |
| TG (mmol/L), mean (IQR) | 1.62 (1.12–2.38) | 1.98 (1.28–2.85) | 0.035* |
| HDL-C (mmol/L), mean ± SD | 1.22 ± 0.30 | 1.08 ± 0.28 | 0.002* |
| LDL-C (mmol/L), mean ± SD | 2.68 ± 0.82 | 3.05 ± 0.96 | 0.007* |
| Hepatic function | |||
| ALT (U/L), mean (IQR) | 22.0 (15.0–35.0) | 24.5 (16.0–40.0) | 0.326 |
| AST (U/L), mean (IQR) | 20.0 (14.0–28.0) | 22.0 (16.0–32.0) | 0.213 |
| Renal function | |||
| SCr (µmol/L), mean (IQR) | 68.2 (56.4–82.6) | 78.5 (62.0–98.4) | 0.004* |
| BUN (mmol/L), mean ± SD | 5.8 ± 1.6 | 6.5 ± 2.0 | 0.013* |
| eGFR (mL/min/1.73 m2), mean ± SD | 88.4 ± 18.2 | 78.6 ± 20.5 | 0.001* |
| Urine parameters | |||
| MAU (mg/24 h), mean (IQR) | 28.6 (14.2–58.5) | 89.5 (38.6–185.2) | < 0.001* |
| Blood routine | |||
| HGB (g/L), mean ± SD | 136.4 ± 17.2 | 128.5 ± 18.6 | 0.005* |
| PLT (× 109/L), mean ± SD | 218.5 ± 58.6 | 228.4 ± 65.2 | 0.299 |
| NEUT% (%), mean ± SD | 63.2 ± 8.5 | 68.4 ± 9.2 | < 0.001* |
| Hypoglycemic medication, n (%) | |||
| Single oral hypoglycemic drugs | 34 (37.0) | 21 (23.9) | 0.062 |
| Combined oral hypoglycemic drugs | 29 (31.5) | 24 (27.3) | 0.564 |
| Insulin monotherapy | 16 (17.4) | 23 (26.1) | 0.168 |
| Insulin + oral hypoglycemic drugs | 13 (14.1) | 20 (22.7) | 0.139 |
| DPN severity, n (%) | |||
| Mild | - | 42 (47.7) | - |
| Moderate | - | 33 (37.5) | - |
| Severe | - | 13 (14.8 | - |
| Variables | β | OR | 95% CI | P-value |
|---|---|---|---|---|
| aMAU was included in regression analysis (ln-MAU) after natural logarithmic transformation. *P < 0.05 was included in multivariate analysis candidate set. ALT: alanine aminotransferase; AST: aspartate aminotransferase; BMI: body mass index; BUN: blood urea nitrogen; CI: confidence interval; DPN: diabetic peripheral neuropathy; eGFR: estimated glomerular filtration rate; FPG: fasting plasma glucose; HbA1c: glycated hemoglobin; HDL-C: high-density lipoprotein cholesterol; HGB: hemoglobin; IQR: interquartile range; LDL-C: low-density lipoprotein cholesterol; LR: logistic regression; MAU: microalbuminuria; NEUT%: neutrophil percentage; OR: odds ratio; PLT: platelet count; SCr: serum creatinine; SD: standard deviation; TC: total cholesterol; TG: triglycerides. | ||||
| Age (years) | 0.042 | 1.043 | 1.012–1.075 | 0.007* |
| Gender (male vs. female) | 0.182 | 1.200 | 0.614–2.344 | 0.592 |
| Duration of diabetes (years) | 0.148 | 1.160 | 1.095–1.228 | < 0.001* |
| BMI (kg/m2) | 0.128 | 1.137 | 1.036–1.247 | 0.007* |
| FPG (mmol/L) | 0.138 | 1.148 | 1.042–1.264 | 0.005* |
| HbA1c (%) | 0.524 | 1.689 | 1.386–2.057 | < 0.001* |
| TC (mmol/L) | 0.218 | 1.243 | 0.938–1.647 | 0.130 |
| TG (mmol/L) | 0.288 | 1.334 | 1.038–1.714 | 0.025* |
| HDL-C (mmol/L) | −1.648 | 0.192 | 0.082–0.451 | < 0.001* |
| LDL-C (mmol/L) | 0.442 | 1.556 | 1.164–2.080 | 0.003* |
| ALT (U/L) | 0.008 | 1.008 | 0.993–1.024 | 0.282 |
| AST (U/L) | 0.012 | 1.012 | 0.993–1.032 | 0.226 |
| SCr (µmol/L) | 0.012 | 1.012 | 1.002–1.022 | 0.014* |
| BUN (mmol/L) | 0.184 | 1.202 | 1.036–1.395 | 0.015* |
| eGFR (mL/min/1.73 m2) | −0.022 | 0.978 | 0.963–0.993 | 0.004* |
| MAU (mg/24 h)a | 0.682 | 1.978 | 1.512–2.587 | < 0.001* |
| HGB (g/L) | −0.018 | 0.982 | 0.968–0.997 | 0.018* |
| PLT (× 109/L) | 0.003 | 1.003 | 0.997–1.009 | 0.322 |
| NEUT% (%) | 0.068 | 1.070 | 1.033–1.109 | < 0.001* |
| Independent predictors | β | OR | 95% CI | P-value | VIF |
|---|---|---|---|---|---|
| BMI: body mass index; CI: confidence interval; DPN: diabetic peripheral neuropathy; HbA1c: glycated hemoglobin; LDL-C: low-density lipoprotein cholesterol; MAU: microalbuminuria; NEUT%: neutrophil percentage; OR: odds ratio. | |||||
| Duration of diabetes (years) | 0.118 | 1.125 | 1.052–1.203 | 0.001 | 1.42 |
| HbA1c (%) | 0.406 | 1.501 | 1.196–1.883 | < 0.001 | 1.68 |
| ln-MAU (mg/24 h) | 0.558 | 1.747 | 1.286–2.373 | < 0.001 | 1.35 |
| LDL-C (mmol/L) | 0.382 | 1.465 | 1.062–2.021 | 0.020 | 1.28 |
| NEUT% (%) | 0.056 | 1.058 | 1.016–1.101 | 0.006 | 1.22 |
| BMI (kg/m2) | 0.102 | 1.107 | 1.012–1.212 | 0.026 | 1.18 |
| Constant term | −16.428 | - | - | < 0.001 | - |
| Models | AUC (mean ± SD) | Accuracy (%) | Sensitivity (%) | Specificity (%) | F1 score |
|---|---|---|---|---|---|
| AUC: area under the curve; SD: standard deviation; SVM: support vector machine. | |||||
| XGBoost | 0.912 ± 0.048 | 85.7 | 84.2 | 87.2 | 0.858 |
| Random forest | 0.896 ± 0.052 | 83.3 | 82.6 | 84.0 | 0.836 |
| Logistic regression | 0.868 ± 0.058 | 80.2 | 79.5 | 81.0 | 0.802 |
| SVM | 0.845 ± 0.062 | 78.6 | 77.8 | 79.5 | 0.784 |
| Decision tree | 0.812 ± 0.072 | 76.2 | 75.4 | 77.0 | 0.760 |
| Models | AUC (95% CI) | Accuracy (%) | Sensitivity (%) | Specificity (%) | PPV (%) | NPV (%) | F1 score | TP | FP | TN | FN |
|---|---|---|---|---|---|---|---|---|---|---|---|
| AUC: area under the curve; CI: confidence interval; FN: false negatives; FP: false positives; NPV: negative predictive value; PPV: positive predictive value; SVM: support vector machine; TN: true negatives; TP: true positives. | |||||||||||
| XGBoost | 0.903 (0.816–0.986) | 85.2 | 84.6 | 85.7 | 84.6 | 85.7 | 0.846 | 22 | 4 | 24 | 4 |
| Random forest | 0.808 (0.713–0.895) | 83.3 | 80.8 | 85.7 | 84.0 | 82.8 | 0.824 | 20 | 5 | 23 | 6 |
| Logistic regression | 0.838 (0.755–0.957) | 79.6 | 80.8 | 78.6 | 77.8 | 81.5 | 0.793 | 19 | 6 | 22 | 7 |
| SVM | 0.884 (0.726–0.988) | 77.8 | 76.9 | 78.6 | 76.9 | 78.6 | 0.769 | 21 | 5 | 23 | 5 |
| Decision tree | 0.814 (0.683–0.933) | 74.1 | 73.1 | 75.0 | 73.1 | 75.0 | 0.731 | 18 | 7 | 21 | 8 |