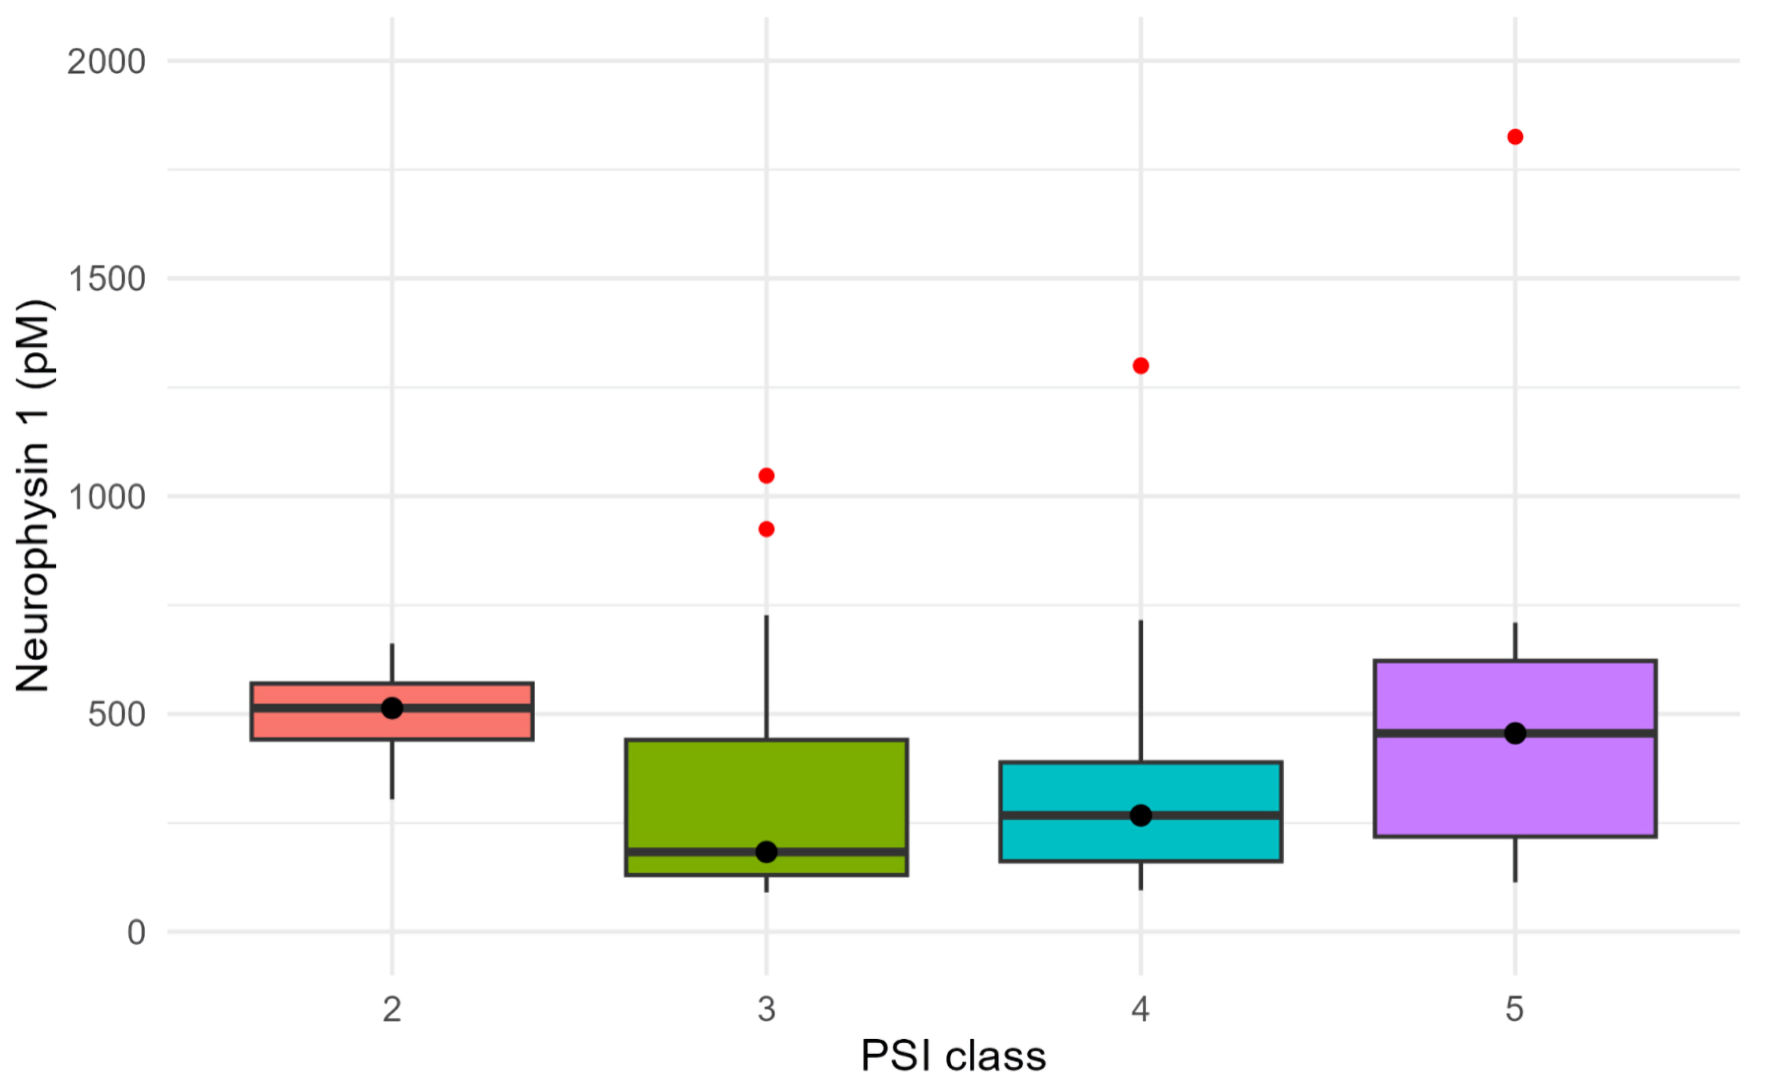
↓ Figure 1. Distribution of Neurophysin I levels across the different PSI risk classes. Three outliers (two in PSI class III and one in PSI class V) were not displayed for visualization purposes. PSI: Pneumonia Severity Index.
| Journal of Clinical Medicine Research, ISSN 1918-3003 print, 1918-3011 online, Open Access |
| Article copyright, the authors; Journal compilation copyright, J Clin Med Res and Elmer Press Inc |
| Journal website https://jocmr.elmerjournals.com |
Original Article
Volume 18, Number 11, November 2026, pages 842-849
Neurophysin I in Community-Acquired Pneumonia: Prognostic Value and Association With Renal Function
Figure
Tables
| Whole cohort (n = 65) | PSI I–III (n = 30)a | PSI IV–V (n = 35)b | |
|---|---|---|---|
| aPSI I = 0, PSI II = 4, PSI III = 26. bPSI IV = 19, PSI V = 16. Data are presented as frequency (percentage) and median (IQR). BMI: body mass index; PSI: Pneumonia Severity Index; CAP: community-acquired pneumonia; eGFR: creatinine-based estimated glomerular filtration rate calculated using the CKD-EPI equation; CKD-EPI: Chronic Kidney Disease Epidemiology Collaboration. | |||
| Characteristics | |||
| Female, sex, n (%) | 27 (41.5) | 12 (40) | 15 (42.9) |
| Age (years) | 79 (76–83) | 79 (75–81) | 80 (77–85) |
| BMI (kg/m2) | 25.3 (23.0–30.0) | 25.4 (23.1–30.5) | 25.3 (22.9–30.0) |
| Randomized to prednisone, n (%) | 29 (44.6) | 11 (36.7) | 18 (51.4) |
| Comorbidities | |||
| Diabetes mellitus, n (%) | 21 (32.3) | 10 (33.3) | 11 (31.4) |
| Renal insufficiency, n (%) | 28 (43.1) | 6 (20) | 22 (62.9) |
| Clinical scores and outcomes | |||
| Total PSI score (points) | 98 (79–129) | 79 (75–83) | 129 (100–156) |
| Length of hospitalization (days) | 8 (5–11) | 6 (4.3–7.8) | 10 (7.5–14.5) |
| Time to clinical stability (days) | 5 (2–10) | 3 (2–5.3) | 8.6 (3.2–16.7) |
| CAP-related complication, n (%) | 28 (43.1) | 0 (0) | 28 (80) |
| Death for any cause, n (%) | 10 (15.4) | 0 (0) | 10 (28.6) |
| CAP-related death, n (%) | 8 (12.3) | 0 (0) | 8 (22.9) |
| Laboratory values | |||
| Leucocytes (cells/µL) | 9,740 (6,680–13,700) | 10,200 (6,840–13,000) | 9,560 (5,920–15,000) |
| C-reactive protein (mg/L) | 139.0 (57.0–220.0) | 83.5 (27.8–160.0) | 155.0 (88.4–253.0) |
| Procalcitonin (ng/mL) | 0.46 (0.16–2.68) | 0.49 (0.12–2.02) | 0.46 (0.23–5.12) |
| Albumin (g/L) | 30 (27–35) | 34 (30–36) | 29 (25–33) |
| Sodium (mmol/L) | 139 (137–140) | 138 (137–139) | 139 (137–141) |
| Potassium (mmol/L) | 4.0 (3.6–4.3) | 4.0 (3.5–4.2) | 4.1 (3.7–4.4) |
| Urea (mmol/L) | 8.3 (5.8–11.8) | 5.9 (5.2–6.7) | 11.2 (8.4–15.0) |
| Creatinine (µmol/L) | 92 (75–123) | 82 (69–94) | 115 (86–178) |
| eGFR (mL/min/1.73m2) | 65 (45–82) | 77 (65–89) | 54 (32–67) |
| Neurophysin 1 (pM) | 301 (166–590) | 242 (138–526) | 307 (181–597) |
| Variable | β coefficient | 95% CI | P value |
|---|---|---|---|
| CI: confidence interval; eGFR: creatinine-based estimated glomerular filtration rate calculated using the CKD-EPI equation. | |||
| eGFR (mL/min/1.73 m2) | −9.060 | −17.596 to −0.525 | 0.038 |
| Age (years) | −19.564 | −45.454 to 6.326 | 0.136 |
| Sex (female) | −239.190 | −673.608 to 195.228 | 0.275 |