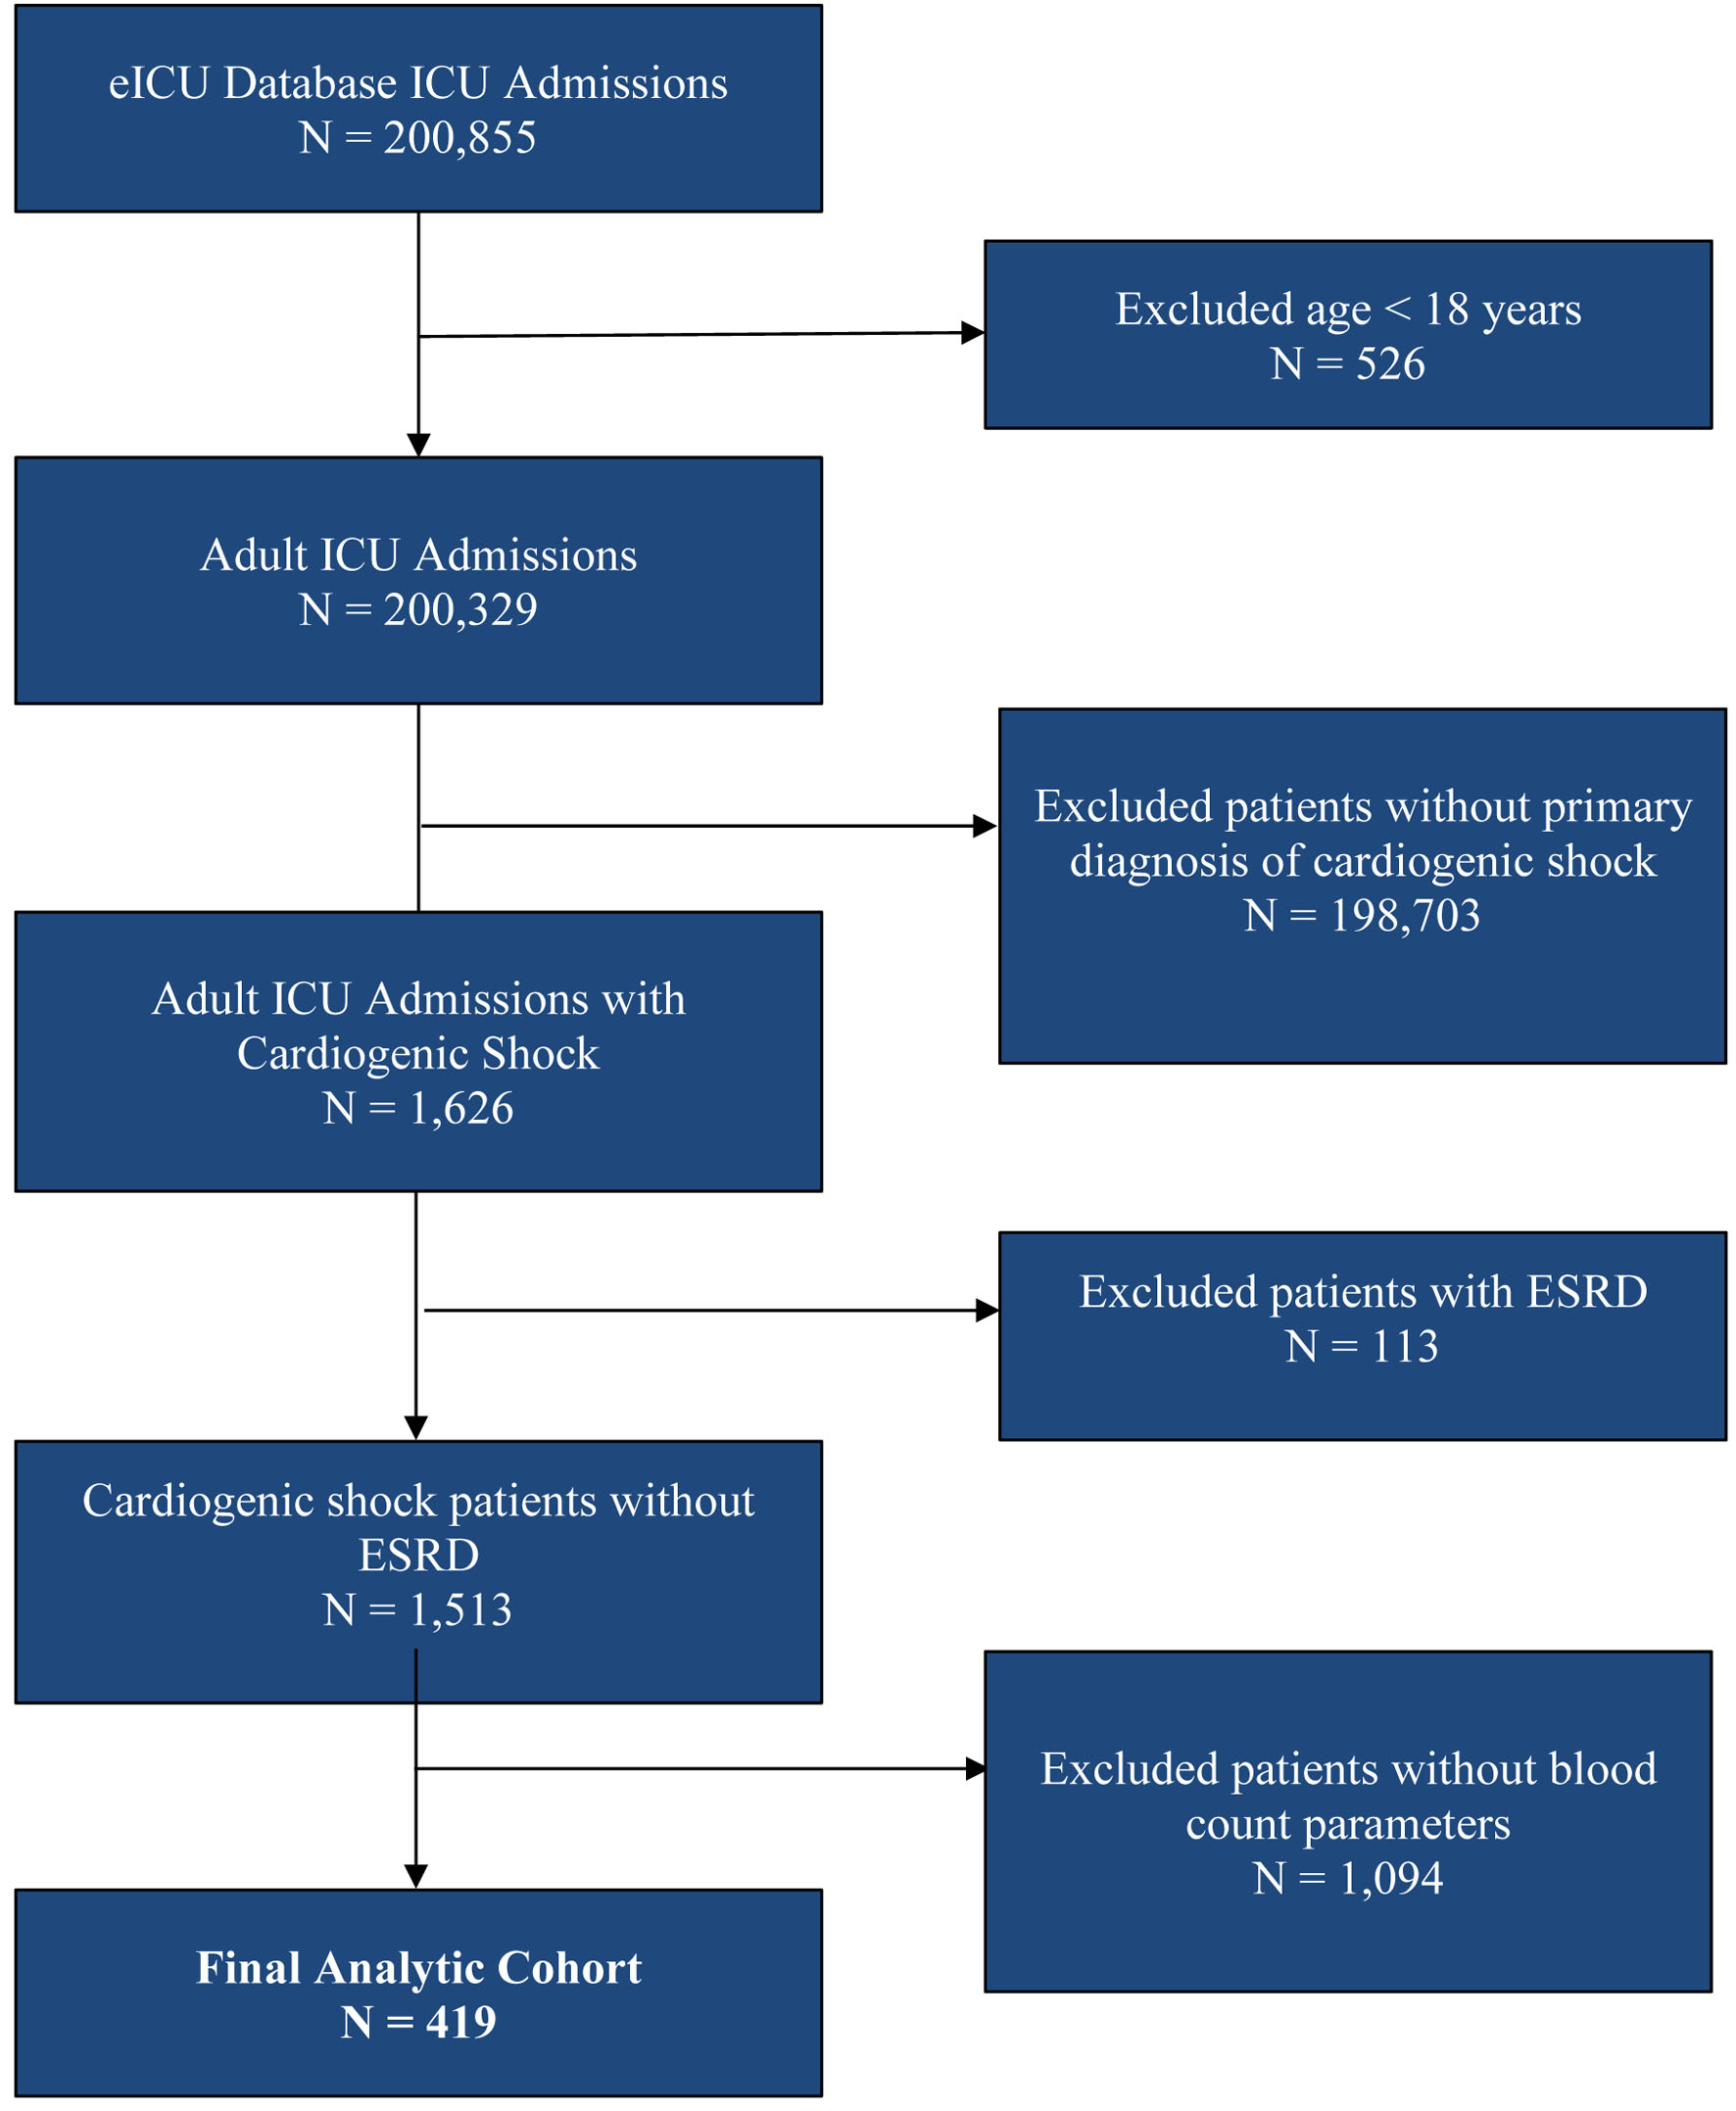
↓ Figure 1. Flowchart of selection of participants. ESRD: end-stage renal disease.
| Journal of Clinical Medicine Research, ISSN 1918-3003 print, 1918-3011 online, Open Access |
| Article copyright, the authors; Journal compilation copyright, J Clin Med Res and Elmer Press Inc |
| Journal website https://jocmr.elmerjournals.com |
Review Article
Volume 18, Number 8, August 2026, pages 528-541
Blood Count-Based Inflammatory Indices Do Not Improve Prediction of Acute Kidney Injury in Cardiogenic Shock
Figures
Tables
| Variable | Without AKI (N = 146) | With AKI (N = 273) | P | |||||||
|---|---|---|---|---|---|---|---|---|---|---|
| Age (years) | 69 (57, 80) | 67 (58, 76) | 0.32 | |||||||
| BMI (kg/m2) | 26.8 (23.5, 30.8) | 28.4 (24.3, 33.4) | 0.06 | |||||||
| Initial ALT (U/L) | 66 (30, 115) | 139 (45, 622) | < 0.001 | |||||||
| Bicarbonate (mmol/L) | 20 (17, 23) | 18 (14, 22) | 0.02 | |||||||
| Initial AST (U/L) | 88 (45, 331) | 231 (57, 913) | 0.003 | |||||||
| Initial lactate (mmol/L) | 2.3 (1.5, 4.9) | 3.6 (1.9, 7.5) | 0.02 | |||||||
| Initial INR | 1.4 (1.2, 2.1) | 1.7 (1.3, 2.9) | 0.003 | |||||||
| Total bilirubin (mg/dL) | 0.8 (0.6, 1.4) | 1.0 (0.6, 1.8) | 0.08 | |||||||
| Creatinine (mg/dL) | 1.2 (0.9, 1.8) | 1.8 (1.3, 2.9) | < 0.001 | |||||||
| Potassium (mmol/L) | 4.3 (3.9, 4.9) | 4.3 (3.8, 4.9) | 0.79 | |||||||
| Sodium (mmol/L) | 137 (134, 140) | 137 (133, 139) | 0.16 | |||||||
| Platelet count (× 103 cells/µL) | 220 (161, 281) | 203 (156, 260) | 0.16 | |||||||
| Monocytes (× 103 cells/µL) | 7.0 (5.0, 8.9) | 7.0 (5.0, 10.0) | 0.87 | |||||||
| Hemoglobin (g/dL) | 12.1 (10.5, 14.2) | 12.3 (10.3, 14.0) | 0.68 | |||||||
| Albumin(g/dL) | 3.4 (3.0, 3.8) | 3.3 (2.9, 3.7) | 0.16 | |||||||
| Lymphocyte count (× 103 cells/µL) | 1.5 (0.9, 2.9) | 1.4 (0.8, 2.5) | 0.25 | |||||||
| SII | 940 (466, 2,279) | 1,200 (491, 2,447) | 0.37 | |||||||
| AISI (× 109/L) | 6,520 (2,970, 14,171) | 8,631 (3,272, 15,327) | 0.38 | |||||||
| NLR | 4.6 (2.2, 10.5) | 6.1 (3.0, 11.6) | 0.13 | |||||||
| PLR | 135 (76, 233) | 143 (79, 241) | 0.66 | |||||||
| MLR | 4.7 (2.5, 7.9) | 5.4 (2.4, 8.8) | 0.44 | |||||||
| SIRI | 34.2 (14.8, 66.6) | 43.5 (20.9, 76.5) | 0.22 | |||||||
| Chloride (mmol/L) | 102 (96, 105) | 101 (96, 104) | 0.75 | |||||||
| Lactate/albumin ratio | 0.78 (0.44, 1.53) | 1.0 (0.6, 1.8) | 0.03 | |||||||
| SOFA on admission | 9 (6, 12) | 10 (7, 13) | 0.04 | |||||||
| Without AKI | With AKI | Odds ratio | 95% CI for odds ratio | P | ||||||
| ACEi: angiotensin-converting enzyme inhibitor; AISI: aggregate index of systemic inflammation; AKI: acute kidney injury; ALT: alanine transaminase; ARB: angiotensin receptor blocker; AST: aspartate transaminase; BMI: body mass index; BUN: blood urea nitrogen; CABG: coronary artery bypass graft; CI: confidence interval; CKD: chronic kidney disease; COPD: chronic obstructive pulmonary disease; CVA: cerebrovascular accident; HD: hemodialysis; IABP: intra-aortic balloon pump; INR: international normalized ratio; MI: myocardial infarction; MLR: monocyte to lymphocyte ratio; NLR: neutrophil to lymphocyte ratio; NPAR: neutrophil percentage to albumin ratio; PCI: percutaneous coronary intervention; PLR: platelet to lymphocyte ratio; RRT: renal replacement therapy; SII: systemic immune-inflammation index; SIRI: systemic inflammation response index; SOFA: sequential organ failure assessment. | ||||||||||
| Diabetes | 5 (3.4%) | 8 (2.9%) | 0.86 | 0.27 | 2.66 | 0.79 | ||||
| Cardiomyopathy | 2 (1.4%) | 9 (3.3%) | 2.46 | 0.53 | 11.56 | 0.24 | ||||
| CVA | 2 (1.4%) | 5 (1.8%) | 1.35 | 0.26 | 7.04 | 0.72 | ||||
| CKD | 22 (15.1%) | 69 (25.4%) | 1.92 | 1.13 | 3.25 | 0.01 | ||||
| COPD | 15 (10.3%) | 23 (8.5%) | 0.81 | 0.41 | 1.60 | 0.54 | ||||
| Heart failure | 52 (35.6%) | 99 (36.4%) | 1.03 | 0.68 | 1.57 | 0.87 | ||||
| Hypertension | 16 (11.0%) | 29 (10.7%) | 0.97 | 0.51 | 1.85 | 0.93 | ||||
| Hyperlipidemia | 12 (8.2%) | 10 (3.7%) | 0.43 | 0.18 | 1.01 | 0.04 | ||||
| Malignancy | 5 (3.4%) | 8 (2.9%) | 0.86 | 0.27 | 2.66 | 0.79 | ||||
| ARB | 2 (1.4%) | 11 (4.0%) | 3.03 | 0.66 | 13.88 | 0.13 | ||||
| ACEi | 20 (13.7%) | 27 (9.9%) | 0.69 | 0.38 | 1.29 | 0.24 | ||||
| Diuretics | 33 (22.6%) | 88 (32.4%) | 1.64 | 1.03 | 2.60 | 0.04 | ||||
| IABP | 17 (11.6%) | 42 (15.4%) | 1.38 | 0.76 | 2.52 | 0.294 | ||||
| Vasopressors | 110 (75.3%) | 230 (84.2%) | 1.75 | 1.06 | 2.88 | 0.03 | ||||
| Primary CABG | 1 (0.7%) | 1 (0.4%) | 0.52 | 0.03 | 8.59 | 0.652 | ||||
| Emergent CABG | 1 (0.7%) | 2 (0.7%) | 1.07 | 0.10 | 11.90 | 0.96 | ||||
| Ethnicity | ||||||||||
| Caucasian | 113 (77.4%) | 208 (76.2%) | 0.27 | |||||||
| African Americans | 15 (10.3%) | 28 (10.3%) | ||||||||
| Asians | 3 (2.1%) | 8 (2.9%) | ||||||||
| Hispanics | 11 (7.5%) | 11 (4.0%) | ||||||||
| Other | 4 (2.7%) | 18 (16.6%) | ||||||||
| Acute MI | 40 (27.4%) | 91 (33.3%) | 1.33 | 0.85 | 2.06 | 0.21 | ||||
| PCI | 14 (9.6%) | 25 (9.2%) | 0.95 | 0.48 | 1.89 | 0.89 | ||||
| Male sex | 85 (58.2%) | 167 (61.2%) | 1.12 | 0.75 | 1.70 | 0.56 | ||||
| Mechanical ventilation | 92 (63.0%) | 190 (69.9%) | 1.36 | 0.89 | 2.08 | 0.16 | ||||
| Variables | OR | CI | P value | |
|---|---|---|---|---|
| Covariates in this model were specified a priori and comprised baseline serum creatinine, blood urea nitrogen, alanine transaminase, SOFA score on admission, age, sex, and a history of chronic kidney disease. Creatinine and blood urea nitrogen were included as direct measures of baseline renal function, alanine transaminase as a marker of hepatic congestion or ischemic hepatic injury reflecting hemodynamic compromise, SOFA score as a measure of global illness severity, age and sex as demographic confounders, and chronic kidney disease as an indicator of preexisting renal vulnerability. Estimates are pooled across 20 MICE-imputed datasets. OR for ALT are rounded off to 1.00 as the estimated effect size was extremely small per 1-unit increase. ALT: alanine transaminase; BUN: blood urea nitrogen; CI: confidence interval; CKD: chronic kidney disease; OR: odds ratio; SOFA: sequential organ failure assessment. | ||||
| Intercept | 0.72 | 0.22 | 2.35 | 0.59 |
| Creatinine | 1.63 | 1.16 | 2.3 | 0.01 |
| BUN | 1.01 | 0.99 | 1.02 | 0.21 |
| ALT | 1.00 | 1.00 | 1.00 | 0.18 |
| SOFA score | 1.00 | 0.95 | 1.06 | 0.93 |
| Age | 0.99 | 0.98 | 1.01 | 0.43 |
| Sex (male) | 0.97 | 0.63 | 1.51 | 0.90 |
| CKD | 0.94 | 0.5 | 1.77 | 0.85 |
| Variables | OR | CI | P value | |
|---|---|---|---|---|
| This model was adjusted for the same a priori covariates as the primary model with the exception of baseline serum creatinine and blood urea nitrogen, which were deliberately omitted; adjustment therefore comprised alanine transaminase, SOFA score on admission, age, sex, and chronic kidney disease. Renal laboratory values were removed because they are already abnormal, at the time of early risk assessment, which allows the independent contribution of preexisting chronic kidney disease to be estimated. Estimates are pooled across 20 MICE-imputed datasets. ALT: alanine transaminase; CI: confidence interval; CKD: chronic kidney disease; OR: odds ratio; SOFA: sequential organ failure assessment. | ||||
| Intercept | 1.23 | 0.39 | 3.85 | 0.72 |
| ALT | 1.00 | 1.00 | 1.00 | 0.14 |
| SOFA score | 1.03 | 0.98 | 1.09 | 0.27 |
| Age | 1.00 | 0.99 | 1.01 | 0.68 |
| Sex (male) | 1.11 | 0.73 | 1.70 | 0.62 |
| CKD | 1.95 | 1.14 | 3.34 | 0.02 |
| Index | OR | CI | P value | |
|---|---|---|---|---|
| Model A was adjusted for the a priori clinical covariates age, sex, chronic kidney disease, and SOFA score on admission. Model B was additionally adjusted for baseline serum creatinine and blood urea nitrogen, in order to test whether any association was independent of conventional measures of renal function. Each index was entered separately, and odds ratios are expressed per 1-SD increase in the standardized index. q-values were derived using the Benjamini-Hochberg false discovery rate procedure across the indices tested. AISI: aggregate index of systemic inflammation; CI: confidence interval; MLR: monocyte to lymphocyte ratio; NLR: neutrophil to lymphocyte ratio; OR: odds ratio; PLR: platelet to lymphocyte ratio; NPAR: neutrophil percentage to albumin ratio; SII: systemic immune-inflammation index; SIRI: systemic inflammation response index. | ||||
| Model A: adjusted for clinical covariate | ||||
| AISI | 1.00 | 0.82 | 1.23 | 0.98 |
| MLR | 1.15 | 0.91 | 1.45 | 0.26 |
| NLR | 1.01 | 0.82 | 1.25 | 0.89 |
| NPAR | 1.06 | 0.86 | 1.32 | 0.56 |
| PLR | 1.09 | 0.87 | 1.38 | 0.45 |
| SII | 0.98 | 0.80 | 1.21 | 0.88 |
| SIRI | 1.06 | 0.85 | 1.31 | 0.6 |
| Lactate/albumin ratio | 1.21 | 0.82 | 1.79 | 0.32 |
| Model B: adjusted for clinical and renal function | ||||
| AISI | 0.96 | 0.77 | 1.19 | 0.68 |
| MLR | 1.04 | 0.82 | 1.32 | 0.72 |
| NLR | 0.95 | 0.76 | 1.18 | 0.64 |
| NPAR | 0.93 | 0.74 | 1.18 | 0.56 |
| PLR | 1.07 | 0.85 | 1.34 | 0.56 |
| SII | 0.97 | 0.79 | 1.20 | 0.78 |
| SIRI | 0.95 | 0.75 | 1.19 | 0.63 |
| Lactate/albumin ratio | 1.11 | 0.75 | 1.63 | 0.6 |
| Inflammatory index | Base AUC (mean SD) | Base + index AUC (mean SD) | ΔAUC (mean SD) | Base + renal AUC (mean SD) | Base + renal + index AUC (mean SD) | ΔAUC (mean SD) |
|---|---|---|---|---|---|---|
| The base model was adjusted for the a priori clinical covariates age, sex, chronic kidney disease, and SOFA score on admission, chosen because they are routinely available at the time of early risk assessment and represent demographic risk, preexisting renal vulnerability, and global illness severity. The base plus renal model additionally included baseline serum creatinine and blood urea nitrogen, so that incremental discrimination could be judged against conventional renal function testing. Each inflammatory index was added individually to both models, because several indices share common blood-count components and entering them simultaneously would introduce collinearity. All AUC values are means with standard deviations across 20 MICE-imputed datasets. AISI: aggregate index of systemic inflammation; AKI: acute kidney injury; AUC: area under the curve; ICU: intensive care unit; MLR: monocyte to lymphocyte ratio; NLR: neutrophil to lymphocyte ratio; OR: odds ratio; PLR: platelet to lymphocyte ratio; NPAR: neutrophil percentage to albumin ratio; SD: standard deviation; SII: systemic immune-inflammation index; SIRI: systemic inflammation response index. | ||||||
| SIRI | 0.594 (0.001) | 0.598 (0.002) | 0.0040 (0.0006) | 0.704 (0.009) | 0.704 (0.009) | 0.0002 (0.0006) |
| MLR | 0.594 (0.001) | 0.603 (0.002) | 0.0088 (0.0005) | 0.704 (0.009) | 0.703 (0.009) | −0.0004 (0.0004) |
| NLR | 0.594 (0.001) | 0.595 (0.002) | 0.0008 (0.0003) | 0.704 (0.009) | 0.703 (0.009) | −0.0007 (0.0006) |
| PLR | 0.594 (0.001) | 0.598 (0.002) | 0.0040 (0.0008) | 0.704 (0.009) | 0.703 (0.009) | −0.0008 (0.0006) |
| AISI | 0.594 (0.001) | 0.594 (0.002) | 0.0001 (0.0003) | 0.704 (0.009) | 0.703 (0.009) | −0.0009 (0.0006) |
| NPAR | 0.594 (0.001) | 0.598 (0.002) | 0.0039 (0.0006) | 0.704 (0.009) | 0.703 (0.009) | −0.0009 (0.0007) |
| SII | 0.594 (0.001) | 0.594 (0.002) | −0.0002 (0.0002) | 0.704 (0.009) | 0.702 (0.009) | −0.0011 (0.0006) |