| Journal of Clinical Medicine Research, ISSN 1918-3003 print, 1918-3011 online, Open Access |
| Article copyright, the authors; Journal compilation copyright, J Clin Med Res and Elmer Press Inc |
| Journal website https://jocmr.elmerjournals.com |
Original Article
Volume 18, Number 9, September 2026, pages 599-611
Cytochrome P450 2D6 Metabolizer Phenotype Is Associated With Metoprolol Pharmacodynamics But Not With Metoprolol Discontinuation: A Retrospective Cohort Study in the All of Us Research Program
Figures


Tables
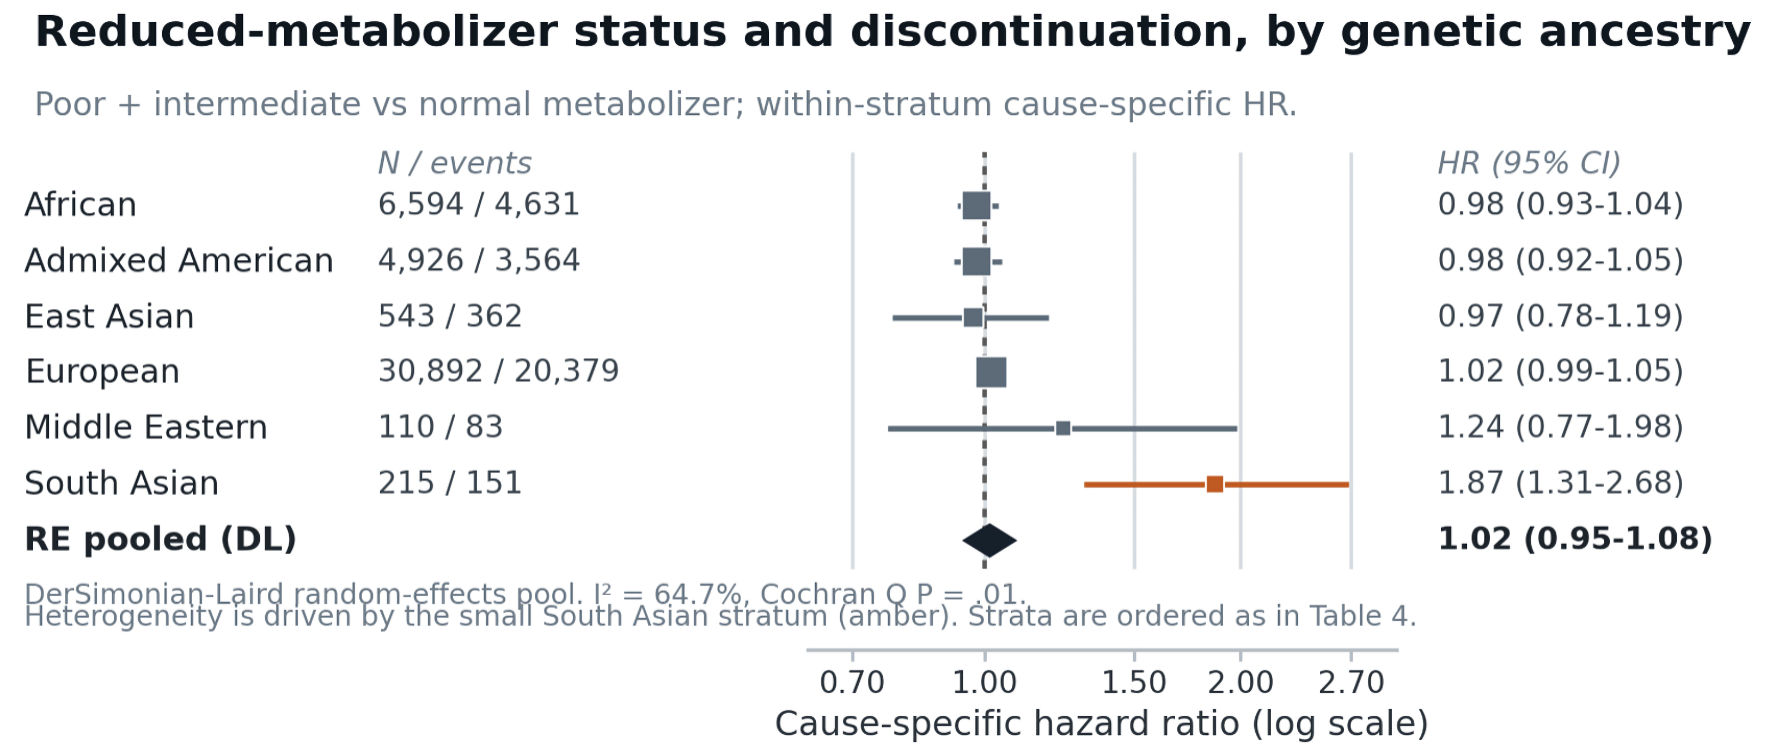
| Genetic ancestry | N | Events | HR (95% CI) |
|---|---|---|---|
| Between-stratum heterogeneity: I2 = 64.7%; Cochran Q P = 0.01. Random-effects (DerSimonian–Laird) pooled HR, 1.02 (95% CI, 0.95–1.08). The significant heterogeneity was driven by the small South Asian stratum; a fixed-effect pooled estimate is not an appropriate summary (see Results). Because the strata are mutually exclusive groups within a single cohort, the Cochran Q test is the formal test of effect modification of the reduced-metabolizer contrast by genetic ancestry. Strata are listed alphabetically, and Figure 3 uses the same order. CI: confidence interval; HR: cause-specific hazard ratio; IM: intermediate metabolizer; NM: normal metabolizer; PM: poor metabolizer. | |||
| African | 6,594 | 4,631 | 0.98 (0.93–1.04) |
| Admixed American | 4,926 | 3,564 | 0.98 (0.92–1.05) |
| East Asian | 543 | 362 | 0.97 (0.78–1.19) |
| European | 30,892 | 20,379 | 1.02 (0.99–1.05) |
| Middle Eastern | 110 | 83 | 1.24 (0.77–1.98) |
| South Asian | 215 | 151 | 1.87 (1.31–2.68) |
| Characteristic | PM (n = 2,470) | IM (n = 16,687) | NM (n = 24,123) | UM (n = 1,205) | Max SMD |
|---|---|---|---|---|---|
| aGenetic-ancestry proportions differ across metabolizer groups by design, because CYP2D6 allele and phenotype frequencies vary by ancestral population; this structure motivated adjustment for genetic-ancestry principal components in all models and the ancestry-stratified analysis (Table 1), and it is not a balance failure. bBaseline heart rate was measured before metoprolol exposure and was used as a precision covariate only in the attained heart-rate model; it was not used as an adjustment covariate in the discontinuation or dose models (see Methods). The “Max SMD” column reports, for each categorical variable, the maximum absolute SMD across its categories versus normal metabolizers. The maximum SMD across the adjustment covariates (age, sex, indication, comorbidity, cotherapy, CYP2D6 inhibitor exposure, calendar year, and EHR density) was 0.089, indicating good balance across phenotype groups. Genetic ancestry is shown for cohort description and is excluded from this balance statement for the reason given above. Sex categories reflect the sex value recorded in the EHR; participants without a recorded value are shown as unknown or not reported. Rows reported as a single value followed by a percent sign indicate the percentage of participants within that phenotype column who have the characteristic; the denominators are the column Ns given in the header. Rows reported as n (%) give the count followed by the within-column percentage. AV: atrioventricular; bpm: beats per minute; COPD: chronic obstructive pulmonary disease; EHR: electronic health record; IM: intermediate metabolizer; NM: normal metabolizer; PM: poor metabolizer; SMD: standardized mean difference; UM: ultrarapid metabolizer; CYP2D6: cytochrome P450 2D6; SD: standard deviation; Max: maximum. | |||||
| Age at index, mean (SD), years | 60.3 (13.5) | 59.7 (13.8) | 59.1 (13.7) | 58.9 (14.2) | 0.086 |
| Sex, n (%) | 0.023 | ||||
| Female | 1,287 (52.1) | 8,747 (52.4) | 12,476 (51.7) | 627 (52.0) | |
| Male | 1,144 (46.3) | 7,634 (45.7) | 11,275 (46.7) | 556 (46.1) | |
| Unknown or not reported | 39 (1.6) | 306 (1.8) | 372 (1.5) | 22 (1.8) | |
| Genetic ancestry, n (%)a | 0.444 | ||||
| European | 2,121 (85.9) | 12,477 (74.8) | 16,294 (67.5) | 705 (58.5) | |
| African | 172 (7.0) | 2,409 (14.4) | 4,013 (16.6) | 270 (22.4) | |
| Admixed American | 170 (6.9) | 1,484 (8.9) | 3,272 (13.6) | 207 (17.2) | |
| East Asian | 1 (0.0) | 217 (1.3) | 325 (1.3) | 2 (0.2) | |
| South Asian | 4 (0.2) | 62 (0.4) | 149 (0.6) | 8 (0.7) | |
| Middle Eastern | 2 (0.1) | 38 (0.2) | 70 (0.3) | 13 (1.1) | |
| Baseline heart rate, mean (SD), bpmb | 77.2 (13.1) | 78.2 (13.7) | 78.4 (13.5) | 77.9 (13.0) | 0.089 |
| EHR density, mean (SD) | 16.4 (22.0) | 16.2 (21.9) | 16.3 (21.7) | 16.5 (22.7) | 0.006 |
| Follow-up, mean (SD), days | 1,525.3 (1,736.0) | 1,580.7 (1,807.7) | 1,552.7 (1,793.5) | 1,597.4 (1,830.8) | 0.025 |
| Calendar year of index, mean (SD) | 2,017.2 (5.1) | 2,017.1 (5.2) | 2,017.2 (5.2) | 2,016.8 (5.2) | 0.077 |
| Chronic kidney disease, % | 38.6 | 39.4 | 40.5 | 42.9 | 0.049 |
| COPD or asthma, % | 38.7 | 39.9 | 40.1 | 40.9 | 0.029 |
| Diabetes, % | 40.0 | 41.6 | 44.1 | 45.8 | 0.083 |
| Prior bradyarrhythmia, % | 21.5 | 19.2 | 18.0 | 16.4 | 0.088 |
| AV-nodal blocking cotherapy, % | 12.5 | 12.0 | 12.7 | 13.5 | 0.026 |
| Concomitant strong CYP2D6 inhibitor exposure, % | 10.1 | 9.1 | 8.8 | 9.3 | 0.047 |
| Concomitant moderate CYP2D6 inhibitor exposure, % | 6.0 | 5.8 | 5.7 | 4.1 | 0.074 |
| Metoprolol indication, n (%) | 0.072 | ||||
| Heart failure | 797 (32.3) | 5,438 (32.6) | 8,153 (33.8) | 411 (34.1) | |
| Hypertension | 770 (31.2) | 5,099 (30.6) | 7,433 (30.8) | 353 (29.3) | |
| Atrial fibrillation | 395 (16.0) | 2,548 (15.3) | 3,460 (14.3) | 150 (12.4) | |
| Acute myocardial infarction | 139 (5.6) | 1,106 (6.6) | 1,544 (6.4) | 90 (7.5) | |
| Angina | 142 (5.7) | 942 (5.6) | 1,388 (5.8) | 91 (7.6) | |
| Other or unknown | 227 (9.2) | 1,554 (9.3) | 2,145 (8.9) | 110 (9.1) | |
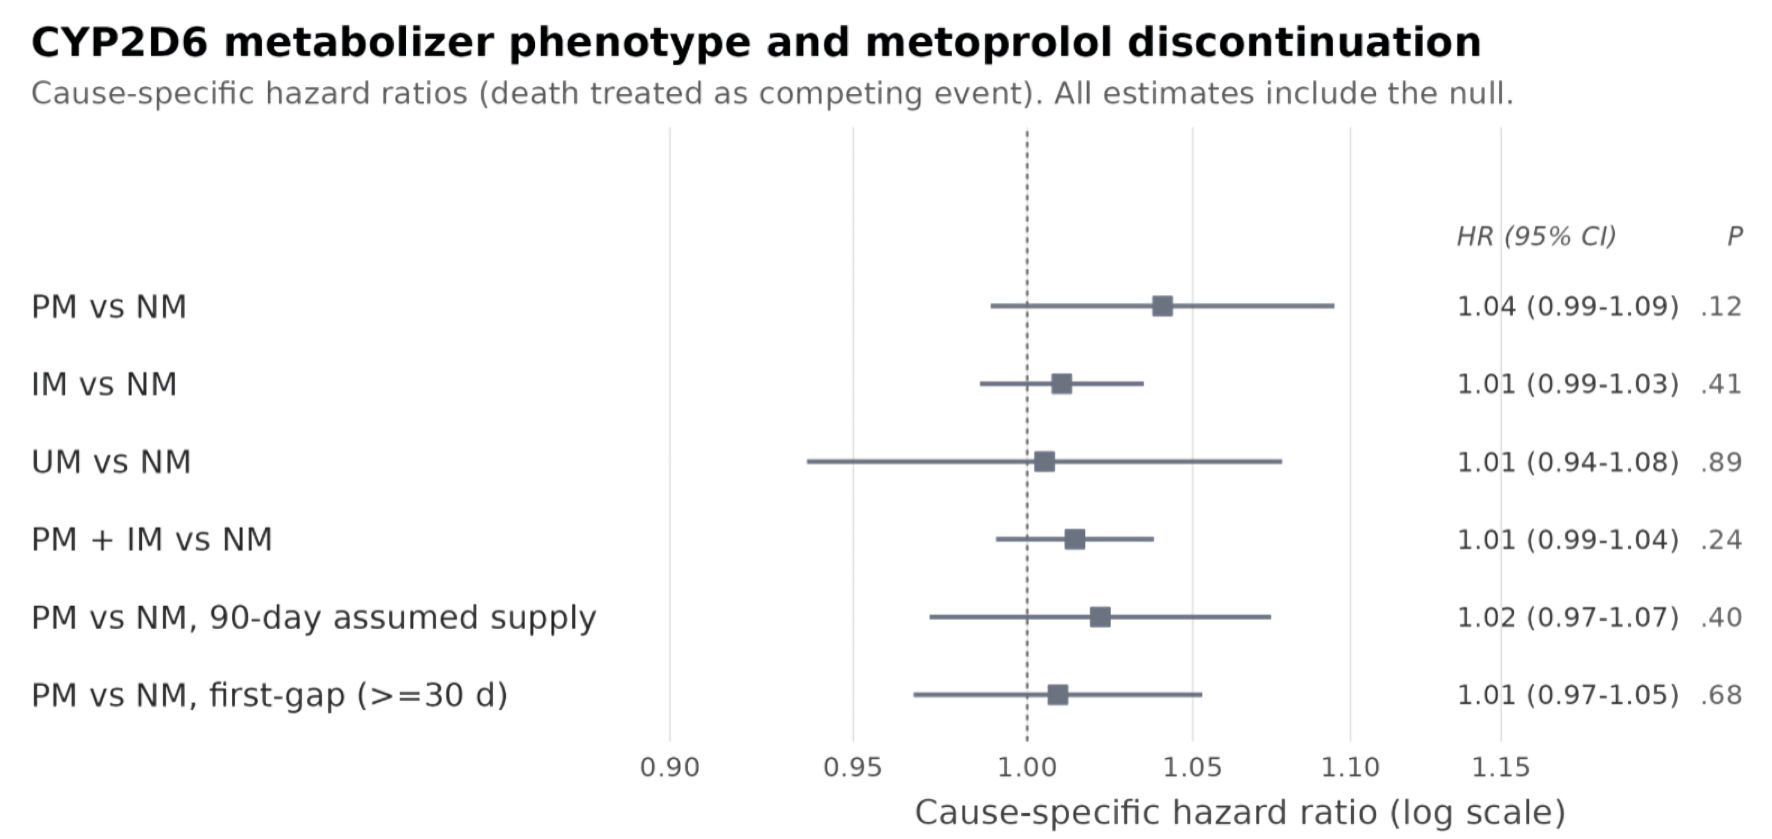
| Analysis/definition | N | Events (rate) | Contrast | HR (95% CI) | P value |
|---|---|---|---|---|---|
| Death (629 events; 1.4%) was treated as a competing event and censored in the cause-specific models. Crude discontinuation under the primary definition was 67.4% (29,170 of 43,280) among poor, intermediate, and normal metabolizers combined and 68.8% (829 of 1,205) among ultrarapid metabolizers. The eligibility requirement for at least two dispensings defines the target population as patients who continued beyond a first fill (see Methods and Limitations). CI: confidence interval; HR: cause-specific hazard ratio; IM: intermediate metabolizer; NM: normal metabolizer; PM: poor metabolizer; UM: ultrarapid metabolizer; CYP2D6: cytochrome P450 2D6. | |||||
| Primary (terminal-gap) | 44,485 | 29,999 (67.4%) | PM vs NM | 1.04 (0.99–1.09) | 0.12 |
| IM vs NM | 1.01 (0.99–1.03) | 0.41 | |||
| UM vs NM | 1.01 (0.94–1.08) | 0.89 | |||
| Reduced metabolizer | 43,280 | 29,170 (67.4%) | PM + IM vs NM | 1.01 (0.99–1.04) | 0.24 |
| Sensitivity: 90-day assumed supply | 43,336 | 30,504 (70.4%) | PM vs NM | 1.02 (0.97–1.07) | 0.40 |
| IM vs NM | 1.00 (0.98–1.03) | 0.86 | |||
| UM vs NM | 0.99 (0.92–1.06) | 0.75 | |||
| Sensitivity: first gap (≥ 30 days) | 43,336 | 42,556 (98.2%) | PM vs NM | 1.01 (0.97–1.05) | 0.68 |
| IM vs NM | 1.01 (0.99–1.03) | 0.52 | |||
| UM vs NM | 1.04 (0.98–1.11) | 0.17 | |||
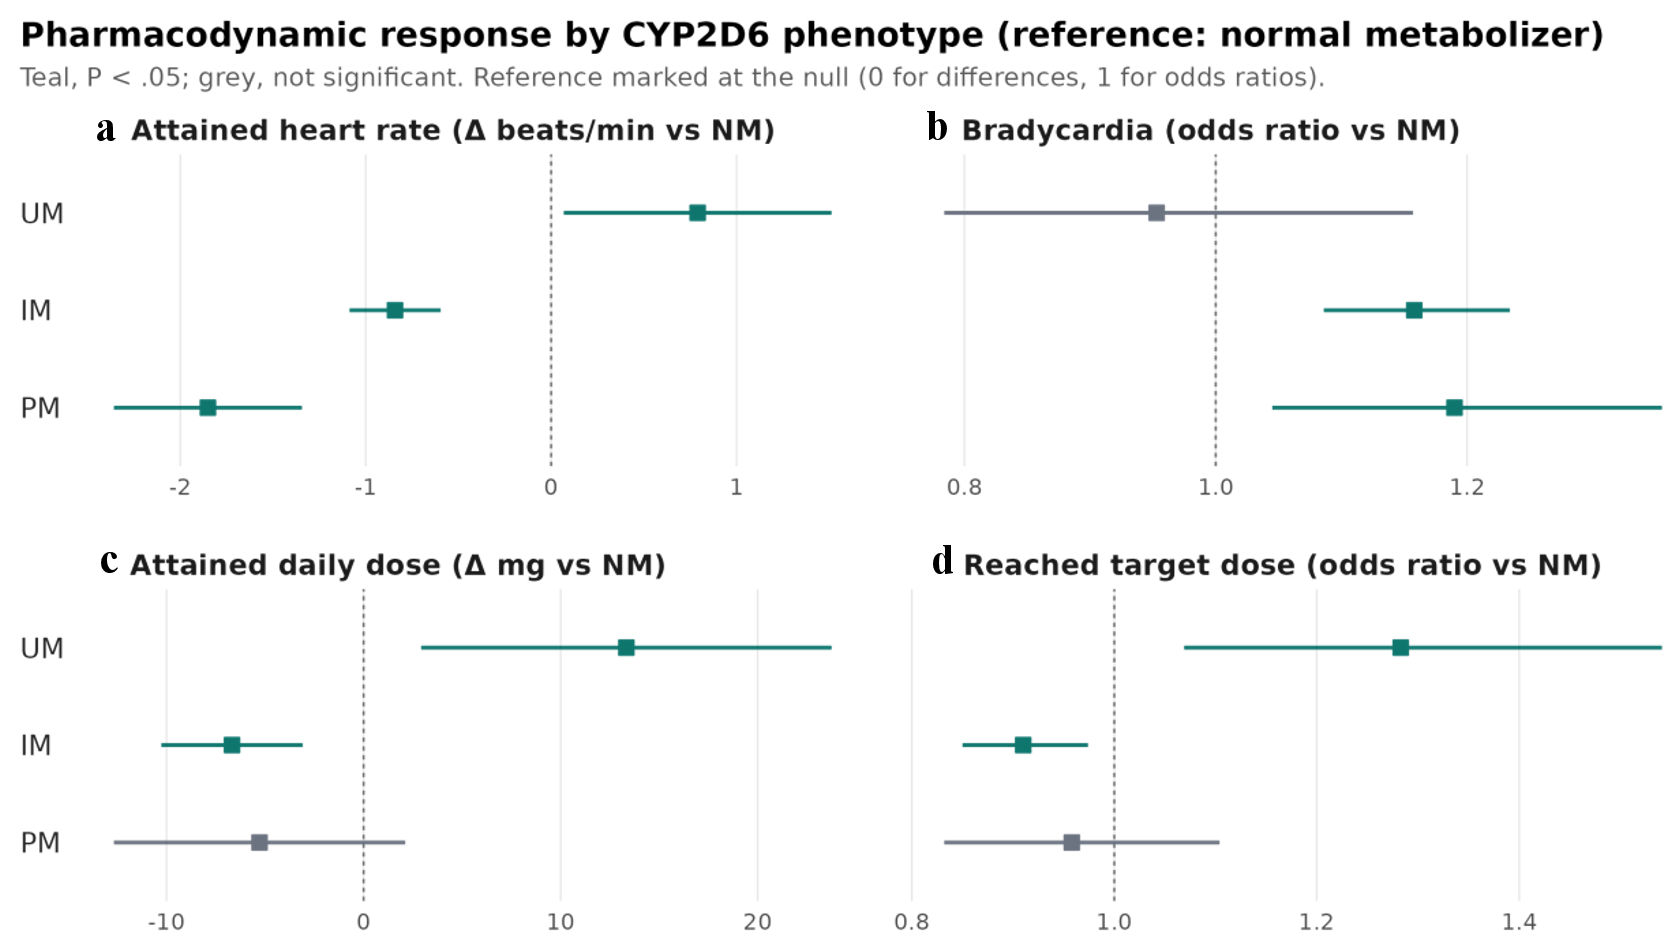
| Outcome (model) | Contrast | Estimate (95% CI) | P value |
|---|---|---|---|
| aThe attained heart-rate model additionally adjusted for baseline (pre-exposure) heart rate. No adjustment for multiple comparisons was applied; the contrasts that survive a Bonferroni correction across the 12 secondary comparisons are identified in the Results. CI: confidence interval; IM: intermediate metabolizer; NM: normal metabolizer; OR: odds ratio; PM: poor metabolizer; UM: ultrarapid metabolizer; CYP2D6: cytochrome P450 2D6. | |||
| Attained on-treatment heart rate, bpm (linear)a | PM vs NM | −1.85 (−2.36 to −1.34) | < 0.001 |
| IM vs NM | −0.84 (−1.09 to −0.60) | < 0.001 | |
| UM vs NM | +0.79 (0.07 to 1.51) | 0.03 | |
| Bradycardia (logistic), OR | PM vs NM | 1.19 (1.05–1.36) | 0.009 |
| IM vs NM | 1.16 (1.09–1.23) | < 0.001 | |
| UM vs NM | 0.95 (0.78–1.16) | 0.62 | |
| Attained maximum daily dose, mg (linear) | PM vs NM | −5.28 (−12.67 to 2.11) | 0.16 |
| IM vs NM | −6.68 (−10.26 to −3.09) | < 0.001 | |
| UM vs NM | +13.33 (2.92 to 23.75) | 0.01 | |
| Reached target dose (logistic), OR | PM vs NM | 0.96 (0.83–1.10) | 0.55 |
| IM vs NM | 0.91 (0.85–0.97) | 0.006 | |
| UM vs NM | 1.28 (1.07–1.54) | 0.008 | |