Journal of Clinical Medicine Research, ISSN 1918-3003 print, 1918-3011 online, Open Access
Article copyright, the authors; Journal compilation copyright, J Clin Med Res and Elmer Press Inc
Journal website https://jocmr.elmerjournals.com

Original Article

Volume 18, Number 9, September 2026, pages 679-686


Nutritional Status in Multiple Sclerosis, Neuromyelitis Optica Spectrum Disorder, and Myelin Oligodendrocyte Glycoprotein Antibody-Associated Disease

Figures

↓  Figure 1. The nutritional status of patients is categorized by the MNA score. (a) Bar graph of the mean MNA score between each group. (b) Bar graph of the proportions of nutritional status of healthy controls, MS, NMOSD, and MOGAD patients. MNA: Mini Nutritional Assessment; MOGAD: myelin oligodendrocyte glycoprotein antibody-associated disease; MS: multiple sclerosis; NMOSD: neuromyelitis optica spectrum disorder.
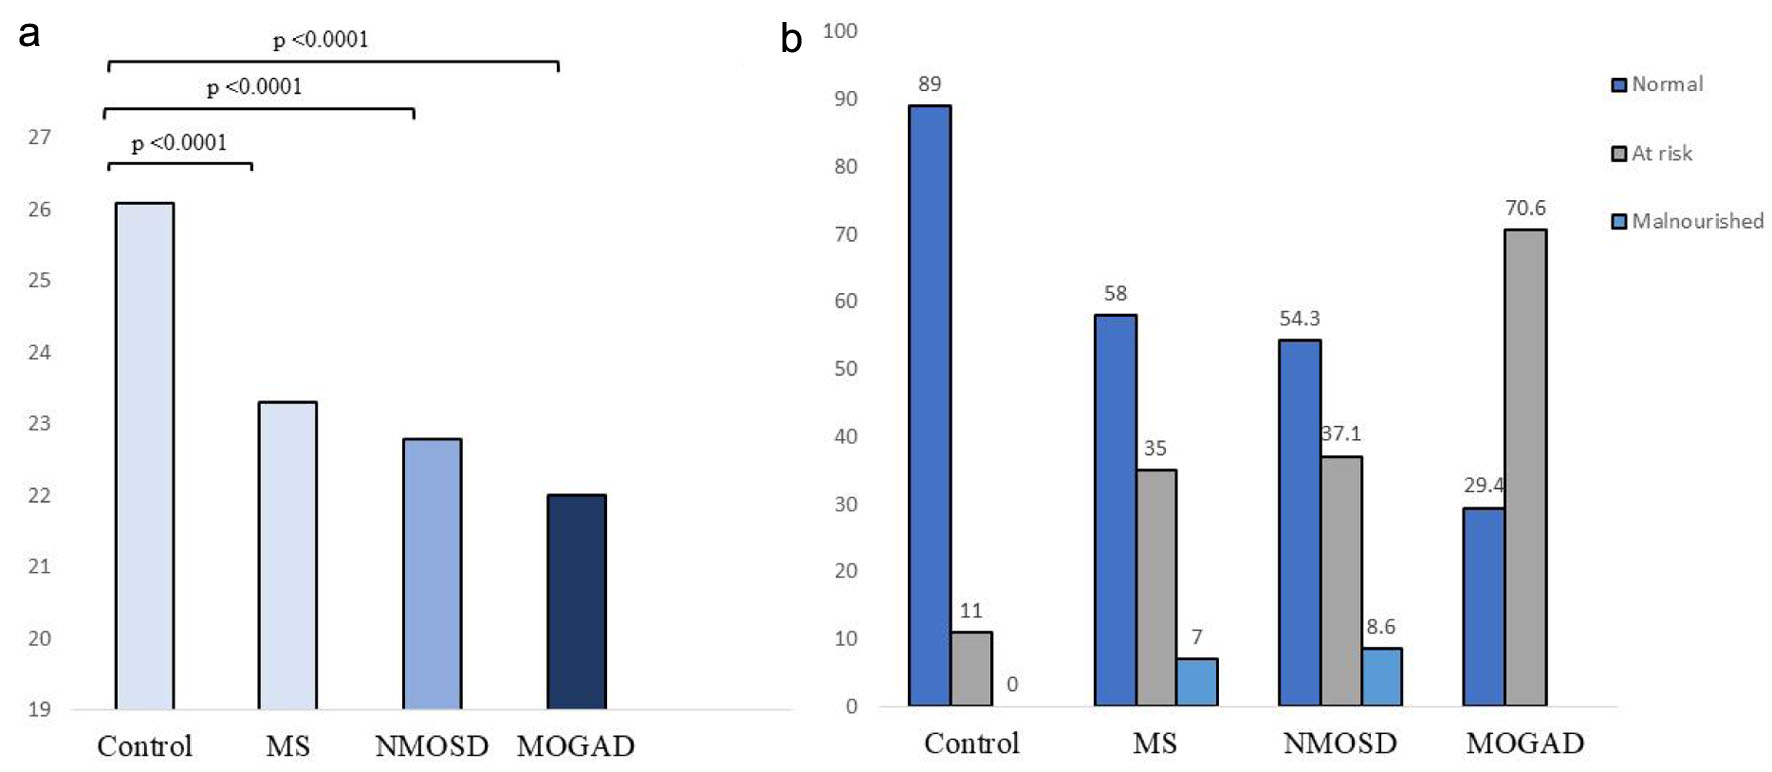
Figure 1.
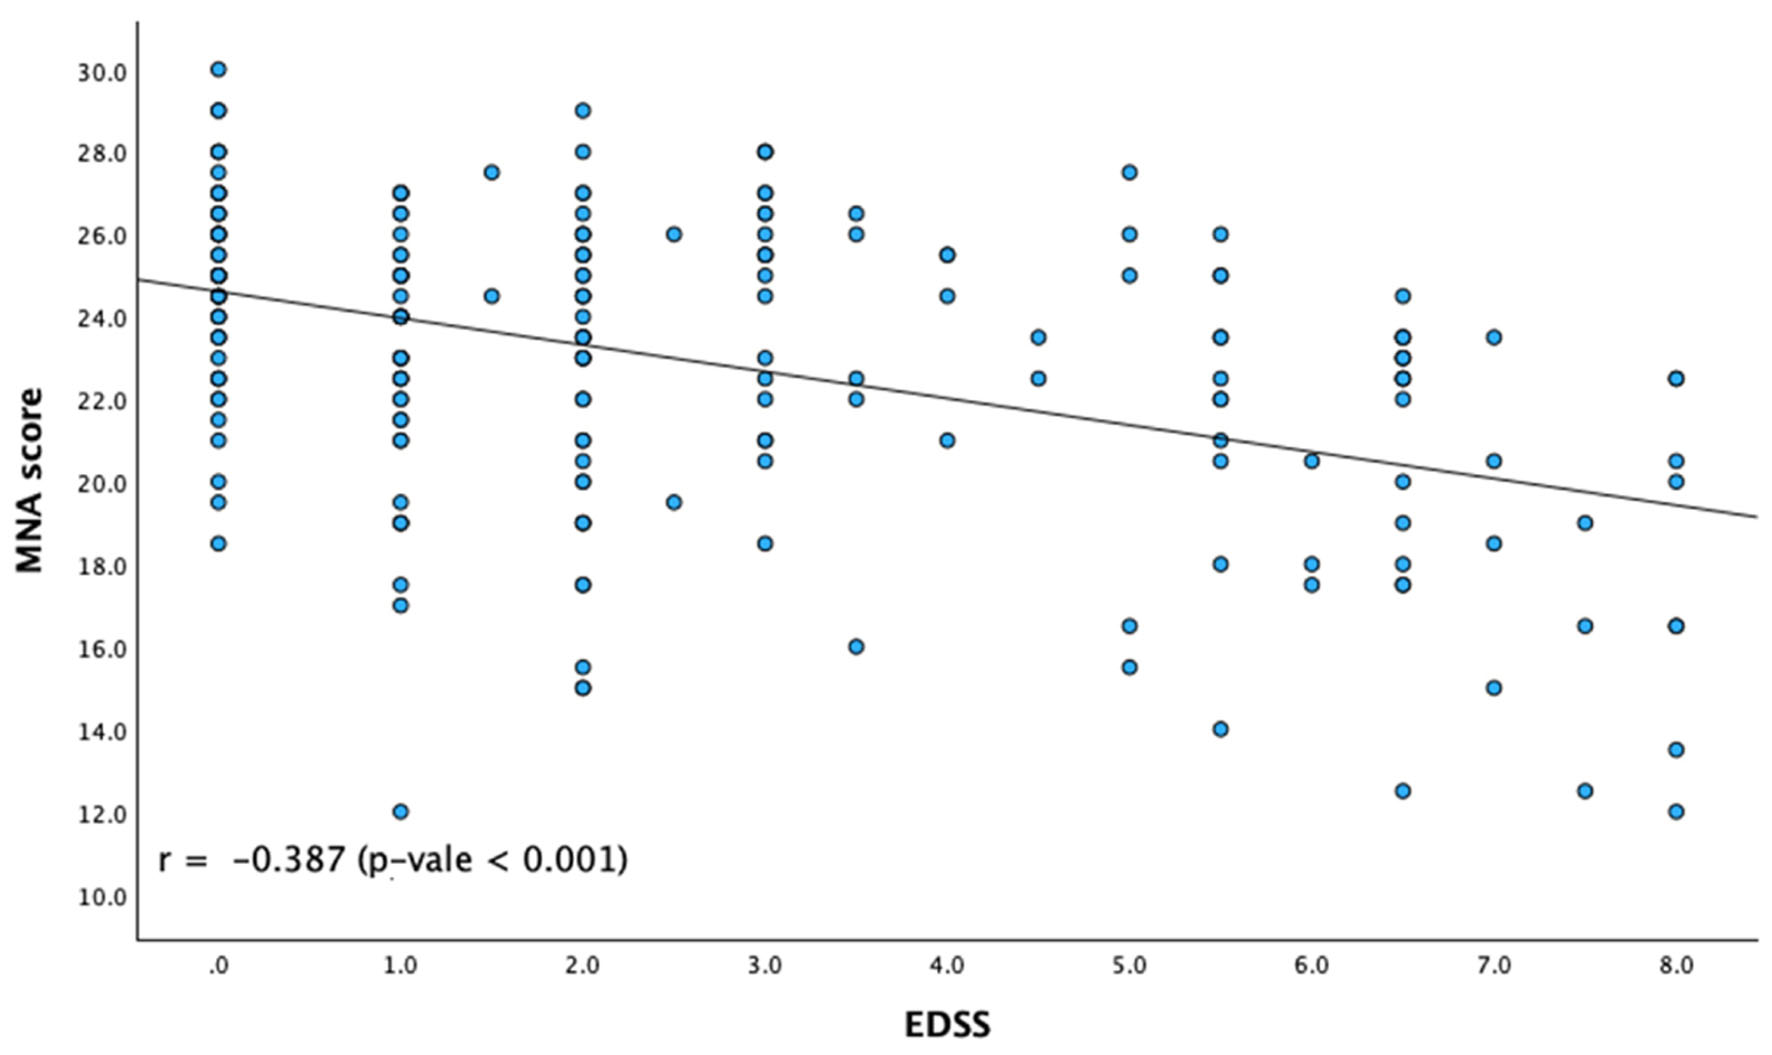
↓  Figure 2. Correlation between clinical disability and nutritional status. The scatter plot demonstrates the relationship between EDSS scores and MNA scores across the demyelinating disease cohorts. EDSS: Expanded Disability Status Scale; MNA: Mini Nutritional Assessment.
Figure 2.

Tables

↓  Table 1. Demographic Data and Baseline Characteristics Among Patients With Central Nervous System Demyelinating Diseases
 
CharacteristicsHealthy controls (n = 100)Total (n = 222)MS (n = 100)NMOSD (n = 105)MOGAD (n = 17)P-value
ARR: annualized relapsed rate; BMI: body mass index; EDSS: Expanded Disability Status Scale; IQR: interquartile range; MOGAD: myelin oligodendrocyte glycoprotein antibody-associated disease; MS: multiple sclerosis; NA: not available; NMOSD: neuromyelitis optica spectrum disorder; SD: standard deviation.
Age at recruitment (years), mean ± SD46.3 ± 3.346.2 ± 15.240.0 ± 12.852.5 ± 14.343.9 ± 18.2< 0.001
Age of onset (years), mean ± SDNA35.7 ± 14.930.3 ± 11.840.7 ± 15.836.6 ± 14.9< 0.001
Female sex, n (%)85 (85.0)188 (84.7)76 (76.0)101 (96.2)11 (64.7)< 0.001
BMI (kg/m2), mean ± SD24.1 ± 4.923.5 ± 5.023.4 ± 5.023.4 ± 4.925.0 ± 6.10.448
Weight (kg), mean ± SD62.4 ± 5.460.7 ± 14.262.2 ± 13.858.4 ± 13.065.6 ± 6.10.053
Number of attacks, median (IQR)NA3.0 (1.0–5.0)2.0 (1.0–3.5)3.0 (1.0–6.0)3.0 (1.0–5.0)0.039
ARR, median (IQR)NA0.4 (0.2–0.7)0.4 (0.2–0.7)0.4 (0.2–0.63)0.6 (0.3–1.0)0.164
Disease duration (years), median (IQR)NA8.5 (3.9–14.5)6.7 (3.2–13.7)10.9 (5.0–15.3)5.7 (1.5–9.6)0.017
Duration from last attacks (years), median (IQR)NA3.7 (1.7–7.9)3.5 (1.8–7.9)4.2 (1.9–8.2)2.3 (1.7–6.3)0.647
EDSS, median (IQR)NA2.0 (1.0–4.0)1.0 (0.0–3.0)3.0 (1.0–5.5)1.0 (1.0–2.0)0.01
No treatment, n (%)NA19 (8.6)13 (13.0)3 (2.9)3 (17.6)0.001
Prednisolone, n (%)NA0 (0.0)0 (0.0)0 (0.0)2 (11.8)0.006
Azathioprine, n (%)NA75 (33.8)20 (20)45 (42.9)10 (58.8)< 0.001
Mycophenolate mofetil, n (%)NA25 (11.3)8 (8.0)15 (14.3)2 (11.8)0.362
Rituximab, n (%)NA82 (36.9)42 (42.0)40 (38.1)0 (0.0)0.004
Fingolimod, n (%)NA9 (4.1)9 (9.0)0 (0.0)0 (0.0)0.003
Glatiramer acetate, n (%)NA1 (0.5)1 (1.0)0 (0.0)0 (0.0)0.542
Natalizumab, n (%)NA1 (0.5)1 (1.0)0 (0.0)0 (0.0)0.542
Satralizumab, n (%)NA2 (0.9)0 (0.0)2 (1.9)0 (0.0)0.325
Teriflunomide, n (%)NA4 (1.8)4 (4.0)0 (0.0)0 (0.0)0.083
Dimethyl fumarate, n (%)NA2 (0.9)2 (2.0)0 (0.0)0 (0.0)0.292


↓  Table 2. Univariate and Multivariate Poisson Regression to Predict the Risk of Malnutrition and Patients at Risk of Malnutrition
 
Univariate regressionMultivariate regression
Crude PR 95%CIP-valueAdjusted PR (95% CI)P-value
Adjusted PRs were calculated using a stepwise multivariate model adjusting for diagnosis subtype, number of attacks, disease duration, BMI, and EDSS scores. Variables with a univariate P value < 0.10 that did not remain significant in the final model following stepwise selection are designated as not applicable (NA). BMI: body mass index; CI: confidence interval; DMT: disease-modifying therapy; EDSS: Expanded Disability Status Scale; MOGAD: myelin oligodendrocyte glycoprotein antibody-associated disease; MS: multiple sclerosis; NMOSD: neuromyelitis optica spectrum disorder; PR: prevalence ratio.
Diagnosis
  MSRefRefRefRef
  NMOSD1.09 (0.80–1.48)0.5940.94 (0.72–1.23)0.635
  MOGAD1.68 (1.15–2.47)0.0082.02 (1.49–2.93)< 0.001
Sex
  MaleRefRef
  Female1.24 (0.79–1.95)0.357
Concurrent tumors/malignancy1.22 (0.67–2.23)0.519
Concurrent psychiatric disorders1.63 (1.10–2.42)0.014NANA
Preexisting cardiometabolic risk factors1.03 (0.77–1.37)0.859
Number of attacks1.04 (1.01–1.05)< 0.0011.01 (0.99–1.02)0.228
Age1.01 (0.97–1.02)0.206
Disease duration1.02 (1.00–1.03)0.0641.01 (0.99–1.02)0.377
Lower BMI (continuous)1.11 (1.08–1.14)< 0.0011.09 (1.06–1.14)< 0.001
EDSS1.16 (1.11–1.21)< 0.0011.13 (1.08–1.19)< 0.001
Treatment categories
  No treatmentRefRef
  Low-moderate efficacy DMT1.18 (0.66–2.11)0.584
  High efficacy DMT1.30 (0.72–2.33)0.385