Journal of Clinical Medicine Research, ISSN 1918-3003 print, 1918-3011 online, Open Access
Article copyright, the authors; Journal compilation copyright, J Clin Med Res and Elmer Press Inc
Journal website https://jocmr.elmerjournals.com

Original Article

Volume 18, Number 8, August 2026, pages 585-598


Incidence and Predictors of Anticoagulant-Associated Bleeding in Patients With Venous Thromboembolism

Figure

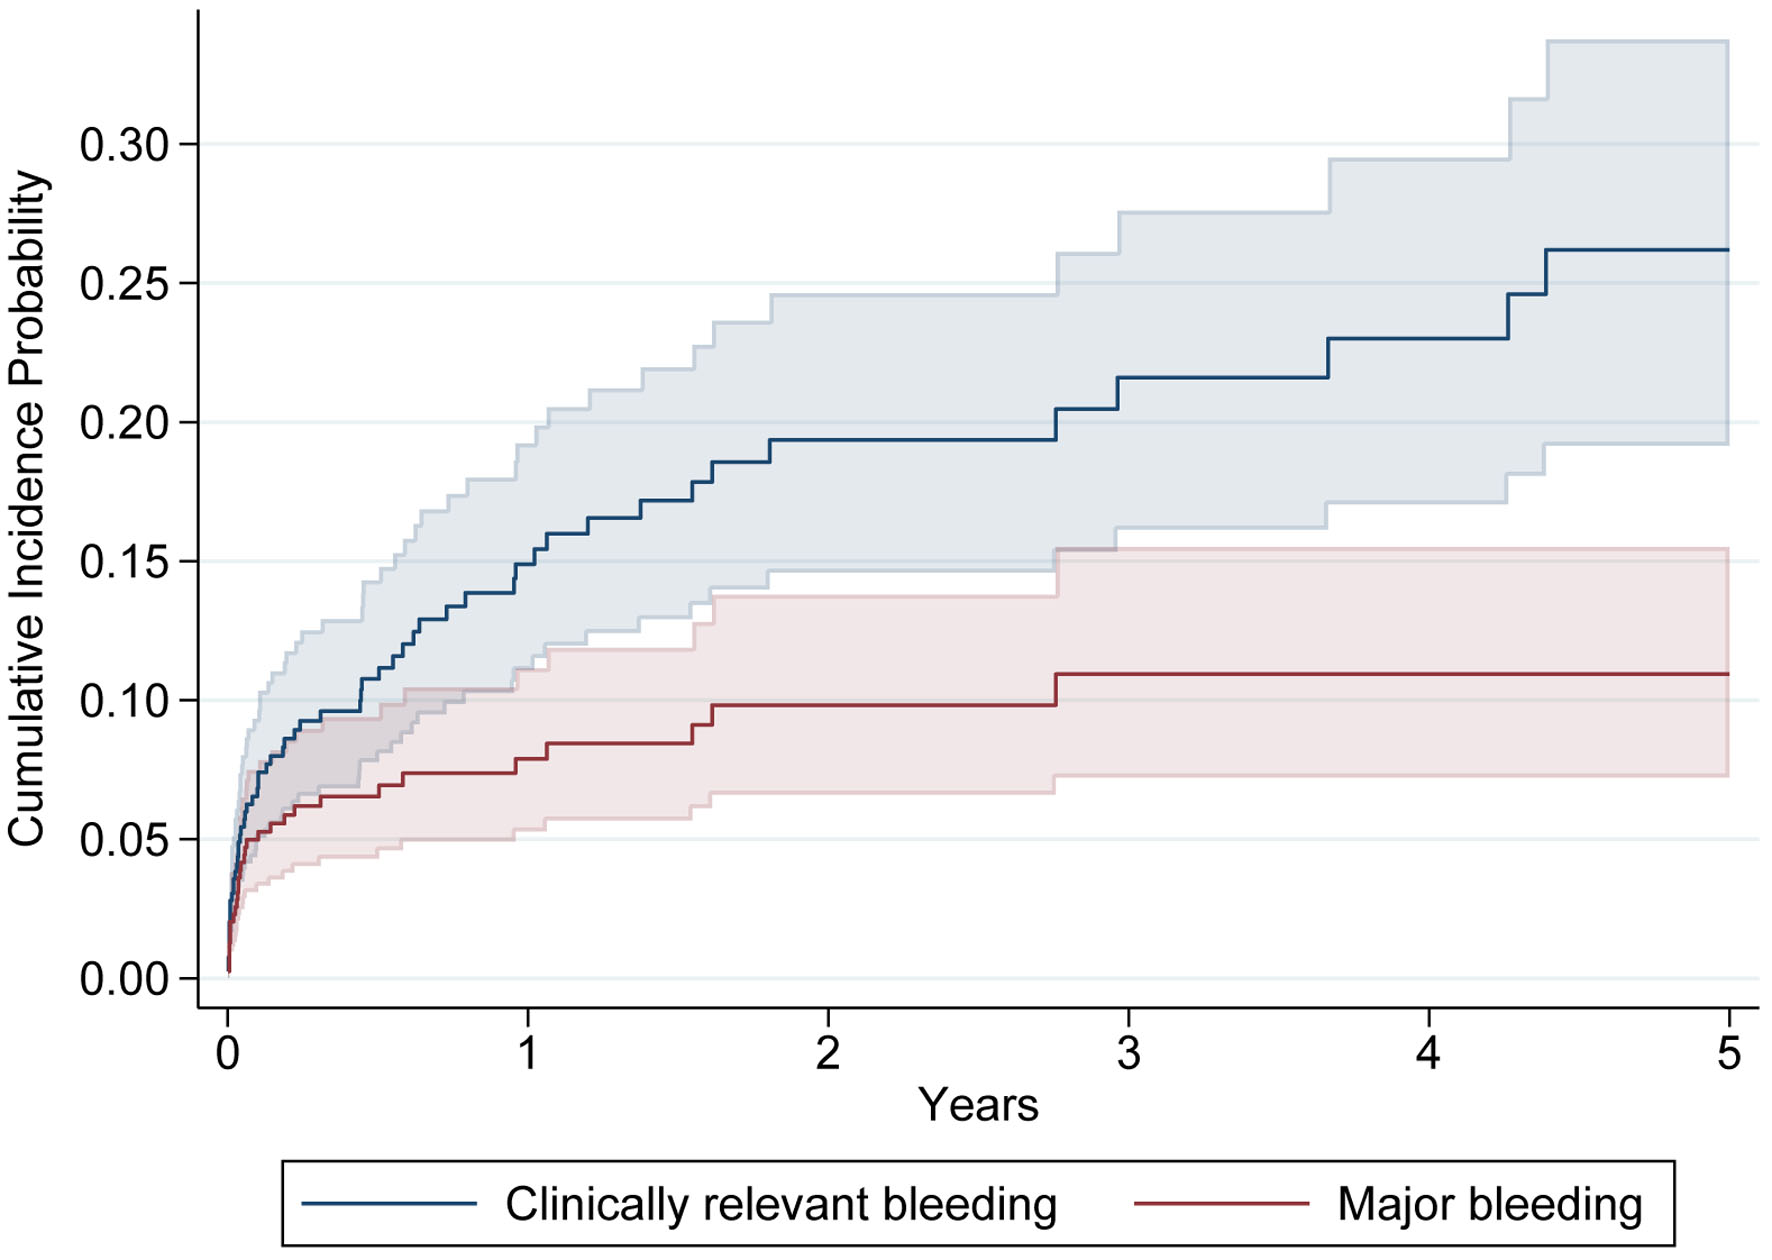
↓  Figure 1. Cumulative incidence of clinically relevant bleeding and major bleeding estimated using the Aalen–Johansen method. For CRB, death was treated as a competing event. For MB, CRNMB and death were treated as competing events; therefore, the cumulative incidence represents the probability of experiencing MB as the first bleeding event. Shaded areas represent the 95% confidence intervals. CRB: clinically relevant bleeding; MB: major bleeding; CRNMB: clinically relevant non-major bleeding.
Figure 1.

Tables

↓  Table 1. Baseline Characteristics
 
CharacteristicsTotalClinically relevant bleedingNo bleedingP value
aECOG performance status was available for 270 patients. bProcedural bleeding risk was stratified according to ISTH guidance statements. cProvoking factors other than cancer-associated thrombosis. dHemoglobin levels and platelet counts were available for 366 patients. eSerum creatinine was available for 360 patients. BMI: body mass index; NSAID: nonsteroidal anti-inflammatory drug; VTE: venous thromboembolism; DVT: deep vein thrombosis; PE: pulmonary embolism; Hb: hemoglobin; eGFR: estimated glomerular filtration rate; LMWH: low-molecular-weight heparin; UFH: unfractionated heparin; DOAC: direct oral anticoagulant; IQR: interquartile range; ECOG: Eastern Cooperative Oncology Group.
N (%)395 (100)60 (15.19)335 (84.81)
Age, years60.71 ± 16.2267.39 ± 15.6759.52 ± 16.040.001
  ≥ 65, n (%)159 (40.25)37 (61.67)122 (36.42)< 0.001
Sex, n (%)1.000
  Female258 (65.32)39 (65.00)219 (65.37)
  Male137 (34.68)21 (35.00)116 (34.63)
Weight, median (IQR), kg59.5 (50.1–70.0), n = 35353 (48–66), n = 5160 (52–70), n = 3020.021
Height, median (IQR), cm160 (155–167), n = 347160 (155–165.5), n = 52160 (155–167), n = 2950.970
BMI, median (IQR), kg/m223.44 (20.70–26.16), n = 33222.21 (19.72–24.80), n = 4723.61 (20.82–26.35), n = 2850.021
  < 18.538 (11.45)7 (14.89)31 (10.88)0.457
  < 2064 (19.28)15 (31.91)49 (17.19)0.027
ECOGa performance status, n (%)0.002
  0–1255 (94.44)32 (82.05)223 (96.54)
  ≥ 215 (5.56)7 (17.95)8 (3.46)
Comorbidity, n (%)
  Diabetes mellitus83 (21.01)14 (23.33)69 (20.60)0.609
  Hypertension140 (35.44)27 (45.00)113 (33.73)0.107
  Coronary artery disease11 (2.78)4 (6.67)7 (2.09)0.069
  Cerebrovascular disease18 (4.56)7 (11.67)11 (3.28)0.011
  Chronic liver disease/cirrhosis9 (2.28)1 (1.67)8 (2.39)1.000
  Chronic kidney disease31 (7.85)6 (10.00)25 (7.46)0.445
  Peripheral arterial disease4 (1.01)1 (1.67)3 (0.90)0.484
Active cancer, n (%)172 (43.54)26 (43.33)146 (43.58)1.000
  Solid malignancy159 (92.44)24 (92.31)135 (92.47)
  Hematologic malignancy13 (7.56)2 (7.69)11 (7.53)
Alcohol use, n (%)5 (1.37)2 (3.33)3 (0.90)0.167
Medication, n (%)
  Antiplatelet0.002
    Aspirin (ASA)21 (5.32)8 (13.33)13 (3.88)
    Clopidogrel3 (0.76)1 (1.67)2 (0.60)
    Dual antiplatelets7 (1.77)3 (5.00)4 (1.19)
  NSAIDs2 (0.51)1 (1.67)1 (0.30)0.281
Oral contraceptives or hormone therapy, n (%)8 (2.03)0 (0.00)8 (2.39)0.613
  Estrogen1 (0.25)0 (0.00)1 (0.30)
  Progestin0 (0.00)0 (0.00)0 (0.00)
  Estrogen and progestin5 (1.26)0 (0.00)5 (1.49)
  Androgen0 (0.00)0 (0.00)0 (0.00)
  Unknown2 (0.51)0 (0.00)2 (0.60)
History of surgery within 3 months before initiation of anticoagulation, n (%)59 (14.94)8 (13.33)51 (15.22)0.845
  Bleeding risk of procedureb, n (%)0.407
    Low to moderate bleeding risk44 (74.58)5 (62.50)39 (76.47)
    High bleeding risk15 (25.42)3 (37.50)12 (23.53)
History of bleeding within 3 months before initiation of anticoagulation, n (%)0.082
  Clinically relevant non-major bleeding8 (2.03)1 (1.67)7 (2.09)
  Major bleeding6 (1.52)3 (5.00)3 (0.90)
Type of VTE, n (%)0.106
  DVT146 (36.96)22 (36.67)124 (37.01)
  PE191 (48.35)24 (40.00)167 (49.85)
  Both DVT and PE58 (14.68)14 (23.33)44 (13.13)
VTE classification, n (%)0.966
  Unprovoked143 (36.20)21 (35.00)122 (36.42)
  Provokedc80 (20.25)13 (21.67)67 (20.00)
  Cancer-associated thrombosis (CAT)172 (43.54)26 (43.33)146 (43.58)
Thrombophilia workup, n (%)1.000
  Normal/negative145 (36.71)22 (36.67)123 (36.72)
  Protein C deficiency1 (0.25)0 (0.00)1 (0.30)
  Antithrombin deficiency1 (0.25)0 (0.00)1 (0.30)
  Antiphospholipid syndrome (APS)14 (3.54)2 (3.33)12 (3.58)
  No workup234 (59.24)36 (60.00)198 (59.10)
Anticoagulants, n (%)
  Individual agents0.071
    Warfarin129 (32.66)19 (31.67)110 (32.84)
    UFH13 (3.29)3 (5.00)10 (2.99)
    LMWH154 (38.99)25 (41.67)129 (38.51)
    Apixaban50 (12.66)3 (5.00)47 (14.03)
    Rivaroxaban28 (7.09)3 (5.00)25 (7.46)
    Edoxaban17 (4.30)5 (8.33)12 (3.58)
    Dabigatran4 (1.01)2 (3.33)2 (0.60)
  Type of anticoagulant0.628
    DOACs99 (25.06)13 (21.67)86 (25.67)
    Non-DOACs296 (74.94)47 (78.33)249 (74.33)
Laboratory at VTE diagnosis
Hbd, g/dL11.05 ± 2.1810.57 ± 2.1411.14 ± 2.180.067
  Anemia, n (%)253 (69.13)45 (77.59)208 (67.53)0.163
  < 10, n (%)117 (31.97)24 (41.38)93 (30.19)0.124
Plateletsd, median (IQR), /µL250,500 (187,000–334,000)240,500 (175,000–369,000)252,500 (189,500–328,000)0.921
Creatininee, median (IQR), mg/dL0.78 (0.61–1.04)0.79 (0.6–1.1)0.77 (0.61–1)0.396
eGFRe, median (IQR), mL/min/1.73 m292.28 (66.85–105.42)80.77 (55.10–98.20)93.56 (71.18–106.08)0.010
  ≥ 30, n (%)341 (94.72)53 (91.38)288 (95.36)
  ≥ 15 to < 30, n (%)16 (4.44)4 (6.90)12 (3.97)
  < 15, n (%)3 (0.83)1 (1.72)2 (0.66)


↓  Table 2. Doses of Anticoagulants Used in the Study Population
 
AnticoagulantsTotalClinically relevant bleedingNo bleedingP value
aTTR (%) was calculated using the traditional (direct) method based on the proportion of INR values within the therapeutic range for up to 1 year after warfarin initiation. LMWH: low-molecular-weight heparin; UFH: unfractionated heparin; DOAC: direct oral anticoagulant; TTR: time in therapeutic range.
N (%)395 (100)60 (15.19)335 (84.81)
Warfarin, n (%)129 (32.66)19 (31.67)110 (32.84)
  TTRa, median (IQR), %30.0 (16.8–50.0), n = 10036.8 (5.0–60.0), n = 1528.0 (19.0–50.0), n = 850.831
UFH, n (%)13 (3.29)3 (5.00)10 (2.99)
LMWH, n (%)154 (38.99)25 (41.67)129 (38.51)
  Therapeutic dose150 (37.97)25 (41.67)125 (37.31)
  Intermediate dose2 (0.51)0 (0.00)2 (0.6)
  Prophylaxis dose (e.g., enoxaparin 40 mg daily)2 (0.51)0 (0.00)2 (0.6)
DOACs, n (%)99 (25.06)13 (21.67)86 (25.67)
  Dabigatran 110 mg twice daily2 (0.51)1 (1.67)1 (0.30)
  Dabigatran 150 mg twice daily2 (0.51)1 (1.67)1 (0.30)
  Apixaban 2.5 mg twice daily15 (3.80)0 (0.00)15 (4.48)
  Apixaban 5 mg twice daily34 (8.61)3 (5.00)31 (9.25)
  Apixaban 10 mg twice daily1 (0.25)0 (0.00)1 (0.30)
  Rivaroxaban 20 mg once daily19 (4.81)1 (1.67)18 (5.37)
  Rivaroxaban 15 mg twice daily3 (0.76)1 (1.67)2 (0.60)
  Rivaroxaban 10 mg once daily6 (1.52)1 (1.67)5 (1.49)
  Edoxaban 60 mg once daily12 (3.04)3 (5.00)9 (2.69)
  Edoxaban 30 mg once daily5 (1.27)2 (3.33)3 (0.90)


↓  Table 3. Baseline Characteristics of Patients With Active Cancer According to Clinically Relevant Bleeding Status
 
Primary cancer siteTotal (N = 172)Clinically relevant bleeding (N = 26)No bleeding (N = 146)
aBladder, renal cell carcinoma, and prostate cancer. bDiffuse large B-cell lymphoma, follicular lymphoma, extranodal marginal zone lymphoma, primary mediastinal B-cell lymphoma, and small lymphocytic lymphoma. cPrimary brain tumors and central nervous system germinoma. dSynchronous cecal and ovarian cancers.
Gynecological47 (27.33)11 (42.31)36 (24.66)
Lung34 (19.77)4 (15.38)30 (20.55)
Urologicala17 (9.88)2 (7.69)15 (10.27)
Colorectal14 (8.14)1 (3.85)13 (8.90)
Breast11 (6.40)2 (7.69)9 (6.16)
Lymphomab11 (6.40)1 (3.85)10 (6.85)
Cholangiocarcinoma6 (3.49)1 (3.85)5 (3.42)
Pancreatic6 (3.49)0 (0.00)6 (4.11)
Central nervous systemc4 (2.33)1 (3.85)3 (2.05)
Gastric3 (1.74)0 (0.00)3 (2.05)
Head and neck3 (1.74)2 (7.69)1 (0.68)
Thyroid3 (1.74)0 (0.00)3 (2.05)
Hepatocellular3 (1.74)0 (0.00)3 (2.05)
Multiple myeloma2 (1.16)1 (3.85)1 (0.68)
Bone and soft tissue sarcoma2 (1.16)0 (0.00)2 (1.37)
Esophageal1 (0.58)0 (0.00)1 (0.68)
Germ cell1 (0.58)0 (0.00)1 (0.68)
Gallbladder1 (0.58)0 (0.00)1 (0.68)
Two primary cancersd1 (0.58)0 (0.00)1 (0.68)
Primary peritoneal cancer1 (0.58)0 (0.00)1 (0.68)
Unknown primary1 (0.58)0 (0.00)1 (0.68)


↓  Table 4. Clinical Characteristics of Patients With Clinically Relevant Bleeding
 
CharacteristicsTotal bleeding (N = 60)Major bleeding (N = 32)Clinically relevant non-major bleeding (N = 28)P value
aPatients may have experienced bleeding at multiple sites. Percentages are calculated based on the total number of patients in each group, and the sum of patients by site may exceed the total N in each category. bPercentages were calculated using the number of patients in each column as the denominator. INR: international normalized ratio; IQR: interquartile range.
Time to first bleeding event, median (IQR), months1.95 (0.33–10.46)0.59 (0.16–4.88)5.98 (1.20–13.32)0.018
INR at bleeding event in warfarin users, median (IQR)2.66 (1.97–5.31), n = 173.45 (2.11–5.31), n = 92.33 (1.57–4.30), n = 80.370
Site of bleedinga, n (%)
  Upper gastrointestinal16 (26.67)10 (31.25)6 (21.43)0.559
  Lower gastrointestinal9 (15.00)5 (15.63)4 (14.29)1.000
  Central nervous system6 (10.00)6 (18.75)0 (0.00)0.026
  Musculoskeletal/skin16 (26.67)7 (21.88)9 (32.14)0.397
  Respiratory2 (3.33)1 (3.13)1 (3.57)1.000
  Genitourinary7 (11.67)3 (9.38)4 (14.29)0.695
  Other5 (8.33)1 (3.13)4 (14.29)0.175
Outpatient bleeding, n (%)40 (66.67)19 (59.38)21 (75.00)0.274
  Bleeding requiring hospital admission, n (%)24 (60.00)18 (94.74)6 (28.57)< 0.001
All-cause mortality, n (%)18 (30.00)12 (37.50)6 (21.43)0.259
  Bleeding-related mortalityb, n (%)1 (5.56)1 (8.33)0 (0.00)


↓  Table 5. Univariable and Multivariable Competing Risk Regression Analysis of Clinically Relevant Bleeding
 
PredictorUnivariable modelMultivariable modelc
Crude SHR (95% CI)P valueAdjusted SHR (95% CI)P value
aMissing data were handled via MICE; pooled estimates were calculated using Rubin’s rules. bPrior clinically relevant bleeding within 3 months before anticoagulation initiation. cMultivariable Fine–Gray subdistribution hazard model adjusted for age ≥ 65 years, BMI < 20 kg/m2, ECOG performance status ≥ 2, antiplatelet use, and non-DOAC therapy. BMI: body mass index; VTE: venous thromboembolism; DVT: deep vein thrombosis; PE: pulmonary embolism; Hb: hemoglobin; DOAC: direct oral anticoagulant; ECOG: Eastern Cooperative Oncology Group; SHR: sub-distribution hazard ratio; CI: confidence interval.
Age ≥ 65 years2.51 (1.50–4.20)< 0.0011.97 (1.12–3.45)0.018
Male1.03 (0.60–1.74)0.926
BMIa < 20 kg/m22.20 (1.25–3.88)0.0072.50 (1.36–4.61)0.003
ECOGa ≥ 23.86 (1.80–8.28)0.0013.05 (1.34–6.94)0.008
Diabetes mellitus1.11 (0.61–2.00)0.738
Hypertension1.50 (0.90–2.49)0.116
Coronary artery disease2.92 (0.99–8.63)0.052
Cerebrovascular disease2.92 (1.44–5.92)0.003
Chronic liver disease/cirrhosis0.76 (0.11–5.07)0.778
Chronic kidney disease1.30 (0.59–2.88)0.513
Peripheral arterial disease1.25 (0.19–8.26)0.817
Active cancer1.15 (0.69–1.92)0.589
Antiplatelet use3.54 (1.95–6.43)< 0.0013.48 (1.76–6.90)< 0.001
History of previous bleedingb1.58 (0.61–4.08)0.347
Non-DOAC therapy1.54 (0.84–2.82)0.1631.79 (0.98–3.26)0.057
Hba < 10 g/dL1.71 (1.03–2.87)0.040
Type of VTE
  DVTReference-
  PE0.90 (0.51–1.58)0.709
  Both DVT and PE1.76 (0.90–3.44)0.099


↓  Table 6. Univariable and Multivariable Time-Dependent Cox Regression Analysis of All-Cause Mortality
 
VariableUnivariable modelMultivariable modelc
Hazard ratio (95% CI)P valueAdjusted hazard ratio (95% CI)P value
aMissing data were handled via MICE; pooled estimates were calculated using Rubin’s rules. bPrior clinically relevant bleeding within 3 months before anticoagulation initiation. cMultivariable time-dependent Cox proportional hazards model adjusted for time-dependent bleeding status (CRNMB and major bleeding), age ≥ 65 years, chronic kidney disease, active cancer, non-DOAC therapy, and type of VTE. CRNMB: clinically relevant non-major bleeding; BMI: body mass index; VTE: venous thromboembolism; DVT: deep vein thrombosis; PE: pulmonary embolism; Hb: hemoglobin; DOAC: direct oral anticoagulant; ECOG: Eastern Cooperative Oncology Group; CI: confidence interval.
Bleeding status (time-dependent)
  No bleeding1.00 (Reference)-1.00 (Reference)-
  After CRNMB4.38 (1.86–10.30)0.0013.72 (1.55–8.92)0.003
  After major bleeding5.87 (3.13–11.00)< 0.0015.62 (2.91–10.85)< 0.001
Age ≥ 65 years1.50 (0.97–2.33)0.0661.52 (0.96–2.43)0.075
Male0.92 (0.58–1.46)0.723
BMIa < 20 kg/m21.58 (0.91–2.74)0.107
ECOGa ≥ 21.51 (0.58–3.95)0.402
Diabetes mellitus1.15 (0.69–1.91)0.588
Hypertension1.16 (0.74–1.81)0.515
Coronary artery disease1.80 (0.66–4.91)0.254
Cerebrovascular disease1.69 (0.74–3.88)0.216
Chronic liver disease/cirrhosis1.78 (0.56–5.65)0.327
Chronic kidney disease1.74 (0.90–3.37)0.1021.71 (0.85–3.42)0.131
Peripheral arterial disease1.02 (0.14–7.31)0.987
Active cancer3.06 (1.93–4.86)< 0.0012.93 (1.83–4.68)< 0.001
Antiplatelet use1.21 (0.58–2.52)0.605
History of previous bleedingb1.03 (0.33–3.28)0.954
Non-DOAC therapy3.10 (1.60–6.03)0.0012.76 (1.41–5.38)0.003
Hba < 10 g/dL1.87 (1.20–2.93)0.006
Type of VTE
  DVT1.00 (Reference)-1.00 (Reference)-
  PE2.48 (1.48–4.16)0.0012.16 (1.28–3.66)0.004
  Both DVT and PE1.38 (0.65–2.96)0.4031.08 (0.49–2.37)0.844