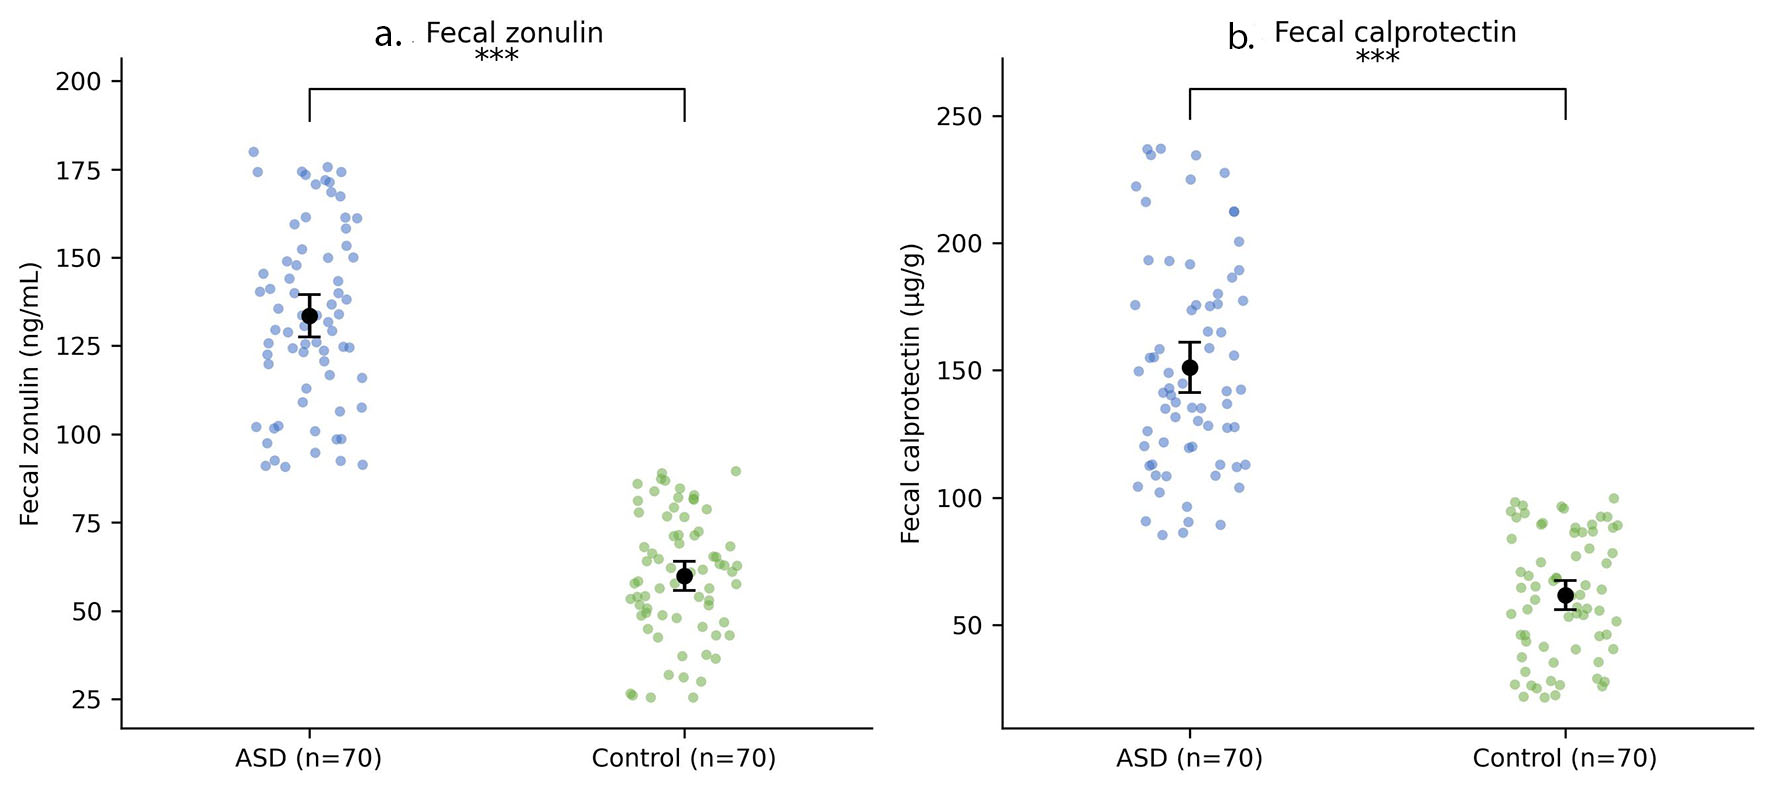
↓ Figure 1. Fecal zonulin (a) and fecal calprotectin (b) concentrations in children with ASD versus neurotypical controls (mean ± SD; ***P < 0.001). ASD: autism spectrum disorder; SD: standard deviation.
| Journal of Clinical Medicine Research, ISSN 1918-3003 print, 1918-3011 online, Open Access |
| Article copyright, the authors; Journal compilation copyright, J Clin Med Res and Elmer Press Inc |
| Journal website https://jocmr.elmerjournals.com |
Original Article
Volume 18, Number 10, October 2026, pages 759-769
Targeted Quantitative Polymerase Chain Reaction Analysis of Gut Microbiota and Its Association With Feeding and Mealtime Behavior and Intestinal Permeability in Children With Autism Spectrum Disorder
Figures
Tables
| Variable | ASD (N = 70) | Control (N = 70) | Test statistic | P value |
|---|---|---|---|---|
| Percentages are within-group column percentages and may not sum to 100 due to rounding. M: mean; SD: standard deviation; NICU: neonatal intensive care unit; ASD: autism spectrum disorder. | ||||
| Age, years, M (SD) | 8.2 (2.3) | 7.9 (2.2) | t = 0.72 | 0.472 |
| Sex, n (%) | ||||
| Male | 27 (38.6) | 29 (41.4) | χ2 = 0.03 | 0.863 |
| Female | 43 (61.4) | 41 (58.6) | ||
| Residence, n (%) | ||||
| Urban | 37 (52.9) | 38 (54.3) | χ2 = 0.00 | 1.000 |
| Rural | 33 (47.1) | 32 (45.7) | ||
| Family income, n (%) | ||||
| Enough | 25 (35.7) | 21 (30.0) | χ2 = 0.86 | 0.650 |
| Enough and saving | 23 (32.9) | 28 (40.0) | ||
| Not enough | 22 (31.4) | 21 (30.0) | ||
| Father’s education, n (%) | ||||
| Basic/none | 23 (32.9) | 28 (40.0) | χ2 = 2.37 | 0.306 |
| Primary/secondary | 30 (42.9) | 32 (45.7) | ||
| University | 17 (24.3) | 10 (14.3) | ||
| Mother’s education, n (%) | ||||
| Basic/none | 27 (38.6) | 28 (40.0) | χ2 = 1.06 | 0.589 |
| Primary/secondary | 32 (45.7) | 27 (38.6) | ||
| University | 11 (15.7) | 15 (21.4) | ||
| Parental smoking, n (%) | ||||
| Yes | 40 (57.1) | 35 (50.0) | χ2 = 0.46 | 0.498 |
| No | 30 (42.9) | 35 (50.0) | ||
| Siblings, n, M (SD) | 1.7 (1.5) | 1.7 (1.4) | t = 0.00 | 1.000 |
| Low birth weight, n (%) | ||||
| Yes | 43 (61.4) | 30 (42.9) | χ2 = 4.12 | 0.042 |
| No | 27 (38.6) | 40 (57.1) | ||
| Full-term delivery, n (%) | ||||
| Yes | 38 (54.3) | 47 (67.1) | χ2 = 1.92 | 0.166 |
| No | 32 (45.7) | 23 (32.9) | ||
| NICU admission, n (%) | ||||
| Yes | 37 (52.9) | 38 (54.3) | χ2 = 0.00 | 1.000 |
| No | 33 (47.1) | 32 (45.7) | ||
| Weight-for-age z-score, M (SD) | 0.4 (2.0) | −0.1 (1.9) | t = 1.53 | 0.129 |
| Height-for-age z-score, M (SD) | 0.1 (2.0) | 0.1 (2.1) | t = −0.01 | 0.993 |
| Biomarker | ASD (N = 70) | Control (N = 70) | Test statistic (t) | P value |
|---|---|---|---|---|
| SD: standard deviation; ASD: autism spectrum disorder. | ||||
| Fecal zonulin, ng/mL (mean ± SD) | 133.5 ± 25.6 | 59.8 ± 17.5 | t = 19.84 | < 0.001 |
| Fecal calprotectin, µg/g (mean ± SD) | 151.1 ± 42.2 | 61.8 ± 24.1 | t = 15.39 | < 0.001 |
| Taxon | Detected, ASD N (%) | Detected, control N (%) | Detection χ2, P | Abundance*, Log10 CFU/g (ASD vs. control), t, P |
|---|---|---|---|---|
| *Among taxon-positive samples only (n varies by taxon; see Section “Gut microbiota composition” text and Methods). | ||||
| Prevotella | 38 (54.3) | 65 (92.9) | χ2 = 24.83, P < 0.001 | 5.5 ± 0.8 vs. 7.8 ± 0.7; t = −14.35, P < 0.001 |
| Bifidobacterium | 32 (45.7) | 59 (84.3) | χ2 = 21.22, P < 0.001 | 5.4 ± 0.8 vs. 7.7 ± 0.8; t = −14.00, P < 0.001 |
| Lactobacillus | 30 (42.9) | 68 (97.1) | χ2 = 46.56, P < 0.001 | 5.7 ± 0.7 vs. 7.7 ± 0.7; t = −12.49, P < 0.001 |
| Clostridium difficile | 51 (72.9) | 34 (48.6) | χ2 = 7.67, P = 0.006 | 7.5 ± 0.9 vs. 4.0 ± 0.6; t = 21.10, P < 0.001 |
| Bacteroidetes | 36 (51.4) | 26 (37.1) | χ2 = 2.34, P = 0.126 | 7.4 ± 1.0 vs. 4.1 ± 0.7; t = 15.72, P < 0.001 |
| Firmicutes | 38 (54.3) | 53 (75.7) | χ2 = 6.15, P = 0.013 | 7.5 ± 1.1 vs. 4.3 ± 0.6; t = 16.30, P < 0.001 |
| Variable | ASD (N = 70) | Control (N = 70) | Test statistic (t) | P value |
|---|---|---|---|---|
| CARS: Childhood Autism Rating Scale; BAMBI: Brief Autism Mealtime Behavior Inventory; SD: standard deviation; ASD: autism spectrum disorder. | ||||
| CARS total score (mean ± SD) | 39.5 ± 5.7 | |||
| Age at diagnosis, years (mean ± SD) | 4.0 ± 1.2 | |||
| Total BAMBI score (mean ± SD) | 54.1 ± 6.3 | 54.7 ± 5.5 | t = −0.60 | 0.547 |
| Food refusal subscale (mean ± SD) | 15.1 ± 3.6 | 15.4 ± 3.1 | t = −0.57 | 0.566 |
| Limited food variety subscale (mean ± SD) | 23.6 ± 4.1 | 23.9 ± 3.7 | t = −0.33 | 0.745 |
| Autism-specific mealtime behavior subscale (mean ± SD) | 15.4 ± 3.5 | 15.5 ± 2.8 | t = −0.11 | 0.915 |
| Variables compared | Spearman's r | P value | N |
|---|---|---|---|
| ASD: autism spectrum disorder; CARS: Childhood Autism Rating Scale; BAMBI: Brief Autism Mealtime Behavior Inventory. | |||
| CARS vs. fecal zonulin | 0.03 | 0.815 | 70 |
| CARS vs. fecal calprotectin | −0.06 | 0.618 | 70 |
| Total BAMBI vs. fecal zonulin | −0.04 | 0.754 | 70 |
| Total BAMBI vs. fecal calprotectin | 0.03 | 0.806 | 70 |
| CARS vs. total BAMBI | −0.04 | 0.724 | 70 |
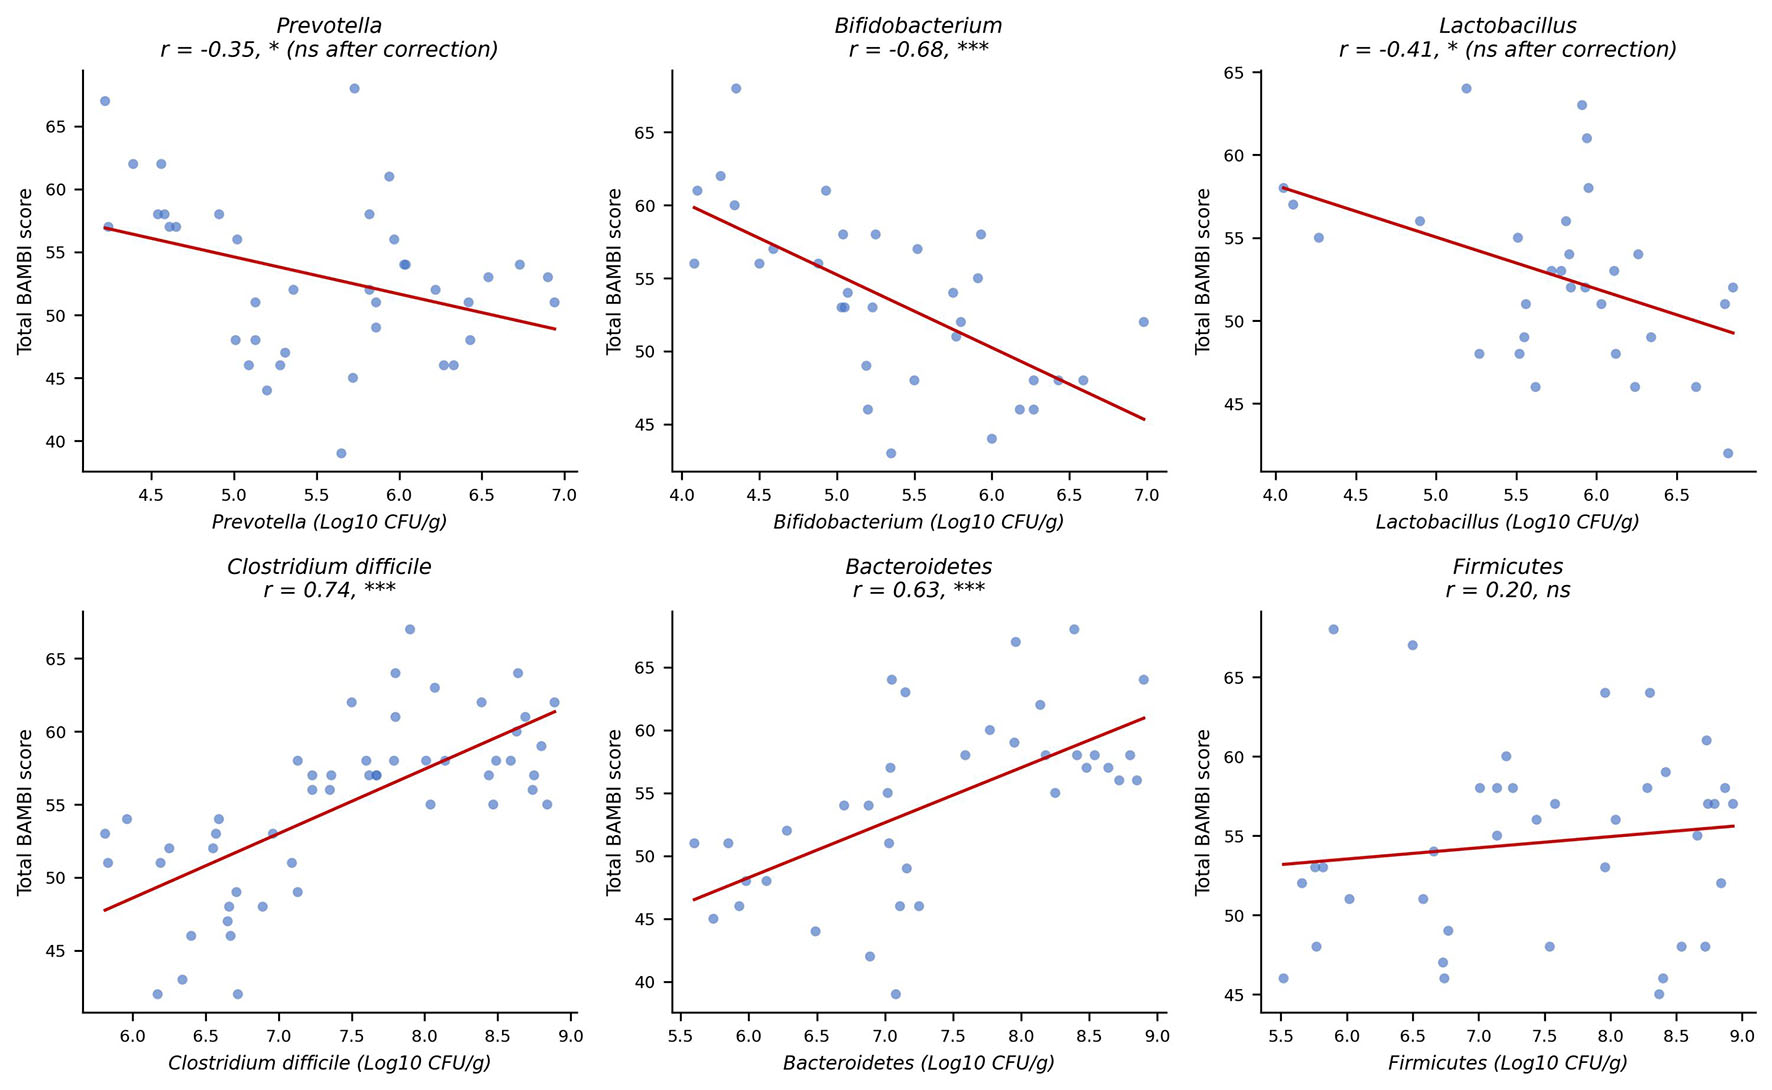
| Total BAMBI vs. Prevotella abundance | −0.35 | 0.029 | 38 |
| Total BAMBI vs. Bifidobacterium abundance | −0.68 | < 0.001 | 32 |
| Total BAMBI vs. Lactobacillus abundance | −0.41 | 0.023 | 30 |
| Total BAMBI vs. Clostridium difficile abundance | 0.74 | < 0.001 | 51 |
| Total BAMBI vs. Bacteroidetes abundance | 0.63 | < 0.001 | 36 |
| Total BAMBI vs. Firmicutes abundance | 0.20 | 0.237 | 38 |
| CARS vs. any of the six taxa | −0.10 to 0.23 | All > 0.16 | 30–51 |
| Predictor | β (unstandardized) | t | P value |
|---|---|---|---|
| Model R2 = 0.584, adjusted R2 = 0.540, F(2, 19) = 13.35, P < 0.001. CFU: colony-forming units. | |||
| Constant | 44.09 | 4.06 | 0.001 |
| Bifidobacterium, Log10 CFU/g | −2.67 | −2.38 | 0.028 |
| Clostridium difficile, Log10 CFU/g | 3.32 | 3.36 | 0.003 |