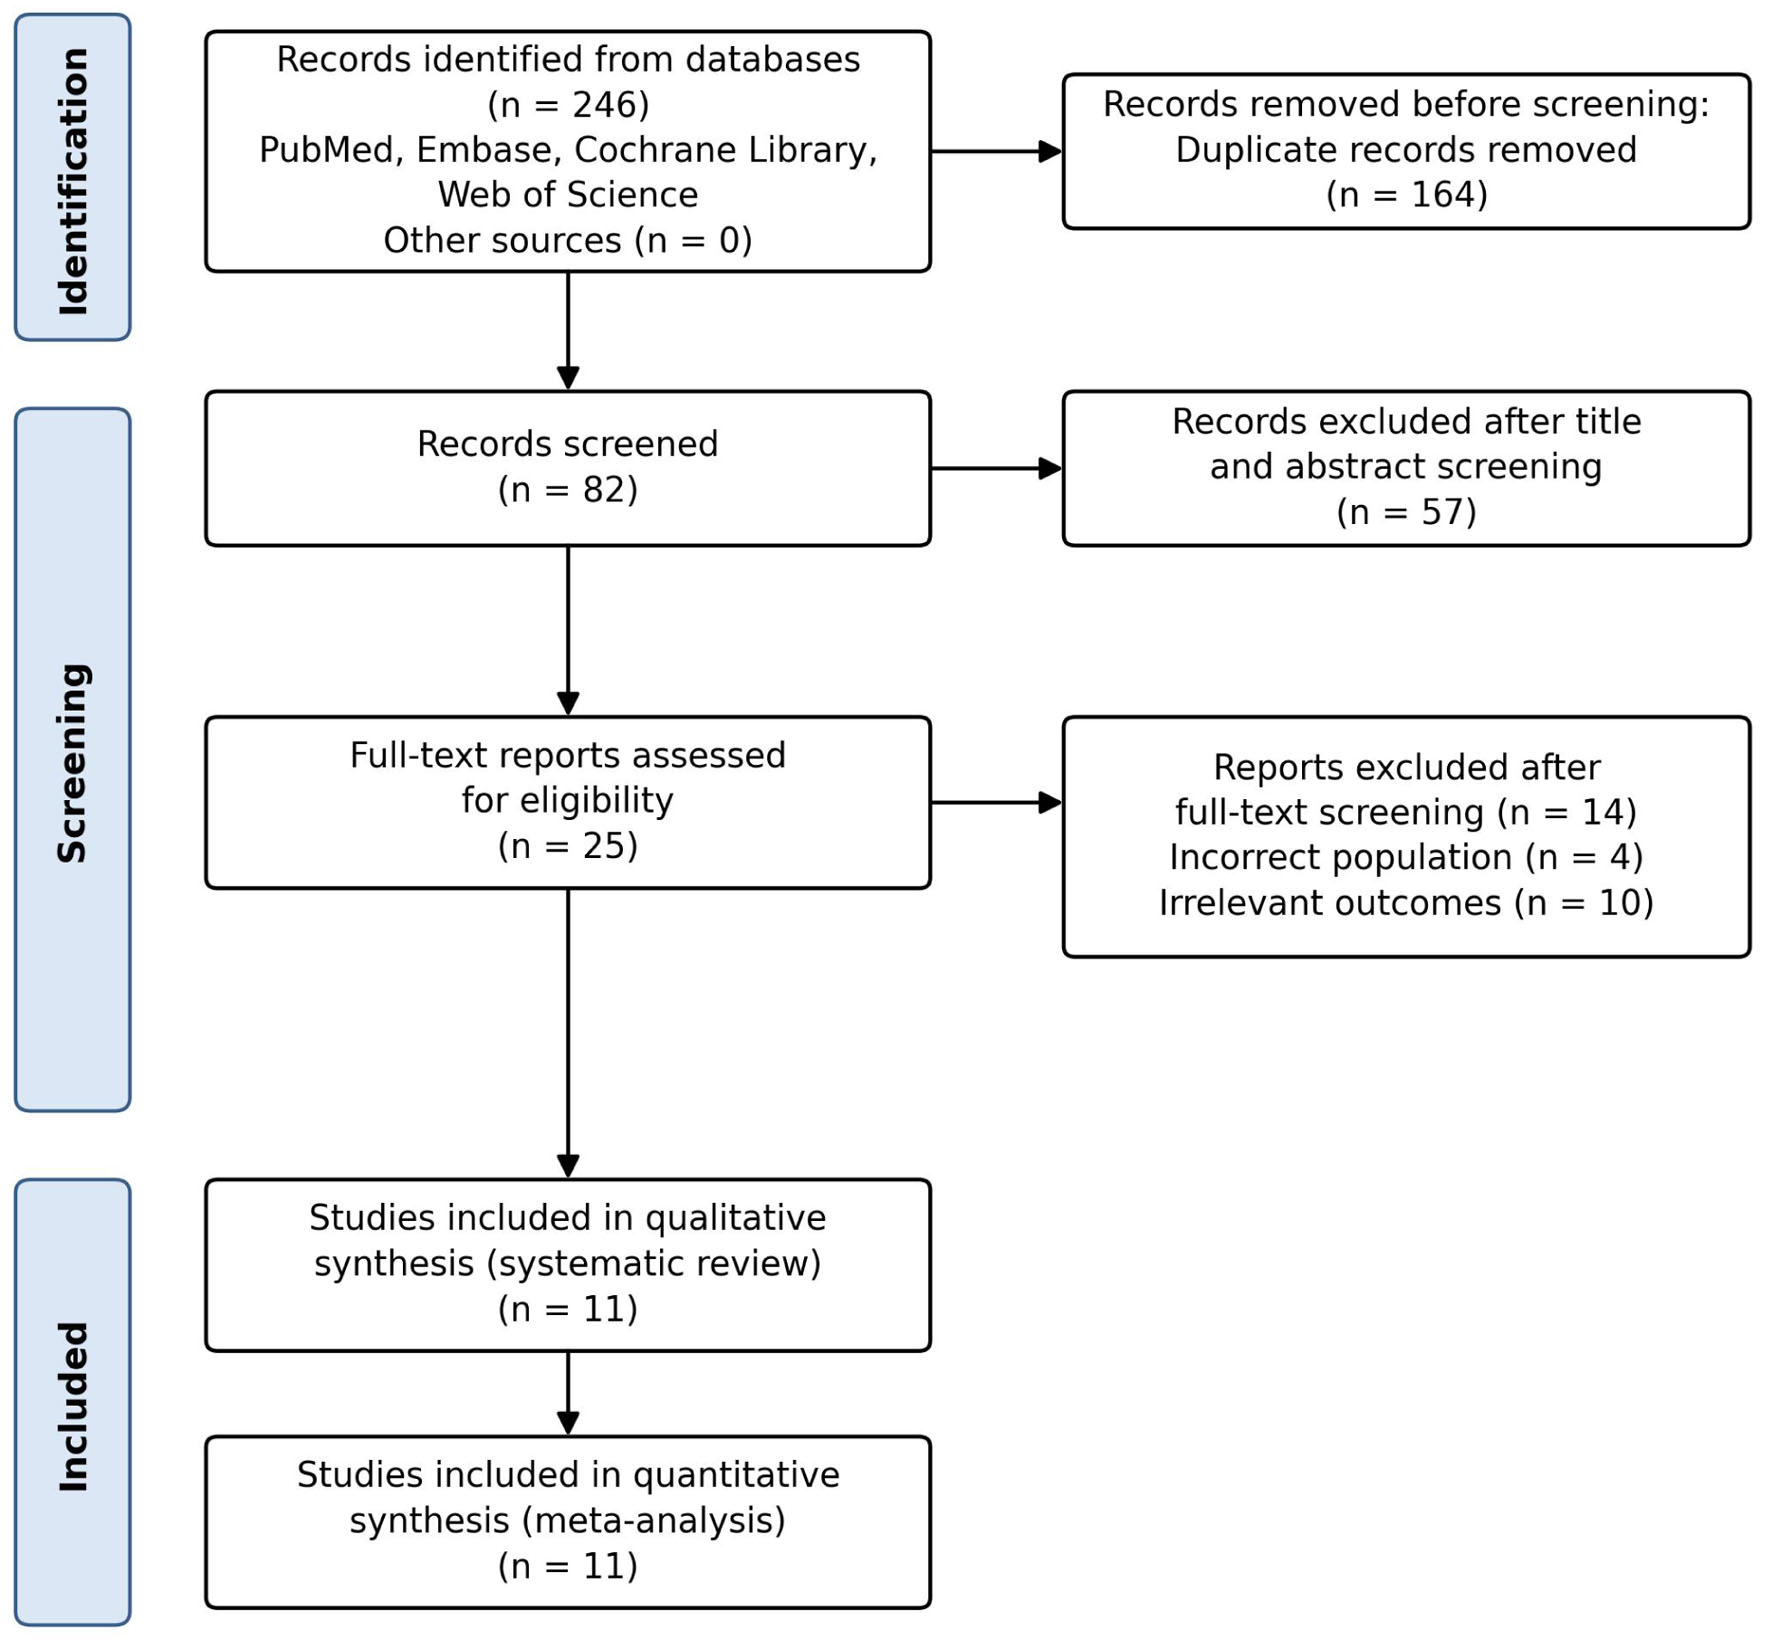
↓ Figure 1. PRISMA 2020 flowchart summarizing results of literature search.
| Journal of Clinical Medicine Research, ISSN 1918-3003 print, 1918-3011 online, Open Access |
| Article copyright, the authors; Journal compilation copyright, J Clin Med Res and Elmer Press Inc |
| Journal website https://jocmr.elmerjournals.com |
Original Article
Volume 18, Number 10, October 2026, pages 687-703
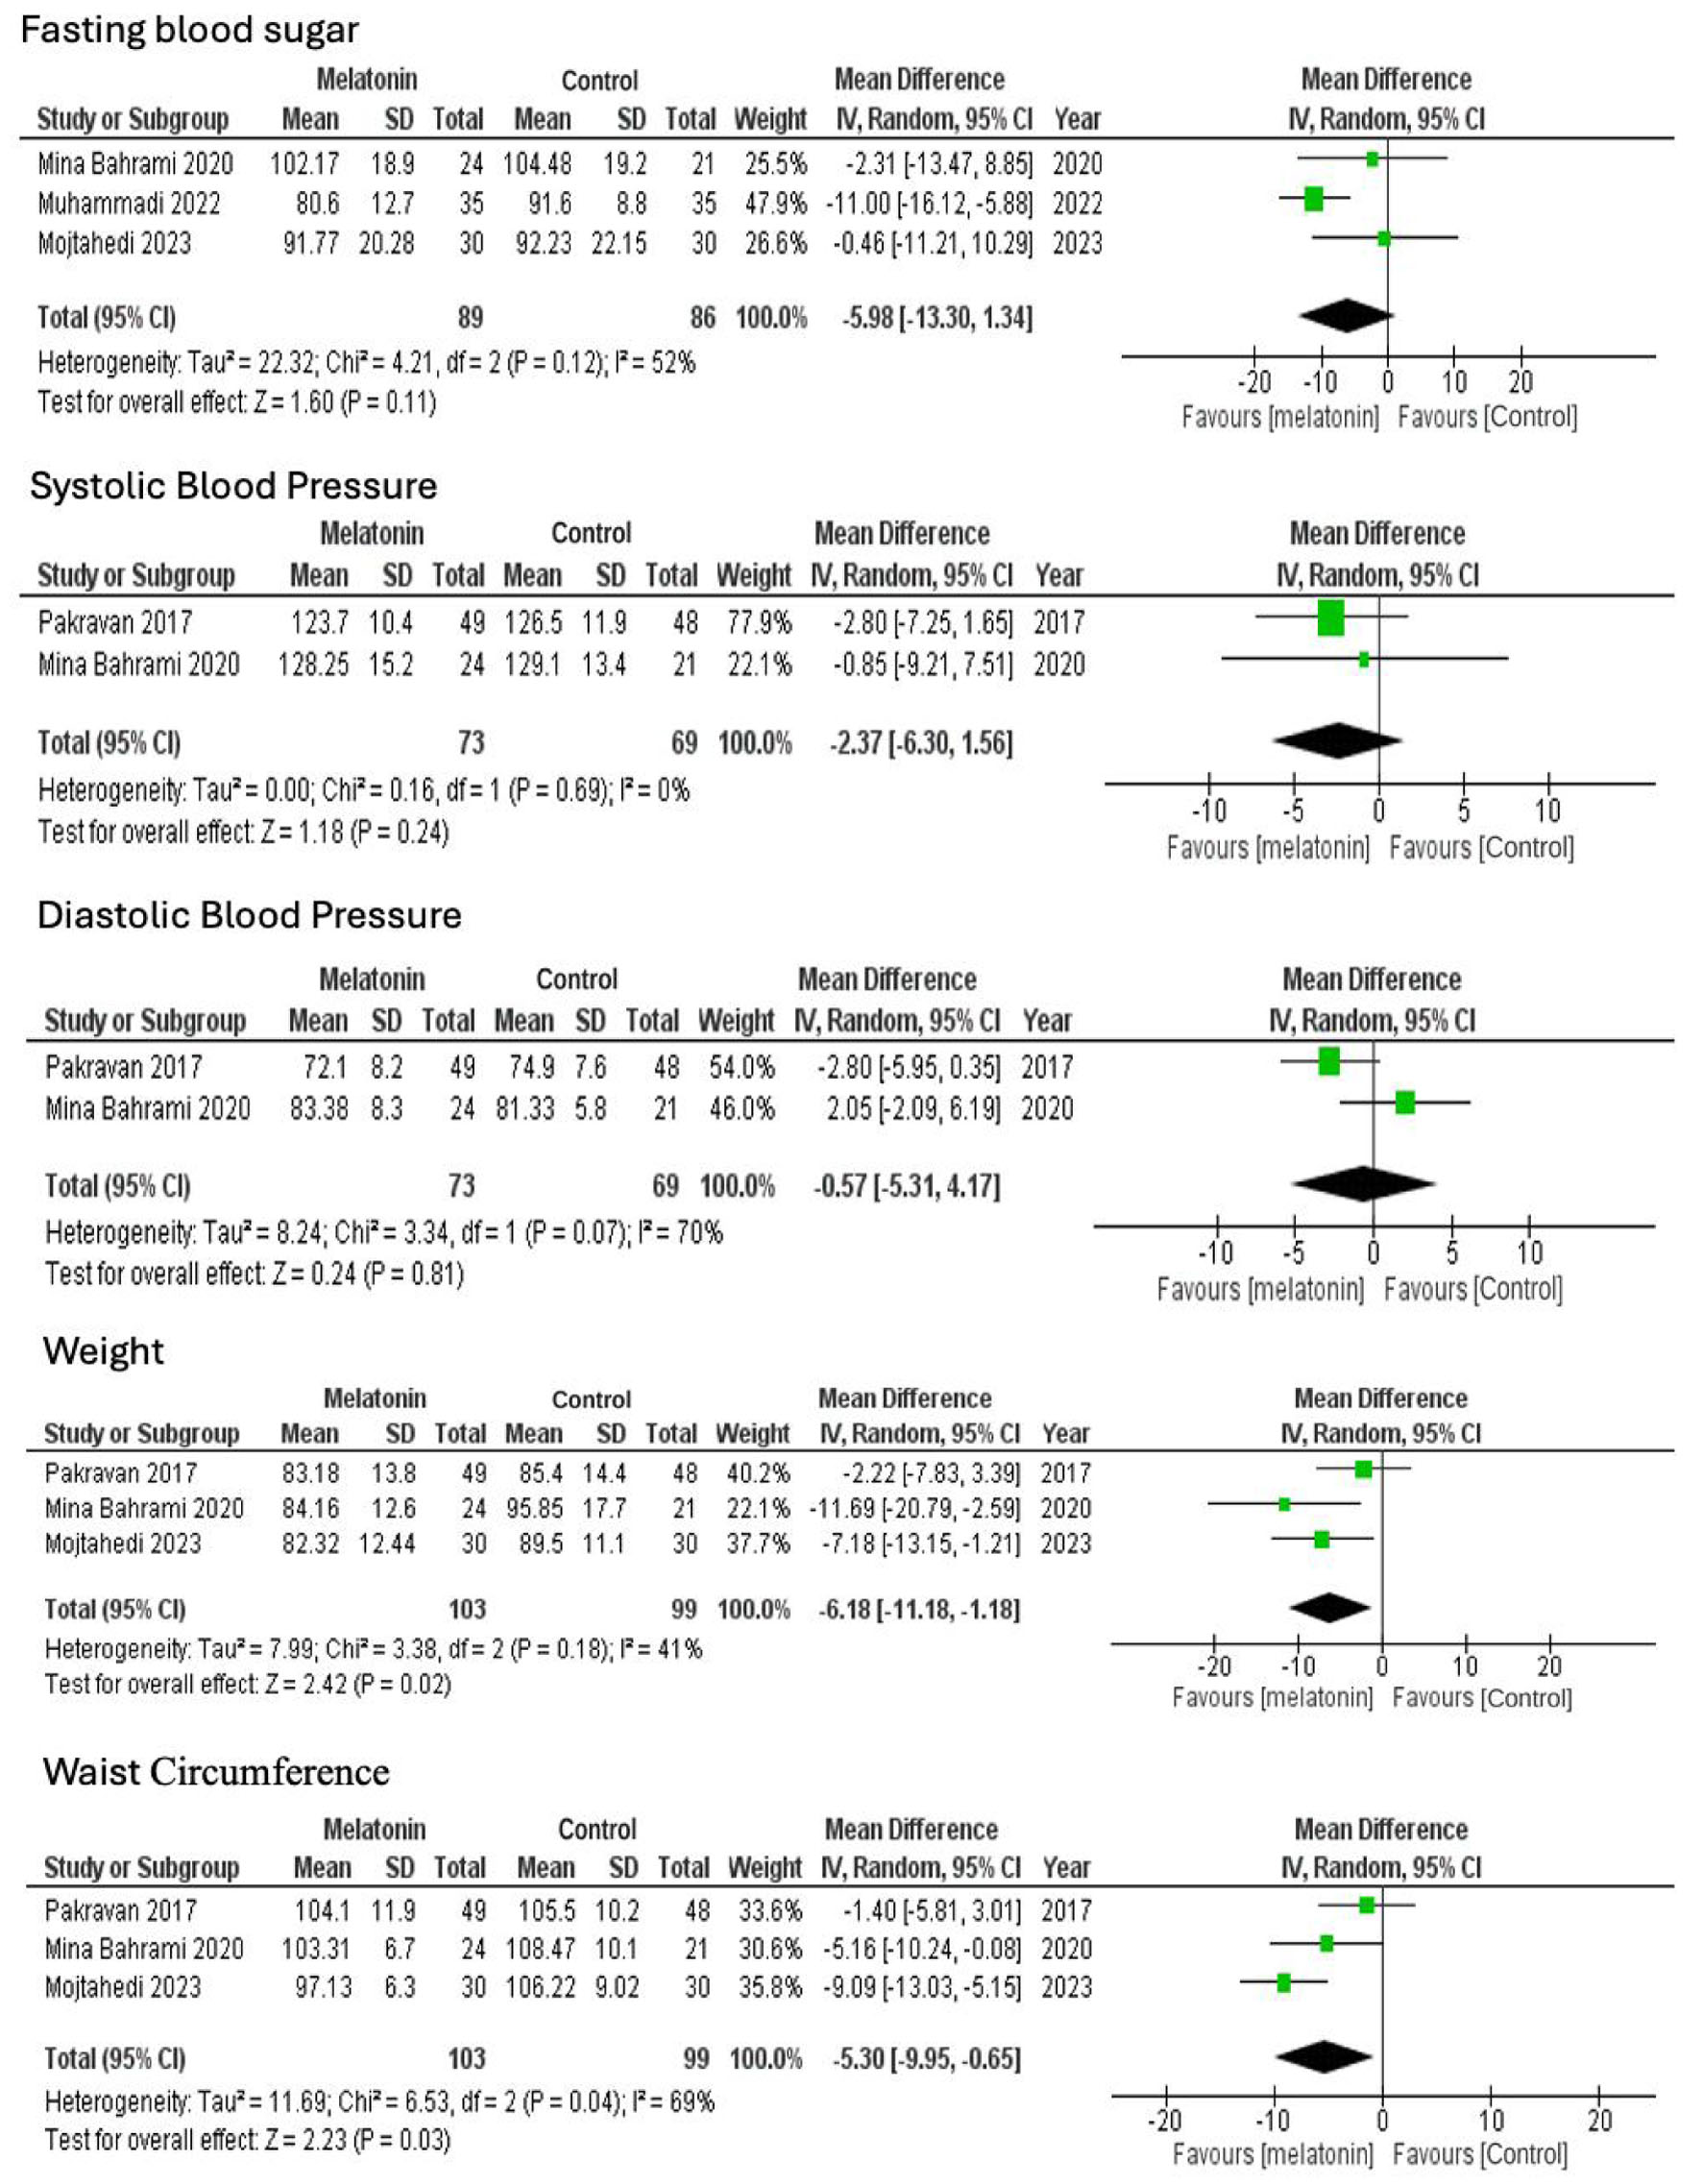
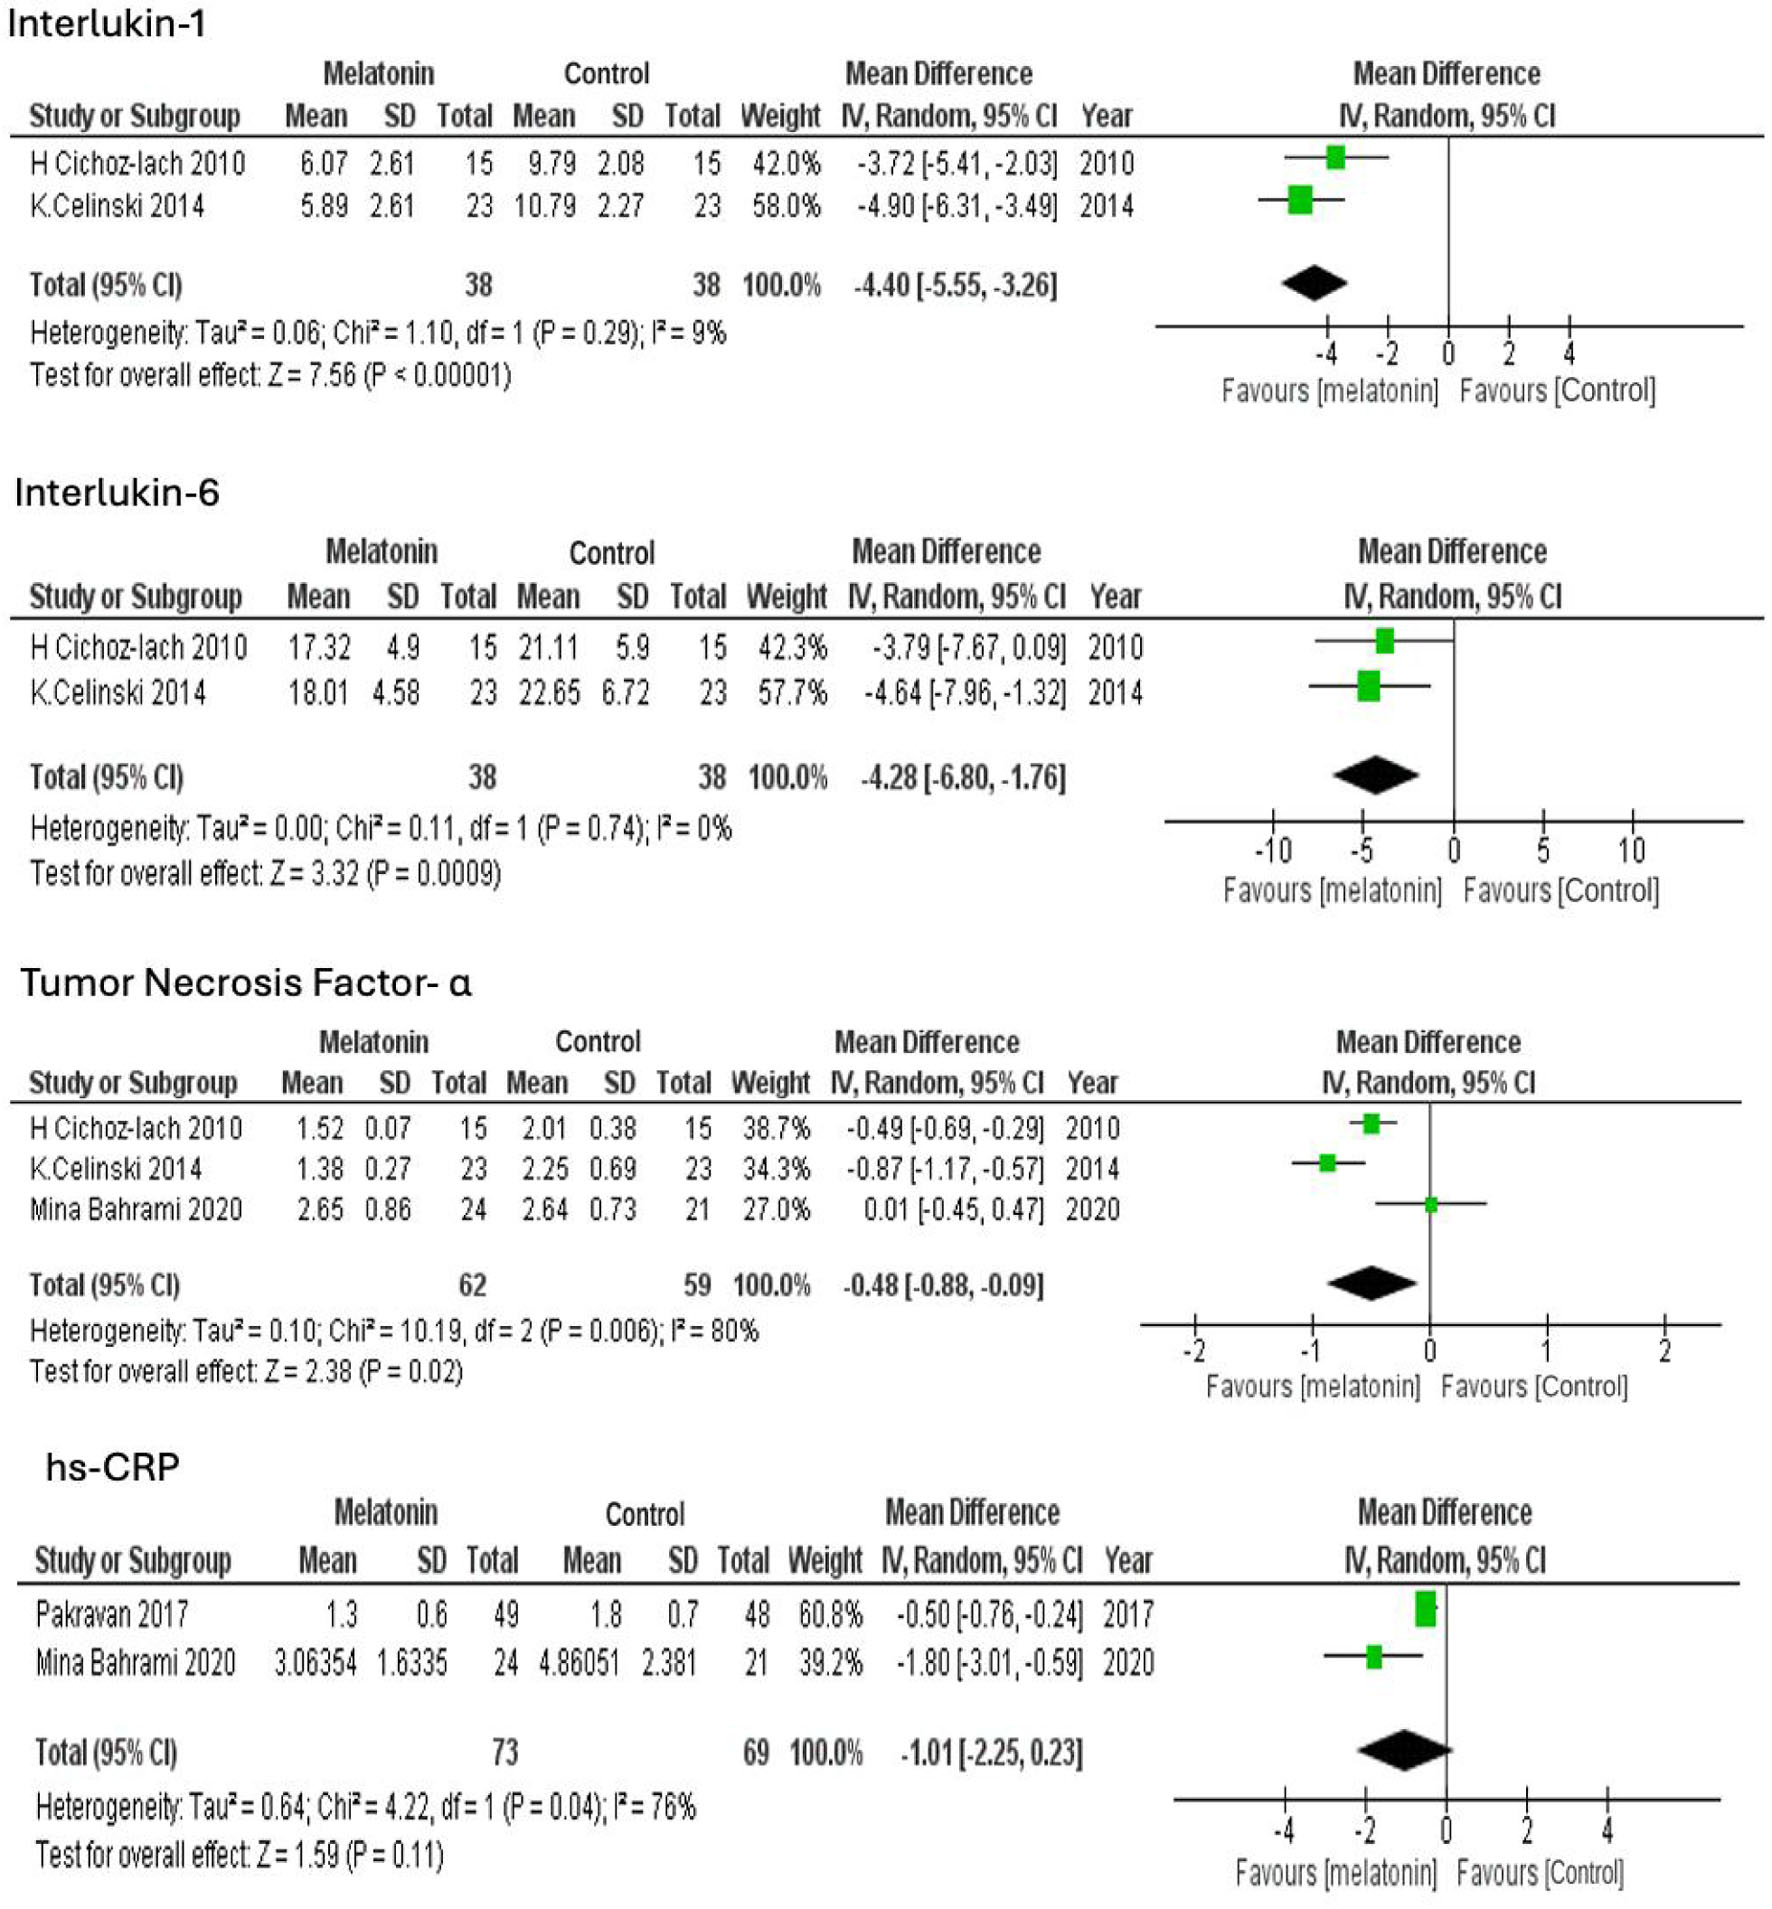
Efficacy of Melatonin in Metabolic Dysfunction-Associated Steatotic Liver Disease: A Systematic Review and Meta-Analysis
Figures
Table
| Author, year (Ref) | Design | Population/diagnosis of steatosis | Number of analyzed (Mel/Ctrl) | Mean age, years (Mel/Ctrl) | Male, n (%) (Mel/Ctrl) | Melatonin regimen | Comparator (type) | Duration | Weight, kg (Mel/Ctrl) | BMI, kg/m2 (Mel/Ctrl) |
|---|---|---|---|---|---|---|---|---|---|---|
| Values are mean ± SD unless stated. AIH: autoimmune hepatitis; ALT: alanine aminotransferase; AST: aspartate aminotransferase; BMI: body mass index; CAP: controlled attenuation parameter; Ctrl: control arm; GGT: gamma-glutamyl transferase; HBV: hepatitis B virus; HCV: hepatitis C virus; Mel: melatonin arm; NAFLD: non-alcoholic fatty liver disease; NASH: non-alcoholic steatohepatitis; NR: not reported; PBC/PSC: primary biliary/sclerosing cholangitis; RCT: randomized controlled trial; ULN: upper limit of normal. | ||||||||||
| Bahrami, 2020 [3] | RCT, double-blind, parallel | NAFLD; ultrasound (steatosis ≥ grade 1) + ALT > 30 (M)/> 19 (F) U/L | 24/21 | 44.0 ± 9.62/37.71 ± 11.31 | 17 (71)/14 (67) | 6 mg (2 × 3 mg) orally, 1 h before bedtime | Starch placebo, matched shape/color (placebo) | 12 weeks | 85.45 ± 11.4/95.47 ± 16.2 | 29.46 ± 3.6/32.59 ± 6.1 |
| Celinski, 2014 [4] | RCT, open-label, three-arm (melatonin and Essentiale-only arms used) | NAFLD confirmed by liver biopsy (simple steatosis 17, NASH 6 per arm) | 23/23 | 36.16 ± 5.77/29.33 ± 9.58 | 8 (35)/12 (52) | 2 × 5 mg/day orally + Essentiale forte 3 × 300 mg/day | Essentiale forte alone, no placebo (no melatonin) | 14 months | NR/NR | NR/NR |
| Esmaeili, 2021 [19] | RCT, double-blind, two-period crossover | Chronic liver disease with pruritus (PSC, PBC, cirrhosis, AIH, HBV/HCV); steatosis not assessed | 40 (crossover; 18 melatonin-first/22 placebo-first) | 41.5 ± 12.08/49.73 ± 12.89 (by sequence) | 11 (61)/11 (50) (by sequence) | 10 mg (2 × 5 mg pearls) at night | Placebo pearls of identical shape, size, color and odor (placebo) | 2 weeks per period, 2-week washout | NR/NR | NR/NR |
| Cichoz-Lach, 2010 [13] | Non-randomized controlled trial (allocation not described), three-arm | NASH confirmed by liver biopsy | 15/15 | NR/NR (all patients: women 22–46 years, men 26–58 years) | NR/NR (27/45 men overall) | 2 × 5 mg/day orally + Essentiale forte 3 × daily | Placebo + Essentiale forte (placebo); (tryptophan arm not used) | 4 weeks | NR/NR | NR/NR |
| Gonciarz, 2010 [14] | RCT (2:1 random allocation reported in the 2012 extension paper), placebo-controlled | NASH confirmed by liver biopsy; ALT/AST elevated | 30/12 | 41.5 ± 4.0/40.8 ± 3.6 (from Ref [15]) | 18 (60)/8 (67) (from ref 15) | 2 × 5 mg/day orally (09:00 and 21:00) + diet and walking program | Placebo twice daily + same lifestyle program (placebo) | 12 weeks | 82.5 ± 3.4/81.1 ± 3.7 (from ref 15) | NR/NR |
| Gonciarz, 2012 [15] | RCT (2:1 random allocation), placebo-controlled; extension of ref 14 in the same 42 patients | NASH confirmed by liver biopsy | 30/12 | 41.5 ± 4.0/40.8 ± 3.6 | 18 (60)/8 (67) | 2 × 5 mg/day orally (09:00 and 21:00) + diet and walking program | Placebo twice daily + same lifestyle program (placebo) | 24 weeks (+ 12-week off-treatment follow-up) | 82.5 ± 3.4/81.1 ± 3.7 | NR/NR |
| Pakravan, 2017 [11] | RCT, double-blind, parallel | NAFLD by clinical and pathological findings; ultrasound grading (mild/moderate/severe) | 49/48 | 42.5 ± 10.1/40.6 ± 9.8 | 33 (69)/27 (56) | One tablet orally twice daily (dose in mg not stated; abstract states “thrice daily for 3 months”) | Placebo tablets manufactured identically (placebo) | 6 weeks (abstract states 3 months) | 85.1 ± 13.5/86.9 ± 13.7 | NR/NR |
| Chojnacki, 2017 [18] | RCT (allocation method not described), placebo-controlled | Hyperlipidemia on statins with ≥ 2-fold elevated aminotransferases; BMI > 30 excluded; steatosis not assessed | 30/30 | NR/NR (all patients 47–65 years) | NR/NR (19/60 men overall) | 2 × 5 mg/day orally (07:00 and 21:00) + statin 20 mg/day + 1,600-kcal diet | Placebo at the same dose and times + same statin and diet (placebo) | 6 months | NR / NR | NR/NR (≤ 30 by design) |
| Mohammadi, 2022 [12] | RCT, double-blind, four-arm (melatonin and placebo arms used) | NAFLD by ultrasonography + elevated ALT/AST; diabetes excluded | 35/35 | 47.5 ± 13.02/44.4 ± 2.07 | 16 (46)/22 (63) | 10 mg once daily at night + two placebos + same diet and activity program | Three placebos daily + same diet and activity program (placebo) | 24 weeks | 74.89 ± 11.88/89.44 ± 11.23 | 27.6 ± 3.8/28.05 ± 4.27 |
| Mojtahedi, 2023 [17] | RCT, double-blind, four-arm (melatonin and placebo arms used) | NAFLD by transient elastography (FibroScan) with CAP steatosis S1–S3 and elevated ALT; diabetes and metabolic syndrome excluded | 30/30 | 43.66 ± 11.01/43.12 ± 10.87 | 12 (40)/12 (40) | 10 mg once daily orally + 500-kcal-deficit weight-loss diet | Placebo, pre-packaged and encoded, indistinguishable + same diet (placebo) | 3 months | 88.54 ± 15.06/93.05 ± 10.33 | 31.39 ± 2.82/32.57 ± 2.55 |
| Gonciarz, 2013 [16] | Non-randomized before–after study in NASH patients with an untreated lean healthy reference group (no MASLD control arm) | NASH by liver biopsy within 12 months, overweight (BMI 25–30), aminotransferases/GGT > 1.5 × ULN; reference group: 15 lean healthy subjects | 16/15 (healthy, untreated) | 42.1 ± 3.4/40.5 ± 3.8 | 11 (69)/7 (47) | 2 × 5 mg/day orally (09:00 and 21:00) | Untreated healthy subjects (no treatment; not a MASLD control arm) | 28 days | NR/NR | 28.6 ± 1.9/23.1 ± 1.1 |