Journal of Clinical Medicine Research, ISSN 1918-3003 print, 1918-3011 online, Open Access
Article copyright, the authors; Journal compilation copyright, J Clin Med Res and Elmer Press Inc
Journal website https://jocmr.elmerjournals.com

Original Article

Volume 18, Number 9, September 2026, pages 671-678


From Discovery to Verification: A Thirty-Three-Year Analysis of Research Design in Three Leading General Medical Journals, 1992–2024

Figures

↓  Figure 1. Annual share of indexed journal articles tagged as Phase III trials (a) and as case reports (b) in the New England Journal of Medicine (NEJM), The Lancet, and JAMA. Numerator and denominator are both restricted to records carrying the Journal Article publication type. Panel (a) begins in 1993, the year the Clinical Trial, Phase III publication type was introduced; faint lines show individual journals and the bold line the pooled estimate, with the pooled odds ratio (OR) per decade from a binomial generalized linear model, the two-sided P value for trend, and the Spearman rank correlation coefficient (ρ) between calendar year and annual proportion. Panel (b) shows each journal separately, because the three differ in the kind of case-based content they publish; the dashed line shows NEJM case reports of three or more pages, that is, excluding the weekly Case Records feature and single-page clinical image items. The case-report share does not fall in NEJM as a whole but falls in every journal once these standing features are separated out.
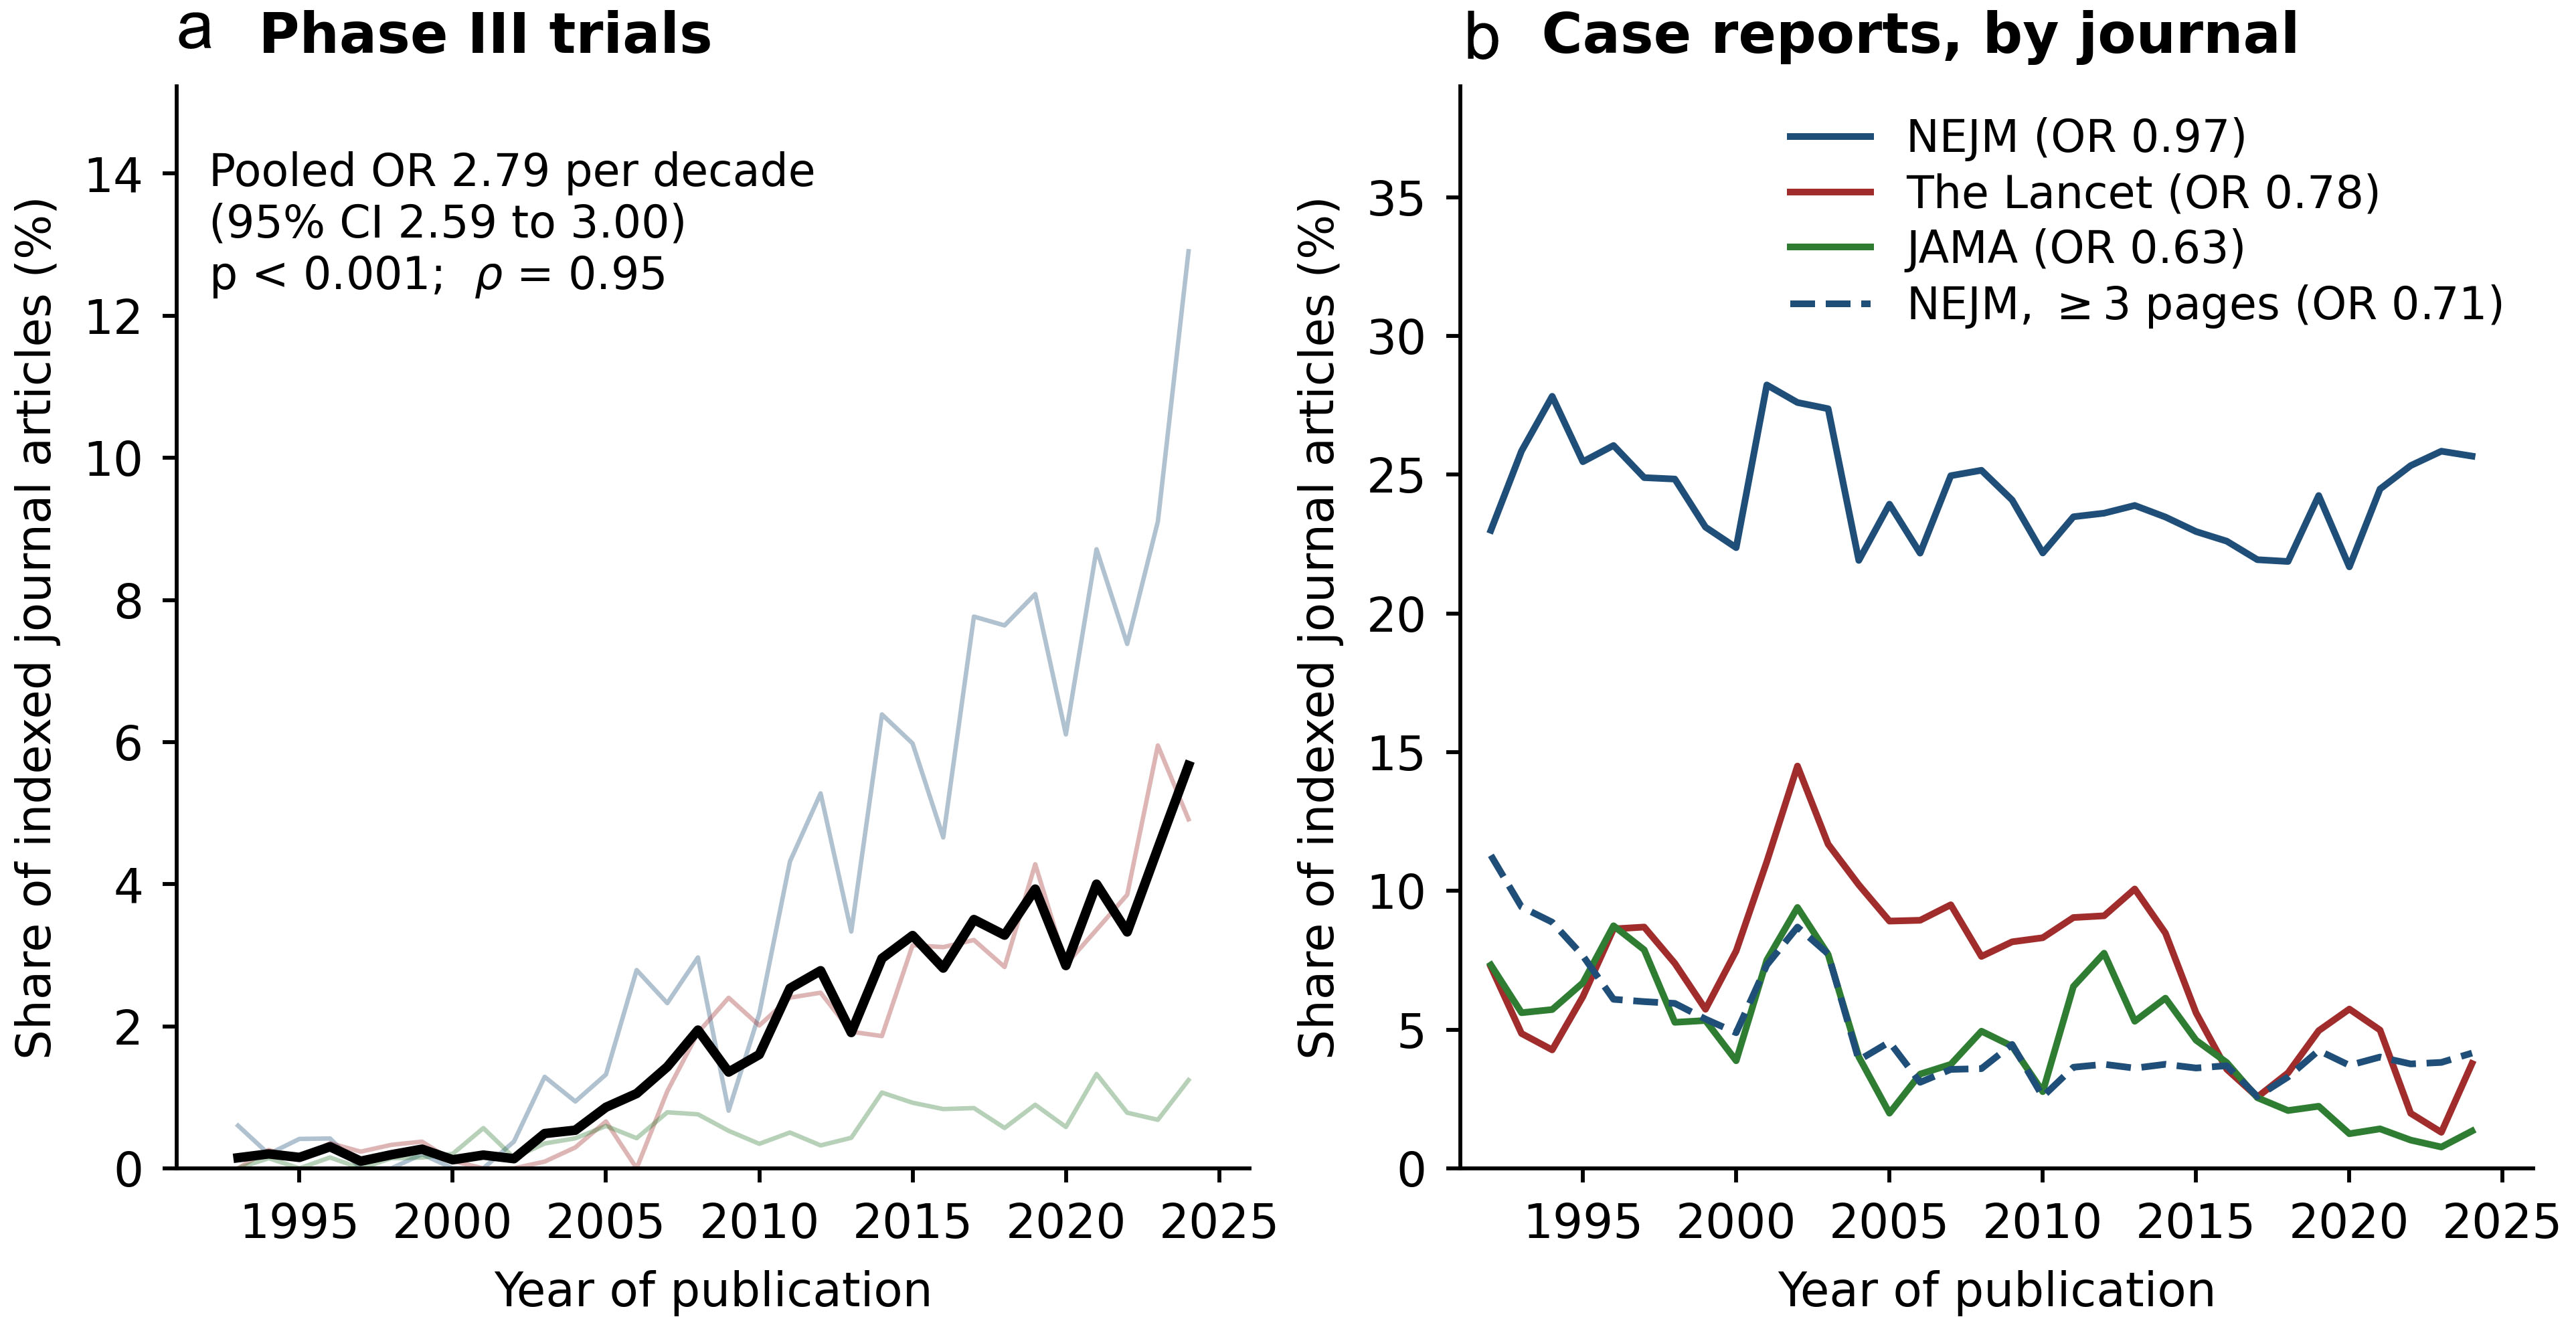
Figure 1.
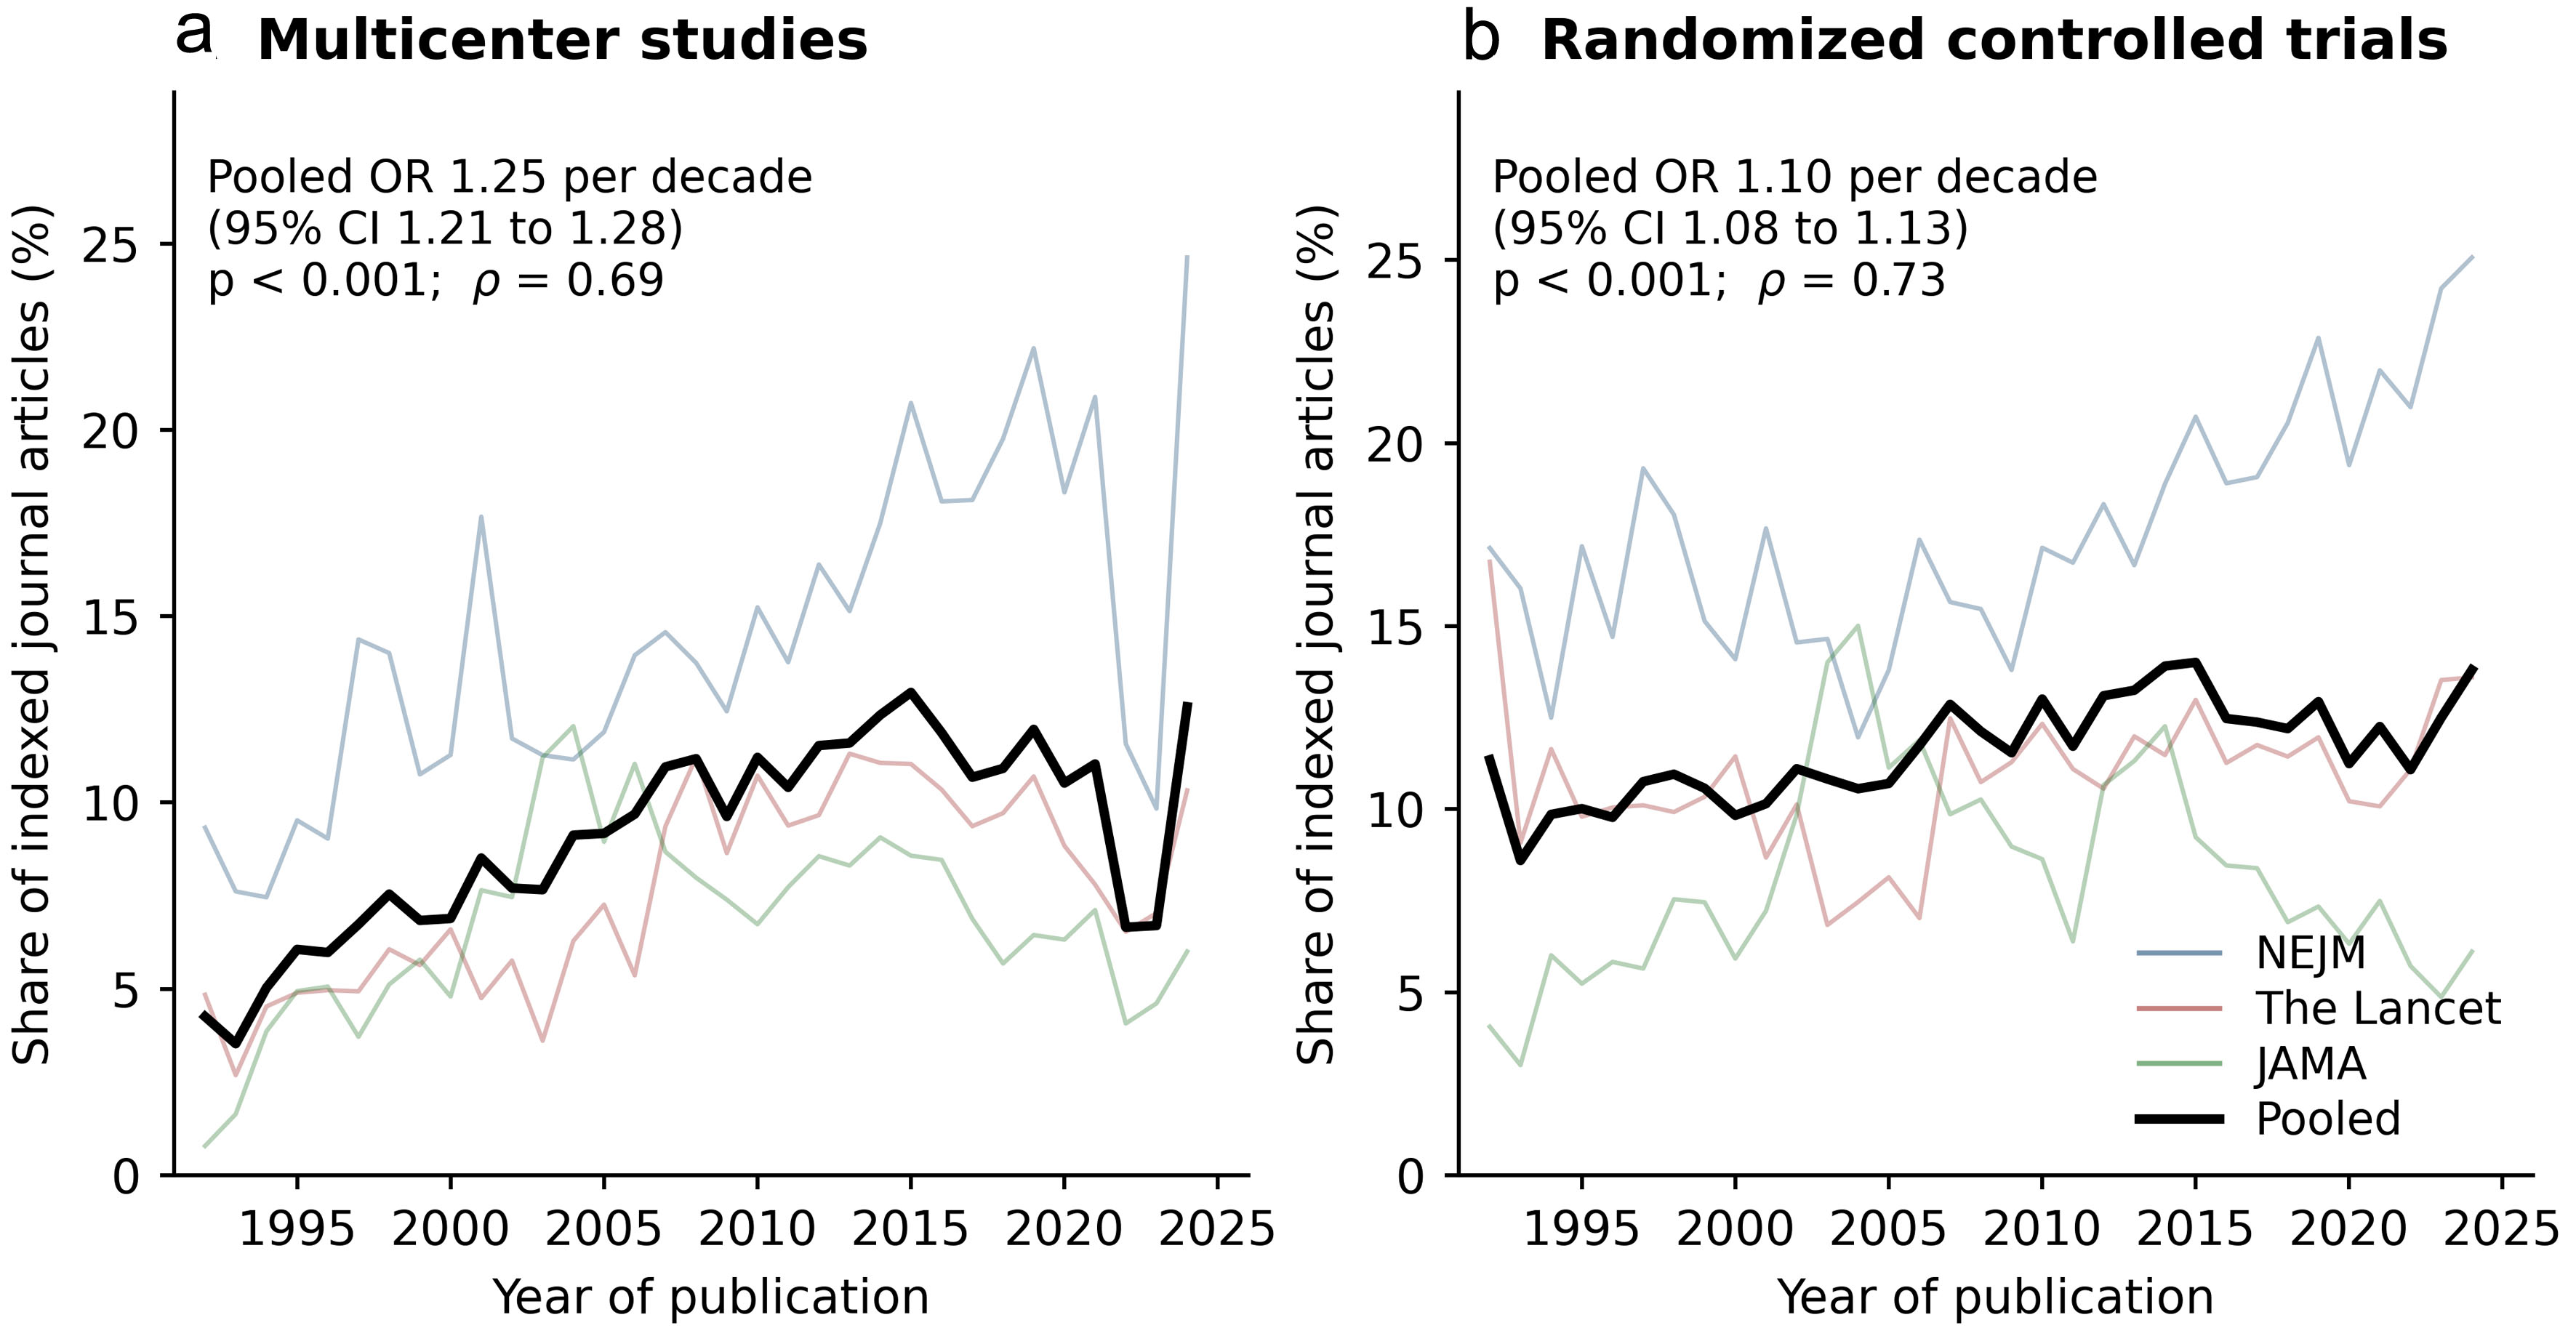
↓  Figure 2. Annual share of indexed journal articles tagged as multicenter studies (a) and as randomized controlled trials (b) in the New England Journal of Medicine (NEJM), The Lancet and JAMA, 1992–2024, on the same specification as Figure 1. Faint lines show individual journals and the bold line the pooled estimate, with pooled trend estimates as in Figure 1. The pooled randomized-trial share rises modestly; the rise is marked in NEJM and weak in The Lancet and JAMA. The temporary fall in multicenter tagging in 2022–2023 is discussed in the text.
Figure 2.

Tables

↓  Table 1. Trend Statistics for Design Indicators, 1992–2024
 
Indicator (share of indexed journal articles)First year2024OR per decade (95% CI)P value (trend); ρ
Data are the proportion of records carrying the Journal Article publication type in the stated calendar year; numerator and denominator are both restricted to Journal Article records. The Phase III series begins in 1993, the year that publication type was introduced, so its first-year value is for 1993; all other first-year values are for 1992. OR per decade, odds ratio per 10 calendar years, estimated from a binomial GLM; P value refers to the linear trend across years; ρ, Spearman’s rank correlation coefficient between calendar year and annual proportion. Case reports are reported by journal because the three journals differ in the kind of case-based content they publish; the NEJM three-or-more-pages row excludes the Case Records feature and single-page clinical image items, identified from title and pagination as described in the “Methods”. GLM: generalized linear model; NEJM: New England Journal of Medicine; OR: odds ratio; ρ: Spearman’s rank correlation coefficient.
Pooled across the three journals
  Phase III trials (from 1993)0.15%5.67%2.79 (2.59–3.00)< 0.001; 0.95
  Multicenter studies4.26%12.57%1.25 (1.21–1.28)< 0.001; 0.69
  Randomized trials11.35%13.80%1.10 (1.08–1.13)< 0.001; 0.73
Case reports, by journal
  NEJM, all23.0%25.7%0.97 (0.94–1.00)0.077; −0.29
  NEJM, three or more pages11.3%4.2%0.71 (0.66–0.76)< 0.001; −0.67
  The Lancet7.3%3.8%0.78 (0.75–0.82)< 0.001; −0.40
  JAMA7.3%1.3%0.63 (0.59–0.67)< 0.001; −0.72


↓  Table 2. Number of Authors per RCT, by Journal and Time Window (Full Census)
 
JournalWindowTrialsMedian (IQR)MeanMaximum
Based on a full census of all RCTs indexed for each journal and window. Records listing only a collective or group name were excluded (118 of 4,068, 2.9%). MEDLINE recorded at most 10 authors for citations dated 1984 to 1995 and at most 25 for 1996 to 1999; within the earliest window the cap of 10 binds in 1994–1995 (109 of 406 trials list exactly 10 authors, none more) whereas the cap of 25 does not bind in 1996–1998 (largest trial 20 authors). Medians for 1996–1998 alone are identical to those for the full window (10, 5 and 7). Means and maxima for 1994–1998 are lower bounds and should not be compared across windows; the mean for NEJM in that window falls below its median for this reason. IQR: interquartile range; MEDLINE: US National Library of Medicine bibliographic database; NEJM: New England Journal of Medicine; RCT: randomized controlled trial.
NEJM1994–199837510 (6 to 11)8.620
2008–201258415 (10 to 21)17.1141
2020–202477223 (16 to 33)27.0178
The Lancet1994–19985105 (4 to 8)6.019
2008–201244912 (9 to 18)14.3266
2020–202446521 (15 to 29)23.082
JAMA1994–19981947 (5 to 10)7.419
2008–201225611 (8 to 17)13.347
2020–202434519 (13 to 28)26.71,064