| Journal of Clinical Medicine Research, ISSN 1918-3003 print, 1918-3011 online, Open Access |
| Article copyright, the authors; Journal compilation copyright, J Clin Med Res and Elmer Press Inc |
| Journal website https://jocmr.elmerjournals.com |
Original Article
Volume 18, Number 11, November 2026, pages 850-858
Usefulness of Phase Angle as an Overall Marker of Muscle Health in Older Patients With Type 2 Diabetes
Figure

Tables
| Baseline | 3 years | P | |
|---|---|---|---|
| N = 101 (male 61, female 40). Data are expressed as mean ± SD. SD: standard deviation; BMI: body mass index; HbA1c: glycated hemoglobin; eGFR: estimated glomerular filtration rate; DPP-4: dipeptidyl peptidase-4; SGLT-2: sodium-glucose cotransporter-2; α-GI: α-glucosidase inhibitor; GLP-1: glucagon-like peptide-1; GIP: glucose-dependent insulinotropic polypeptide | |||
| Variables | |||
| Age, years | 69.77 ± 8.231 | 72.91 ± 8.271 | < 0.0001 |
| BMI, kg/m2 | 25.32 ± 4.136 | 24.90 ± 4.090 | < 0.0001 |
| HbA1c, % | 7.468 ± 0.9375 | 7.366 ± 1.064 | 0.2733 |
| eGFR, mL/min/1.73 m2 | 62.68 ± 14.90 | 61.28 ± 15.18 | 0.2271 |
| Serum albumin, g/dL | 4.255 ± 0.2622 | 4.333 ± 0.3293 | 0.1607 |
| Medication of anti-diabetic agent usage | |||
| No medication, n (%) | 17 (16.9) | 15 (14.9) | |
| Metformin, n (%) | 36 (35.6) | 39 (38.6) | |
| DPP-4 inhibitor, n (%) | 68 (67.3) | 63 (62.4) | |
| SGLT-2 inhibitor, n (%) | 17 (16.8) | 28 (27.7) | |
| Glinide, n (%) | 21 (20.8) | 7 (6.9) | |
| α-GI, n (%) | 8 (7.9) | 10 (9.9) | |
| Sulfonylurea, n (%) | 28 (27.7) | 28 (27.7) | |
| GLP-1 receptor agonist (oral), n (%) | 3 (3.9) | 8 (7.9) | |
| GLP-1 receptor agonist (injection), n (%) | 6 (5.9) | 2 (2.0) | |
| GIP/GLP-1 receptor agonist, n (%) | 0 (0.0) | 3 (3.0) | |
| Insulin, n (%) | 10 (9.9) | 5 (5.0) | |
| Variables | Baseline | 3 years | P |
|---|---|---|---|
| N = 101 (male 61, female 40). Data are expressed as mean ± SD. ECW: extracellular water; FI: fat index; PhA: phase angle; SD: standard deviation; SMI: skeletal muscle index; SPPB: Short Physical Performance Battery; TBW: total body water. | |||
| FI, kg/m2 | 7.857 ± 3.642 | 7.866 ± 3.781 | 0.9517 |
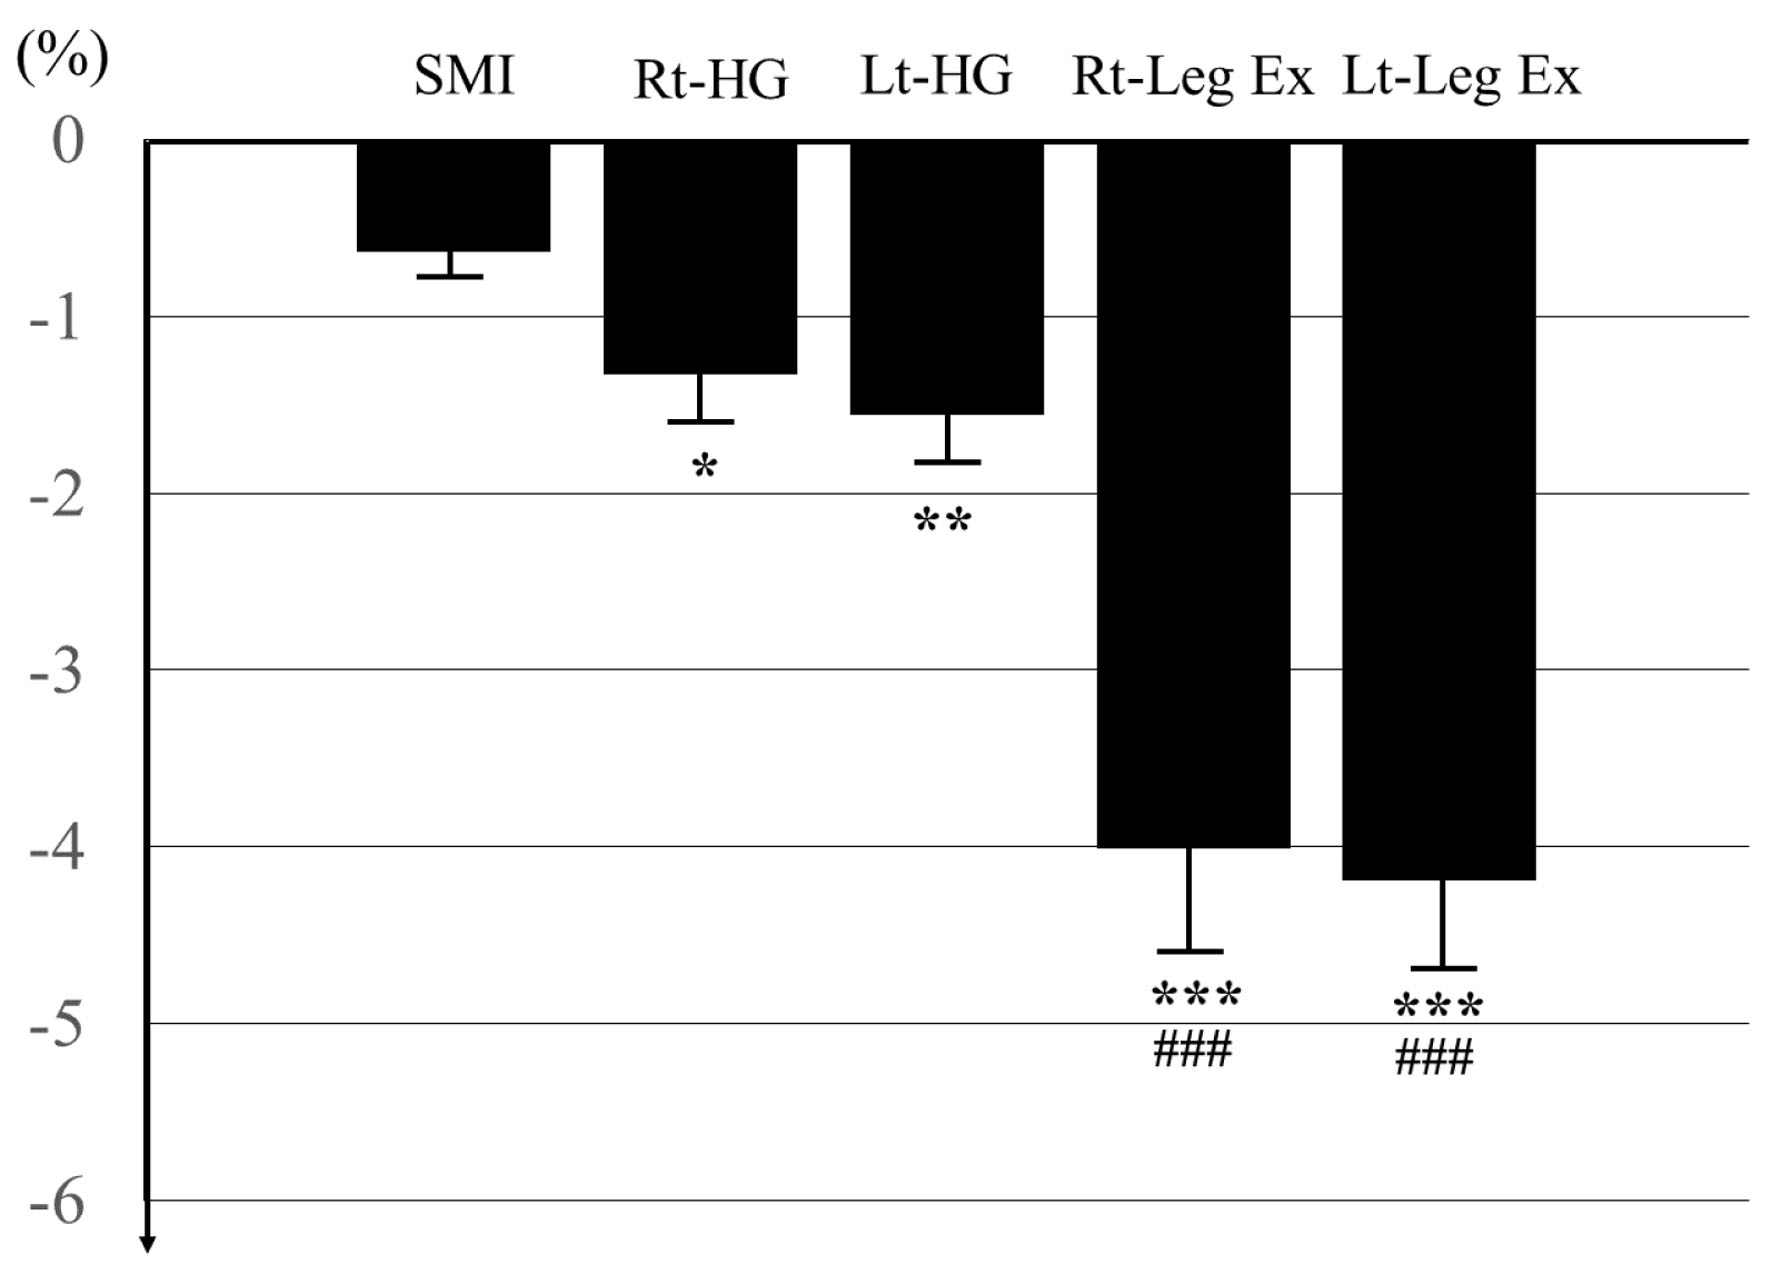
| SMI, kg/m2 | 7.640 ± 0.8772 | 7.488 ± 0.9041 | < 0.0001 |
| ECW/TBW | 0.4404 ± 0.0149 | 0.4499 ± 0.0950 | 0.3185 |
| Right PhA | 5.331 ± 0.6941 | 5.044 ± 0.5744 | < 0.0001 |
| Left PhA | 5.273 ± 0.7370 | 4.961 ± 0.6395 | < 0.0001 |
| Right handgrip strength, kg | 32.50 ± 8.632 | 30.96 ± 8.457 | 0.0003 |
| Left handgrip strength, kg | 30.18 ± 7.816 | 28.76 ± 8.258 | < 0.0001 |
| Right leg extension strength, kg | 31.90 ± 11.54 | 28.06 ± 12.34 | < 0.0001 |
| Left leg extension strength, kg | 31.04 ± 12.29 | 27.03 ± 12.21 | < 0.0001 |
| SPPB | 11.80 ± 0.5318 | 11.66 ± 0.8317 | 0.1010 |
| Correlation coefficient with right PhA | P | Correlation coefficient with left PhA | P | |
|---|---|---|---|---|
| ECW: extracellular water; eGFR: estimated glomerular filtration rate; FI: fat index; HbA1c: glycated hemoglobin; PhA: phase angle; SMI: skeletal muscle index; SPPB: Short Physical Performance Battery; TBW: total body water. | ||||
| Age, years | −0.4027 | < 0.0001 | −0.3776 | < 0.0001 |
| Sex, female 1/male 2 | 0.3936 | < 0.0001 | 0.3487 | 0.0003 |
| HbA1c, % | 0.0639 | 0.5264 | 0.0493 | 0.6254 |
| eGFR, mL/min/1.73 m2 | 0.0692 | 0.4924 | 0.0381 | 0.7058 |
| Serum albumin, g/dL | −0.0013 | 0.9915 | 0.2215 | 0.0762 |
| FI, kg/m2 | −0.2001 | 0.0439 | −0.1124 | 0.2632 |
| SMI, kg/m2 | 0.6813 | < 0.0001 | 0.6927 | < 0.0001 |
| ECW/TBW | −0.3665 | 0.0002 | −0.3352 | 0.0006 |
| Right handgrip strength, kg | 0.5633 | < 0.0001 | - | - |
| Left handgrip strength, kg | - | - | 0.4419 | < 0.001 |
| Right leg extension strength, kg | 0.5034 | < 0.0001 | - | - |
| Left leg extension strength, kg | - | - | 0.3963 | 0.0002 |
| SPPB | 0.1589 | 0.1142 | 0.1609 | 0.1099 |
| Correlation coefficient with right PhA | P | Correlation coefficient with left PhA | P | |
|---|---|---|---|---|
| ECW: extracellular water; eGFR: estimated glomerular filtration rate; FI: fat index; HbA1c: glycated hemoglobin; PhA: phase angle; SMI: skeletal muscle index; SPPB: Short Physical Performance Battery; TBW: total body water. | ||||
| Age, years | −0.4292 | < 0.0001 | −0.3674 | 0.0001 |
| Sex, female 1/male 2 | 0.2211 | 0.0268 | 0.2403 | 0.0152 |
| HbA1c, % | 0.0168 | 0.8677 | 0.0435 | 0.6665 |
| eGFR, mL/min/1.73 m2 | 0.1209 | 0.2292 | 0.1112 | 0.2269 |
| Serum albumin, g/dL | −0.0435 | 0.6657 | −0.0269 | 0.7896 |
| FI, kg/m2 | −0.1485 | 0.4821 | −0.1289 | 0.1987 |
| SMI, kg/m2 | 0.5949 | < 0.0001 | 0.6207 | < 0.0001 |
| ECW/TBW | −0.0286 | 0.7764 | −0.0506 | 0.6153 |
| Right handgrip strength, kg | 0.4929 | 0.0005 | - | - |
| Left handgrip strength, kg | - | - | 0.4277 | < 0.0001 |
| Right leg extension strength, kg | 0.4755 | <0.0001 | - | - |
| Left leg extension strength, kg | - | - | 0.4134 | < 0.0001 |
| SPPB | 0.2286 | 0.0215 | 0.2175 | 0.0289 |
| Coefficient of linkage (λ) with right PhA | P | Coefficient of linkage (λ) with left PhA | P | |
|---|---|---|---|---|
| ECW: extracellular water; FI: fat index; PhA: phase angle; SMI: skeletal muscle index; SPPB: Short Physical Performance Battery; TBW: total body water. | ||||
| FI, kg/m2 | −0.0704 | 0.4822 | −0.1290 | 0.1987 |
| SMI, kg/m2 | 0.5866 | < 0.0001 | 0.6525 | < 0.0001 |
| ECW/TBW | 0.0042 | 0.9665 | 0.0069 | 0.9448 |
| Right handgrip strength, kg | 0.5346 | 0.0005 | - | - |
| Left handgrip strength, kg | - | - | 0.2498 | 0.0176 |
| Right leg extension strength, kg | 0.2569 | 0.0145 | - | - |
| Left leg extension strength, kg | - | - | 0.3449 | 0.0011 |
| SPPB | 0.2884 | 0.0035 | 0.2619 | 0.0082 |