Figures
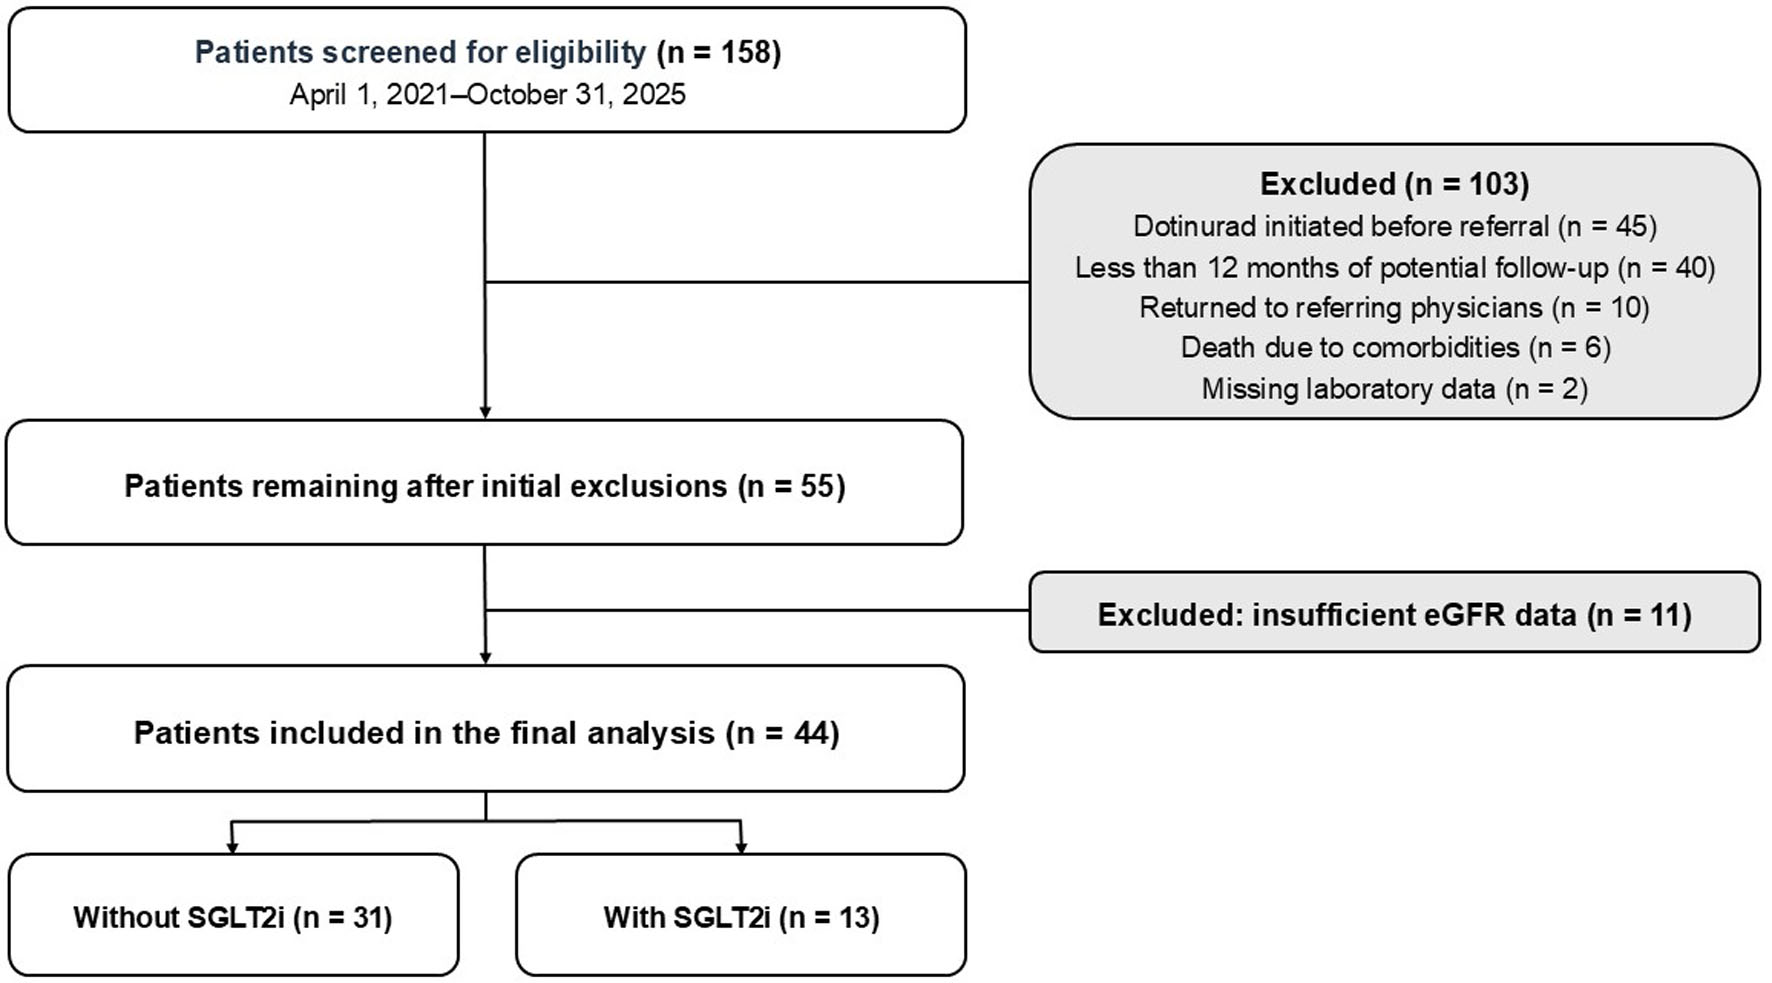
↓ Figure 1. Flow diagram of patient selection. Among the 158 patients receiving dotinurad during the study period, 114 were excluded for the reasons shown in the flowchart, leaving 44 patients for the final analysis. eGFR: estimated glomerular filtration rate; SGLT2i: sodium-glucose cotransporter 2 inhibitor; UA: uric acid.
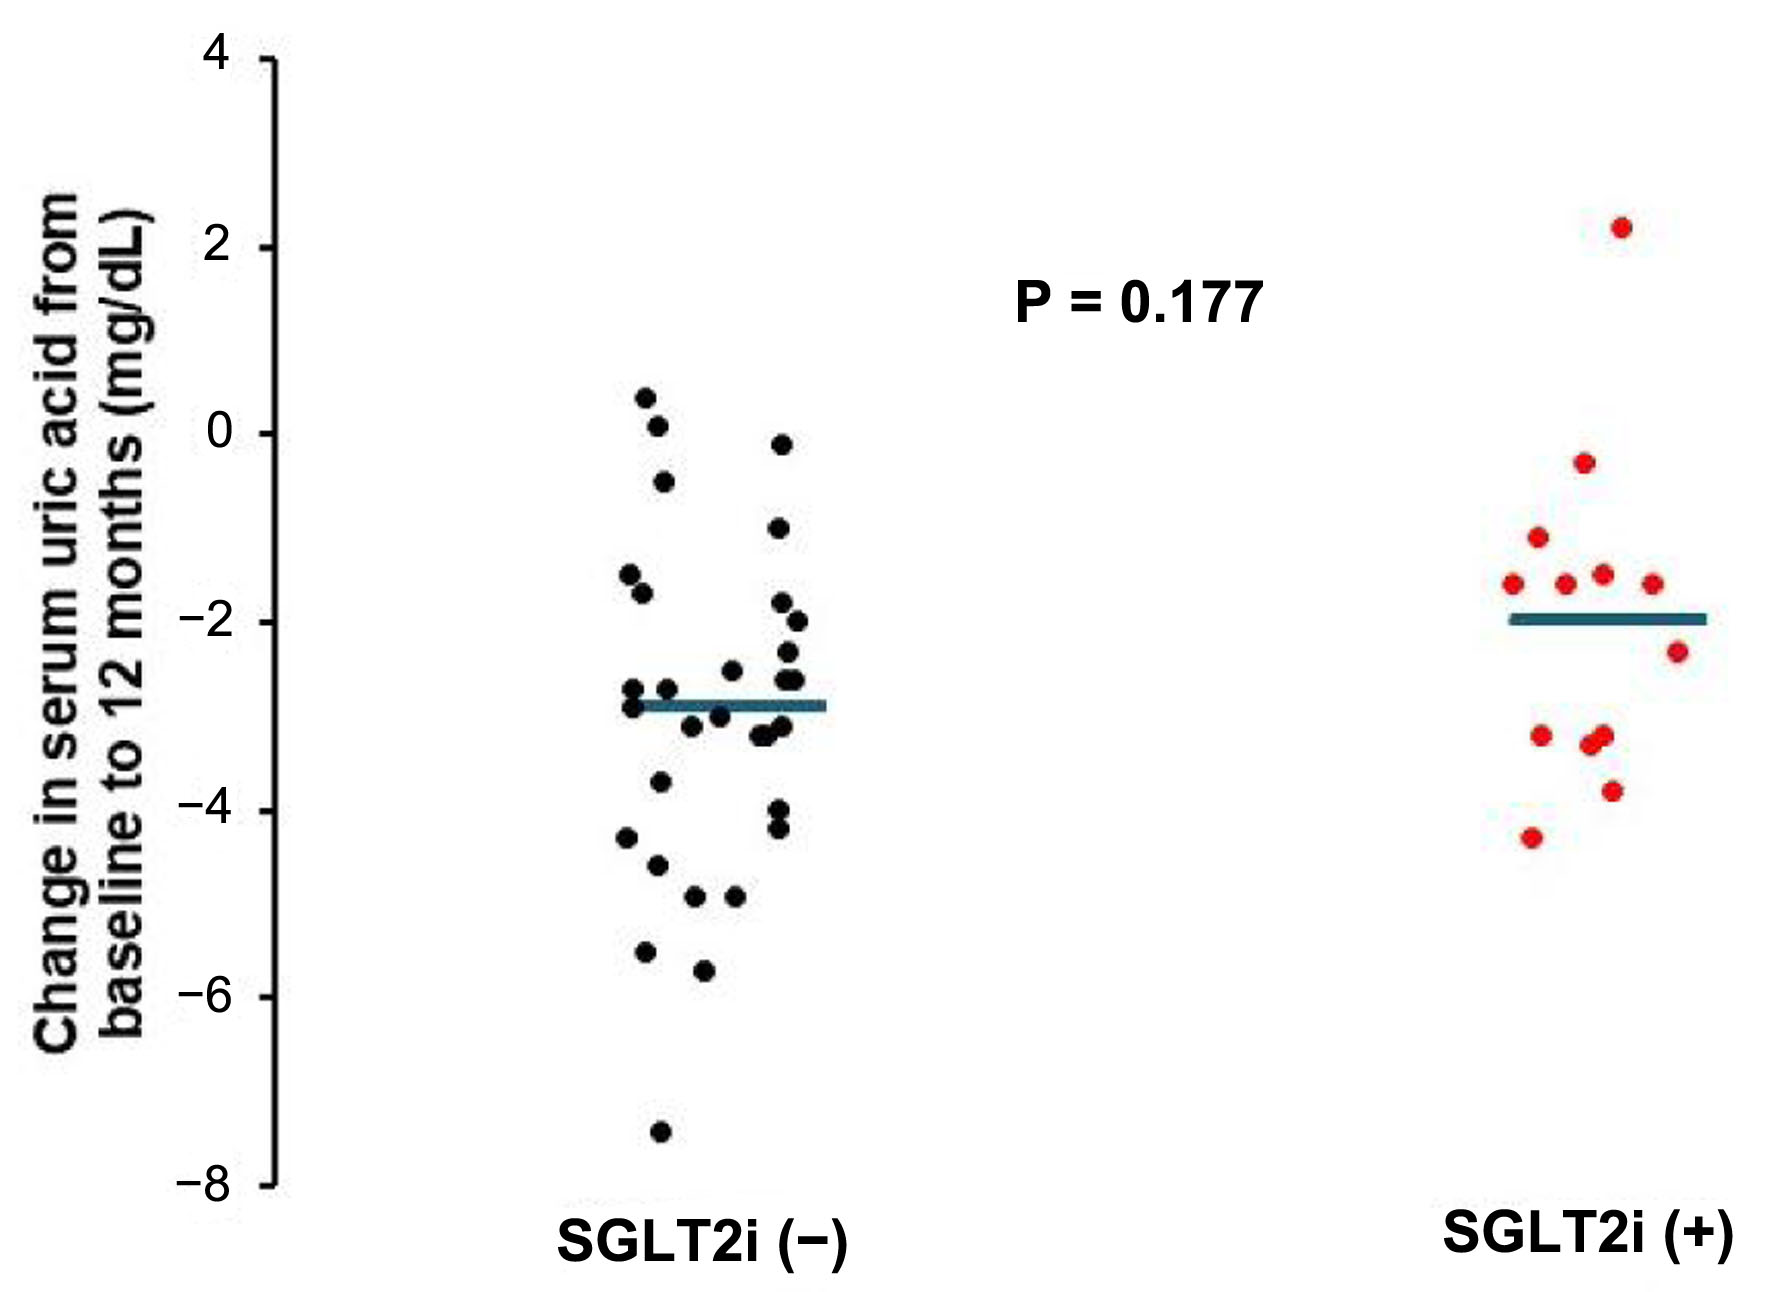
↓ Figure 2. Change in the serum uric acid levels from baseline to 12 months according to concomitant SGLT2 inhibitor use. Individual dots represent individual patients. Horizontal blue bars indicate mean values. The magnitude of the reduction in serum uric acid levels did not significantly differ between patients with and without concomitant SGLT2 inhibitor use (P = 0.177). SGLT2: sodium-glucose cotransporter 2.
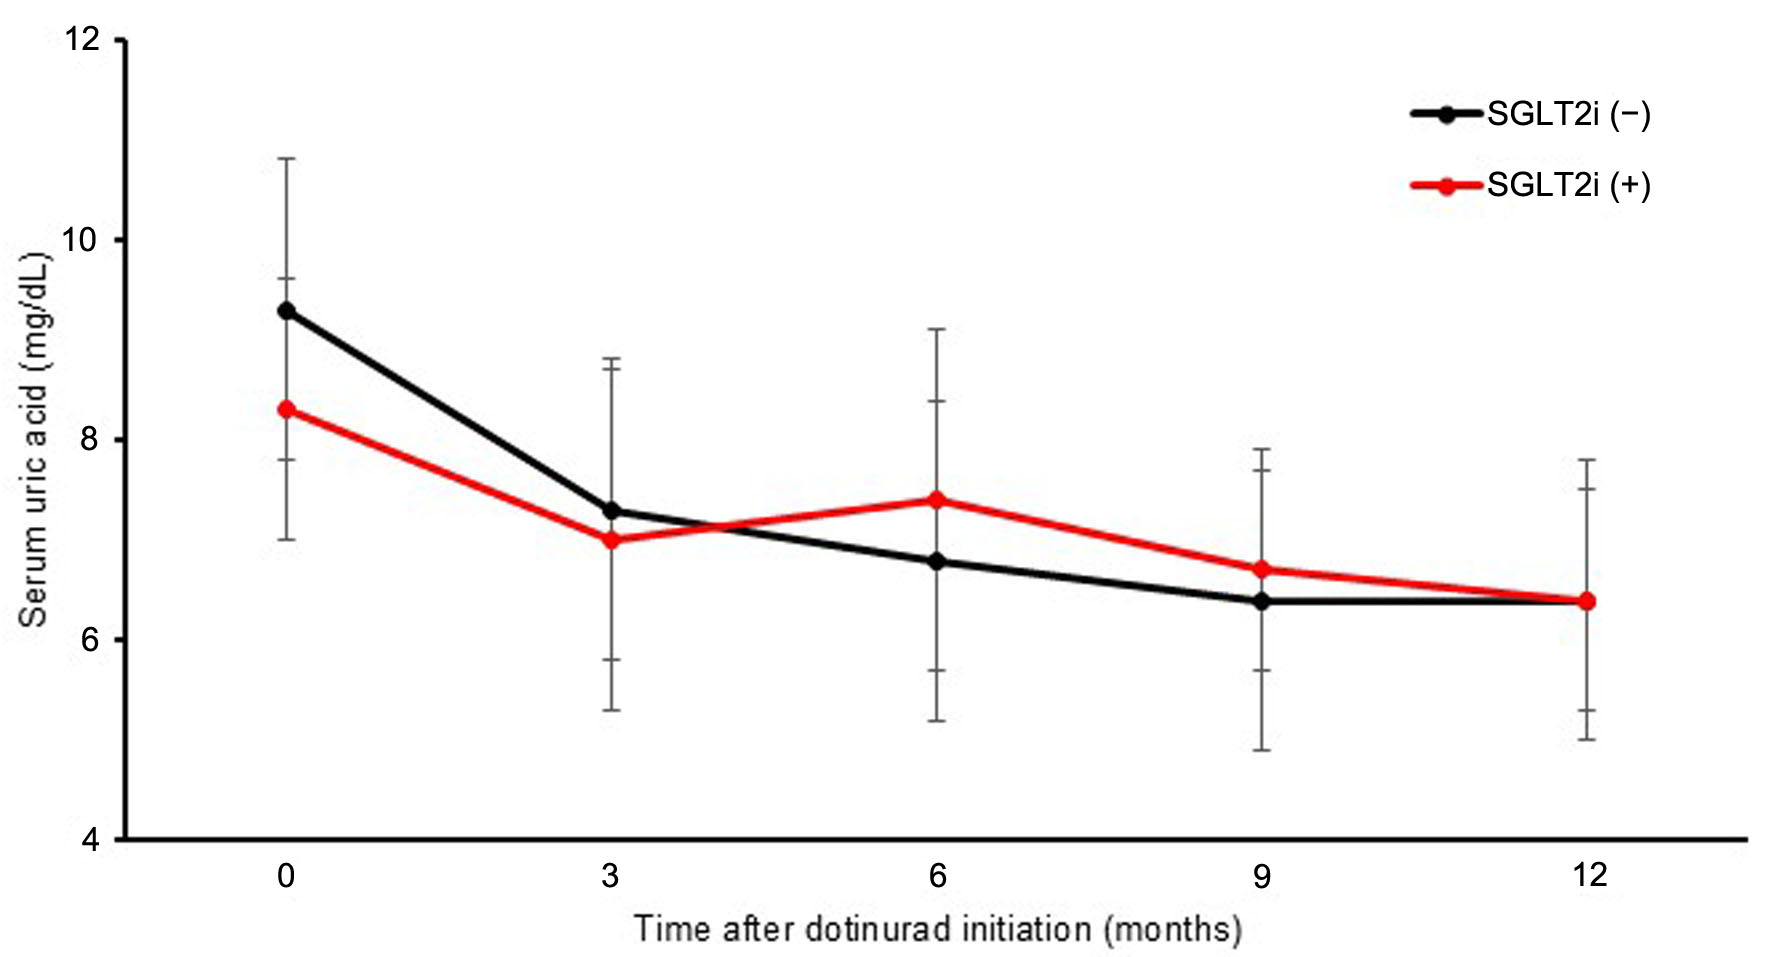
↓ Figure 3. Changes in the serum uric acid levels after initiation of dotinurad treatment according to concomitant SGLT2 inhibitor use. The serum uric acid levels significantly decreased from baseline to 12 months in both patients with and without concomitant SGLT2 inhibitor use. Data are presented as mean ± standard deviation. SGLT2: sodium-glucose cotransporter 2.
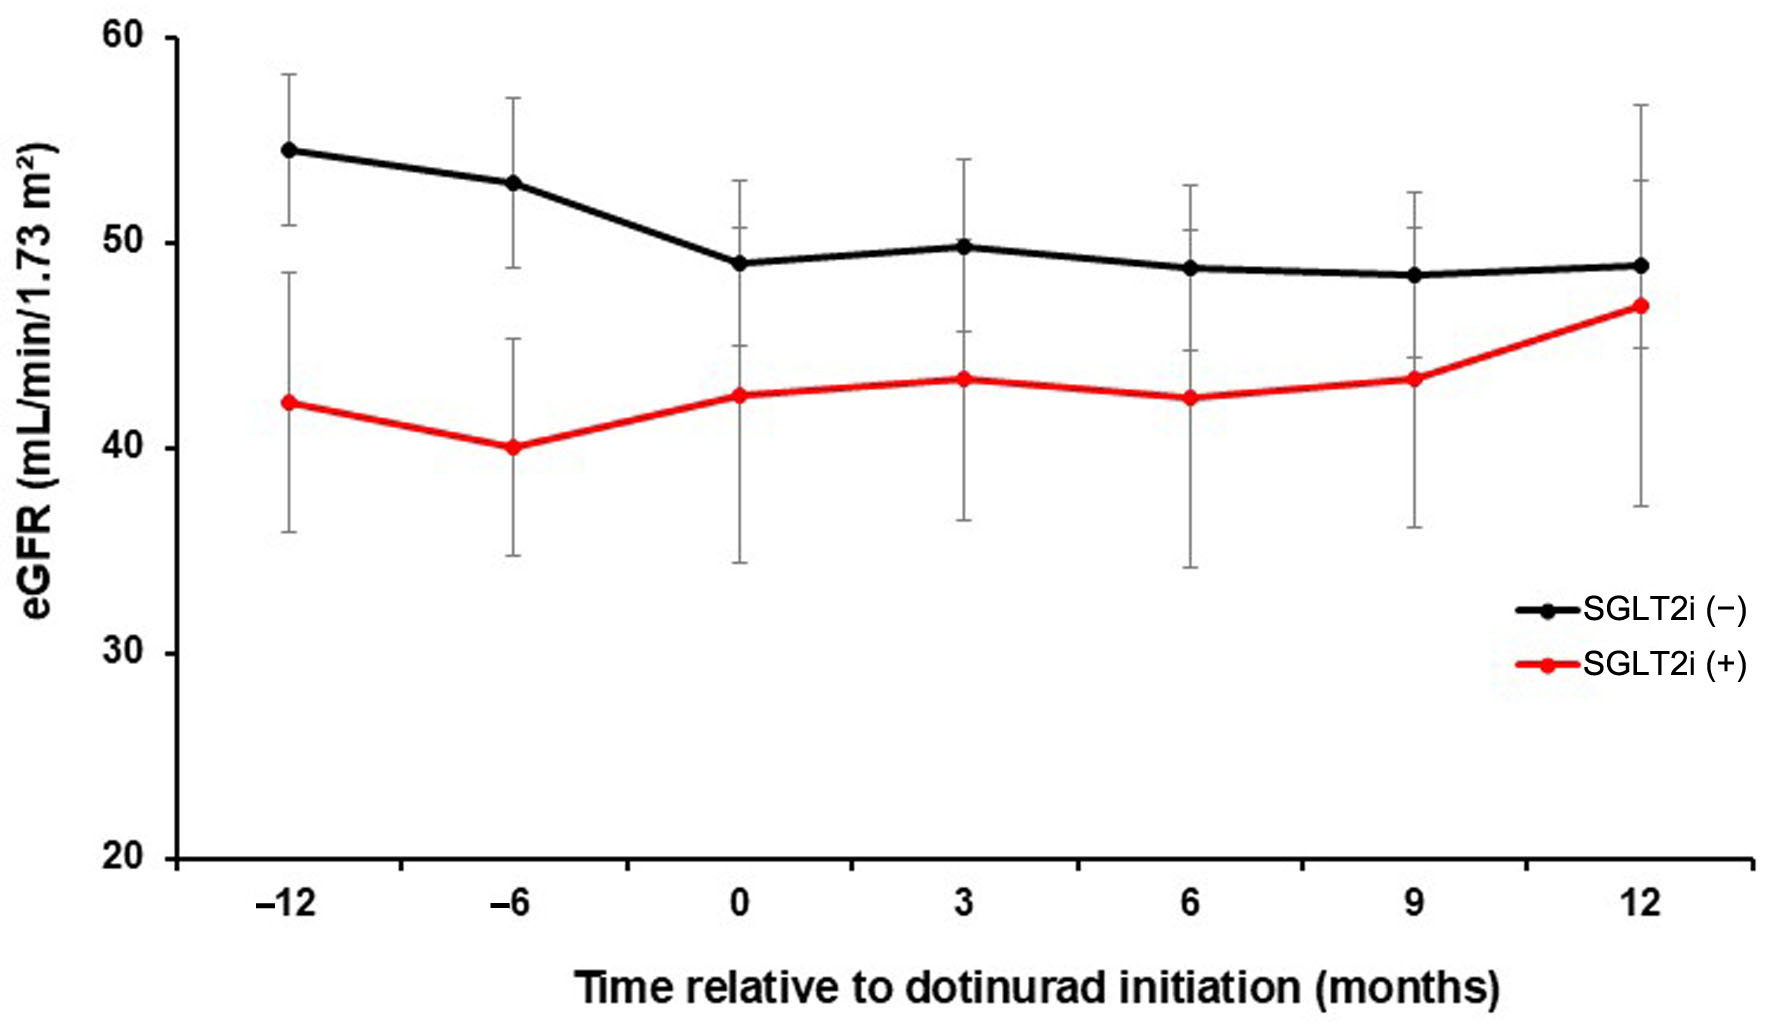
↓ Figure 4. Changes in the estimated glomerular filtration rate before and after dotinurad treatment initiation according to concomitant SGLT2 inhibitor use. The estimated glomerular filtration rate was assessed from 12 months before to 12 months after dotinurad treatment initiation in patients with and without concomitant SGLT2 inhibitor use. Data are presented as mean ± SD. SGLT2: sodium-glucose cotransporter 2.
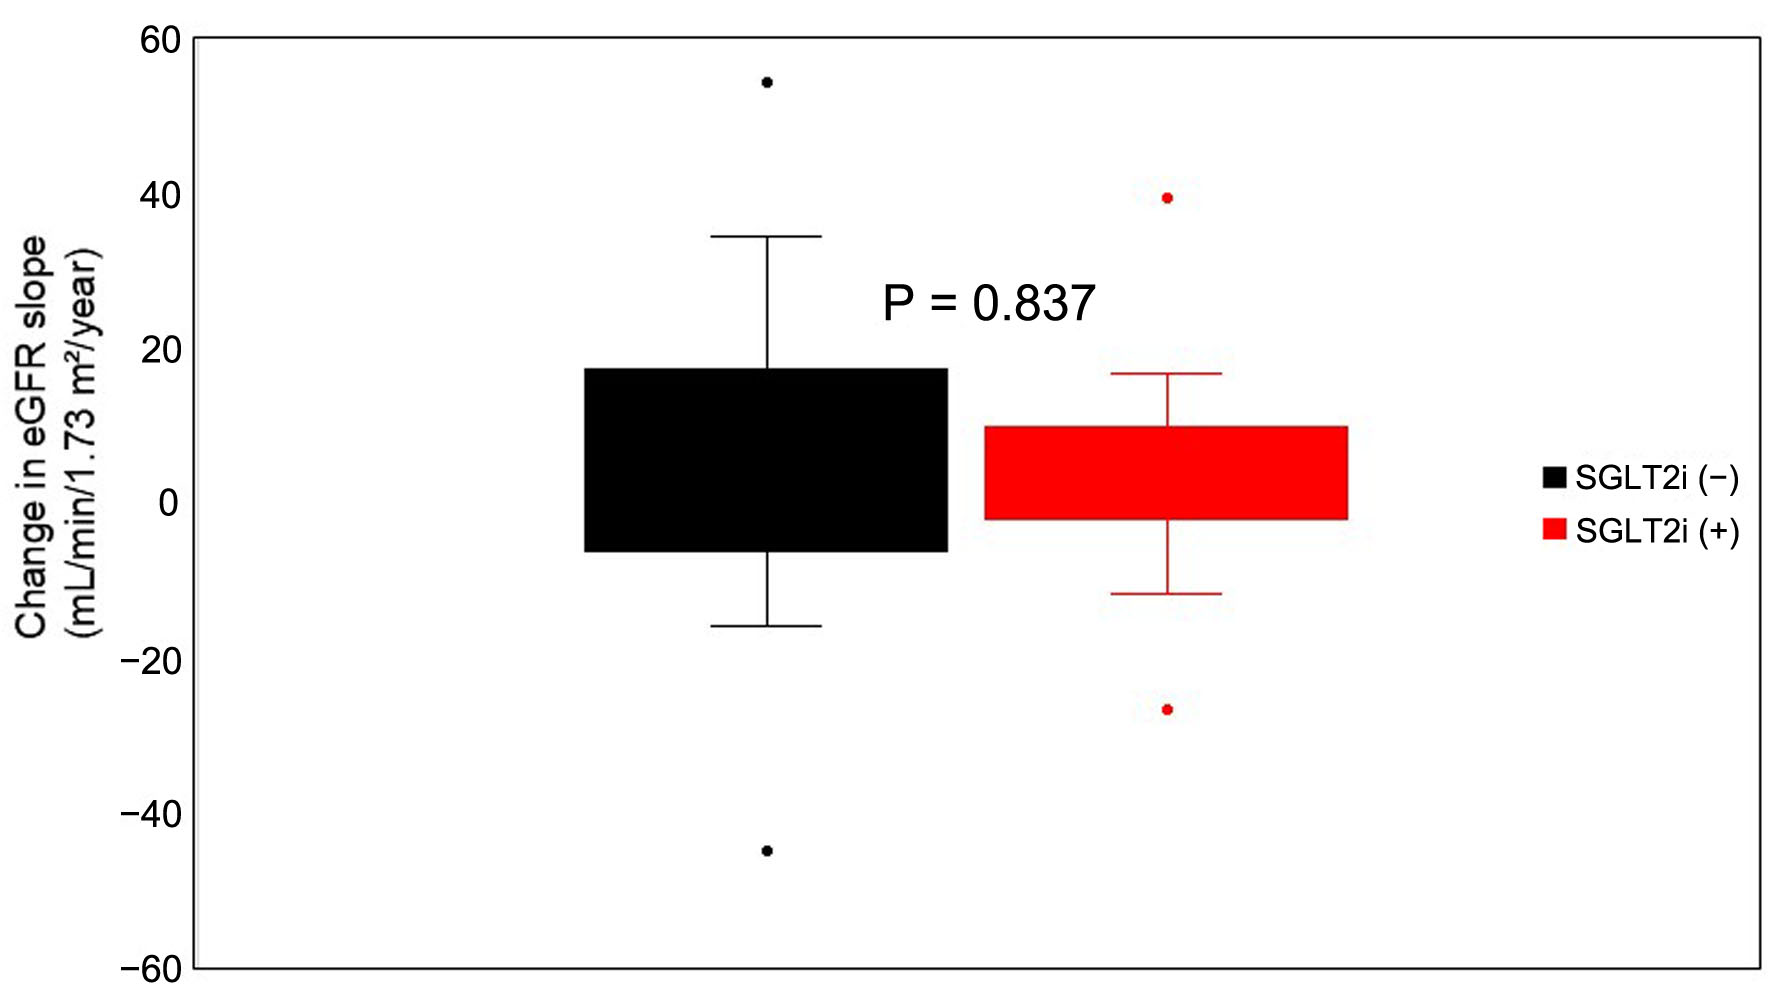
↓ Figure 5. Comparison of the changes in the eGFR slope after dotinurad treatment initiation. No statistically significant between-group difference was observed in the change in the eGFR slope (P = 0.837). eGFR: estimated glomerular filtration rate; SGLT2: sodium-glucose cotransporter 2.
Table
↓ Table 1. Baseline Characteristics of the Study Participants According to Concomitant SGLT2i Use
| Variable | SGLT2i (−) (n = 31) | SGLT2i (+) (n = 13) | P value | Statistical test |
|---|
| Values are expressed as mean ± standard deviation or number (%). eGFR: estimated glomerular filtration rate; SGLT2i: sodium-glucose cotransporter 2 inhibitor; UA: uric acid. |
| Age, years | 67.9 ± 16.1 | 67.6 ± 9.8 | 0.738 | Mann–Whitney U test |
| Male sex, n (%) | 17 (55) | 12 (92) | 0.034 | Fisher’s test |
| Diabetes mellitus | 4 (13) | 10 (77) | < 0.001 | Fisher’s test |
| Hypertension | 21 (68) | 11 (85) | 0.459 | Fisher’s test |
| Dotinurad initiation pattern | | | 0.110 | Fisher’s test |
| De novo | 24 (77.4%) | 6 (46.2%) | | |
| Switching | 3 (9.7%) | 4 (30.8%) | | |
| Add-on | 4 (12.9%) | 3 (23.1%) | | |
| Diuretic use | 16 (52) | 4 (31) | 0.321 | Fisher’s test |
| SGLT2i | | | | |
| Empagliflozin | - | 5 (38) | - | |
| Ipragliflozin | - | 4 (31) | - | |
| Dapagliflozin | - | 3 (23) | - | |
| Tofogliflozin | - | 1 (8) | - | |
| Serum UA, mg/dL | 9.3 ± 1.5 | 8.3 ± 1.3 | 0.022 | Mann–Whitney U test |
| eGFR, mL/min/1.73 m2 | 49.0 ± 22.2 | 42.5 ± 29.4 | 0.19 | Mann–Whitney U test |