Journal of Clinical Medicine Research, ISSN 1918-3003 print, 1918-3011 online, Open Access
Article copyright, the authors; Journal compilation copyright, J Clin Med Res and Elmer Press Inc
Journal website https://jocmr.elmerjournals.com

Original Article

Volume 18, Number 11, November 2026, pages 823-834


Serum Serotonin and Noninvasive Portal Hypertension Indices in Relation to Esophageal Variceal Severity in Cirrhosis: An Exploratory Cross-Sectional Study

Figures

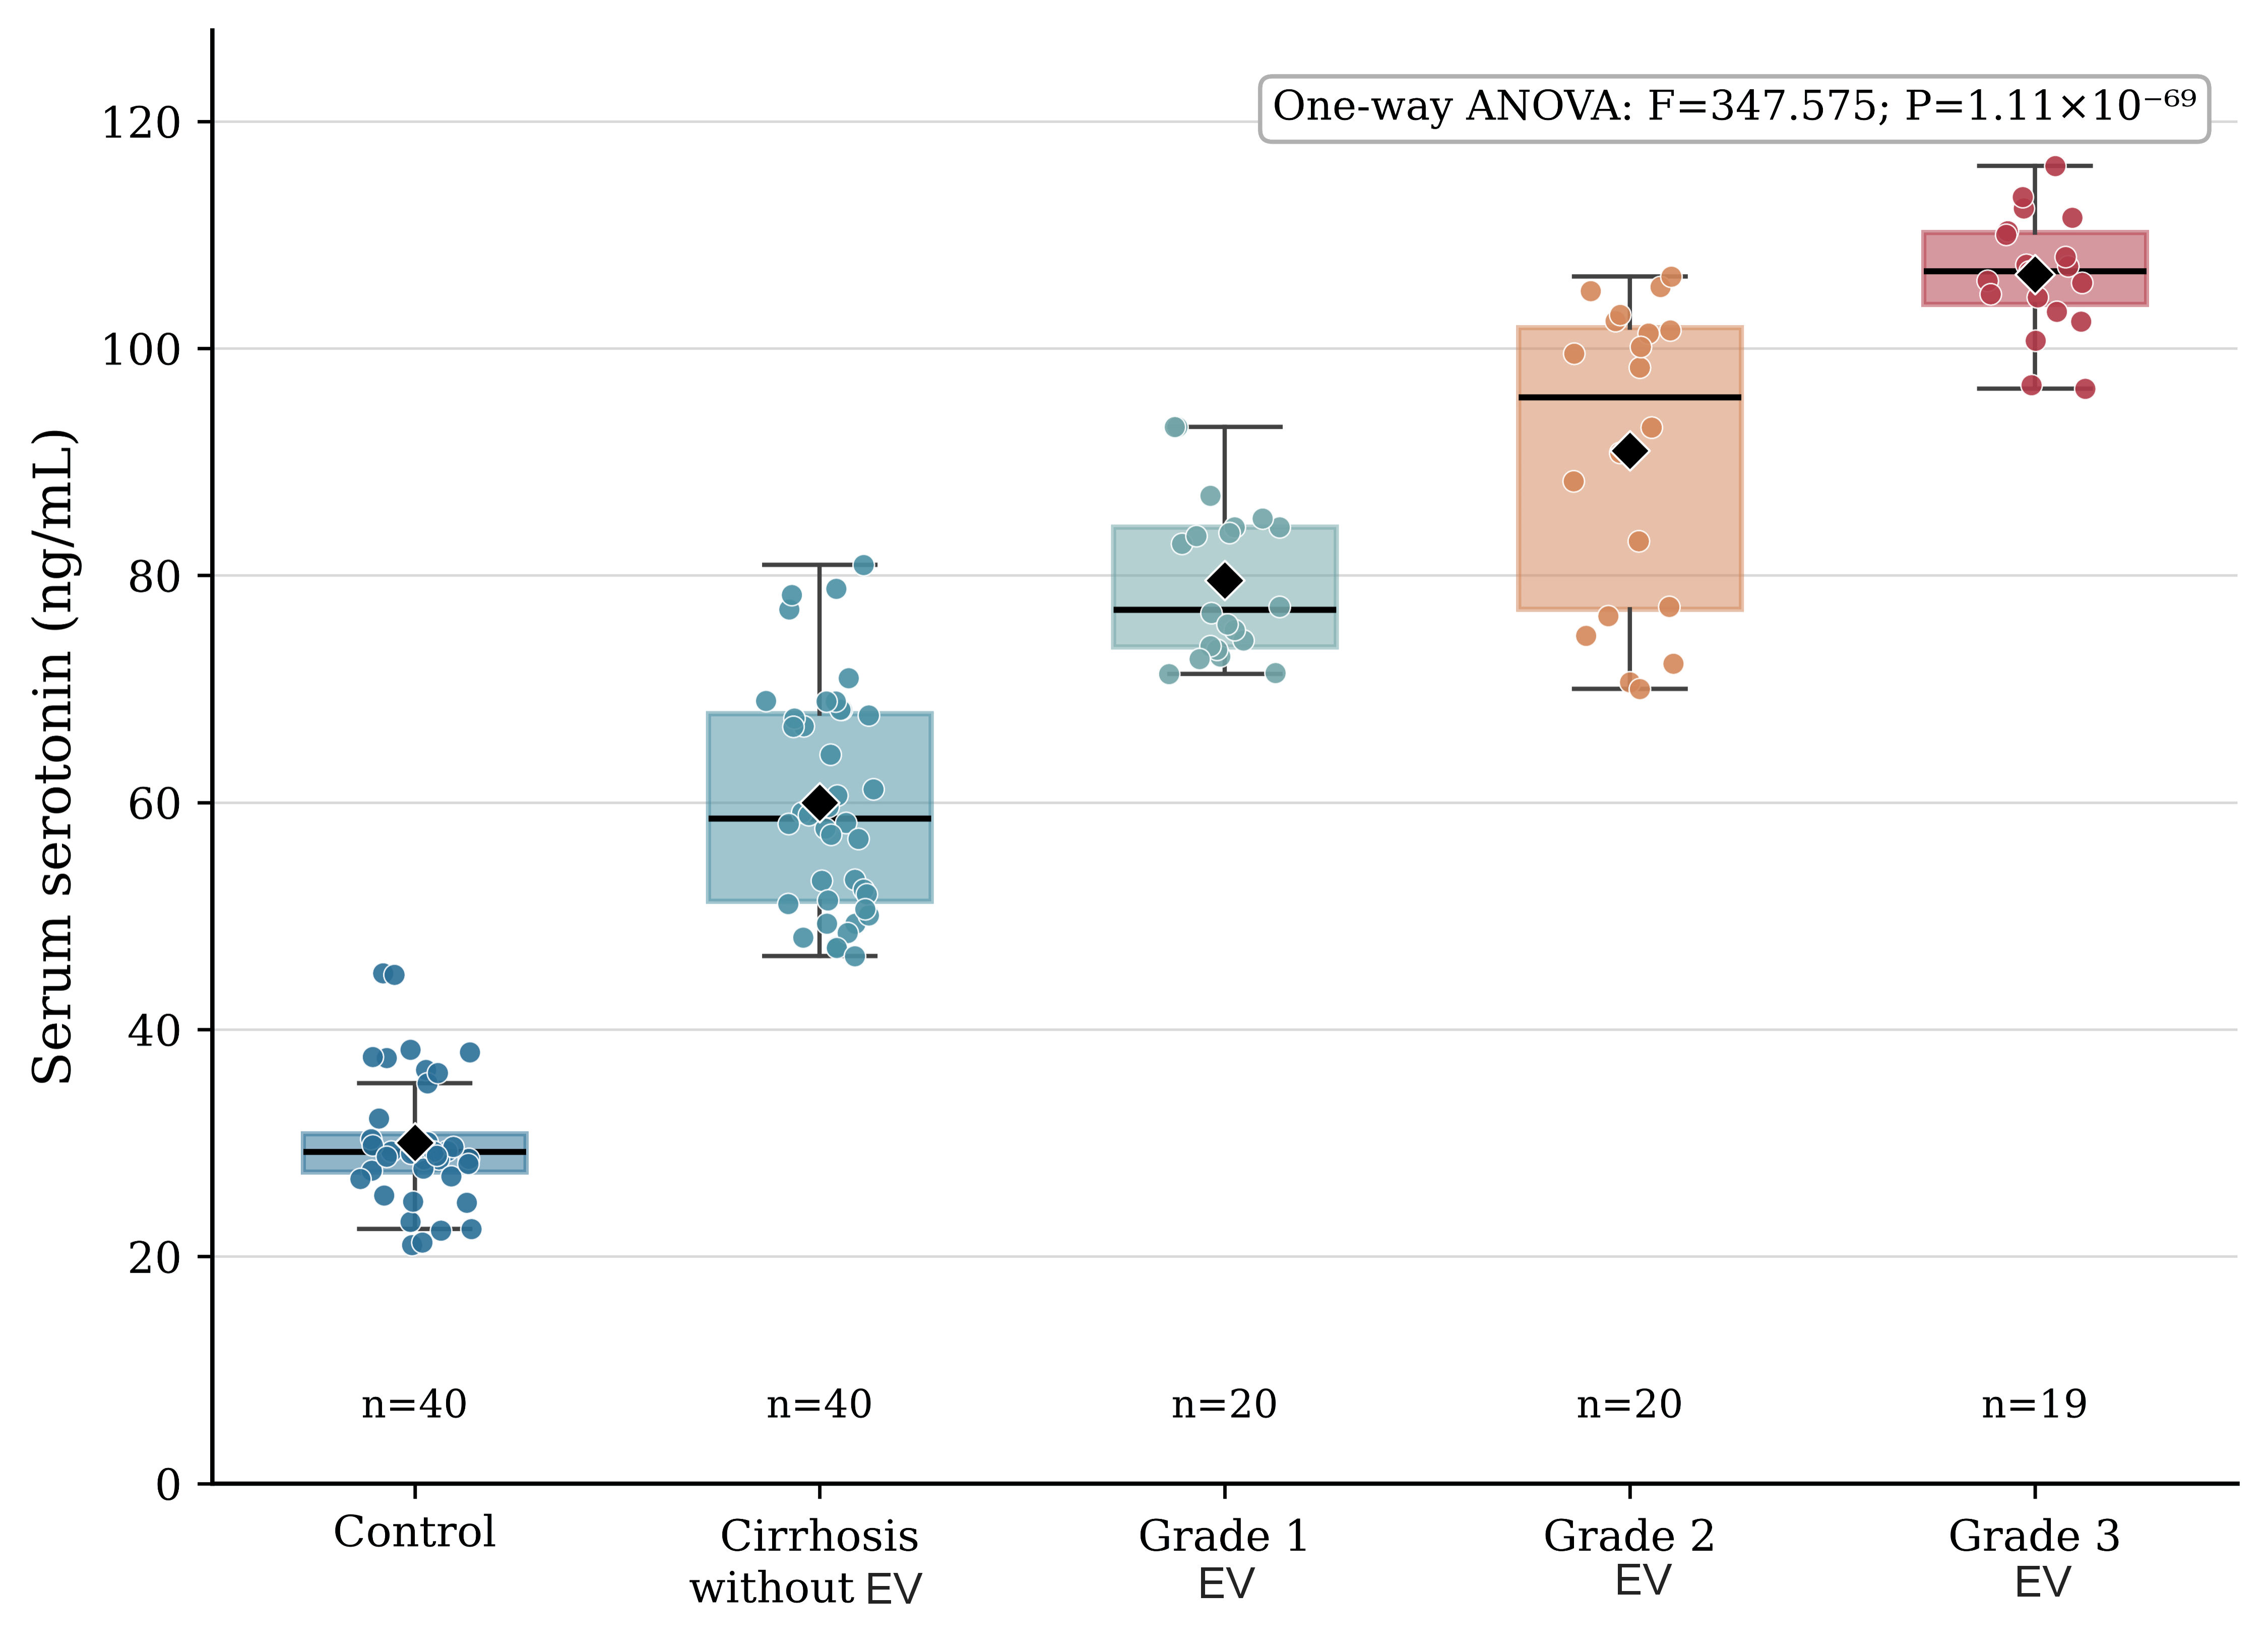
↓  Figure 1. Serum serotonin concentrations across study groups. Box plots show median, interquartile range, and range; diamonds indicate group means; dots represent individual participants (n = 19 in the grade 3 group owing to one non-numeric (missing) serotonin value). ANOVA: analysis of variance; EV: esophageal varices.
Figure 1.
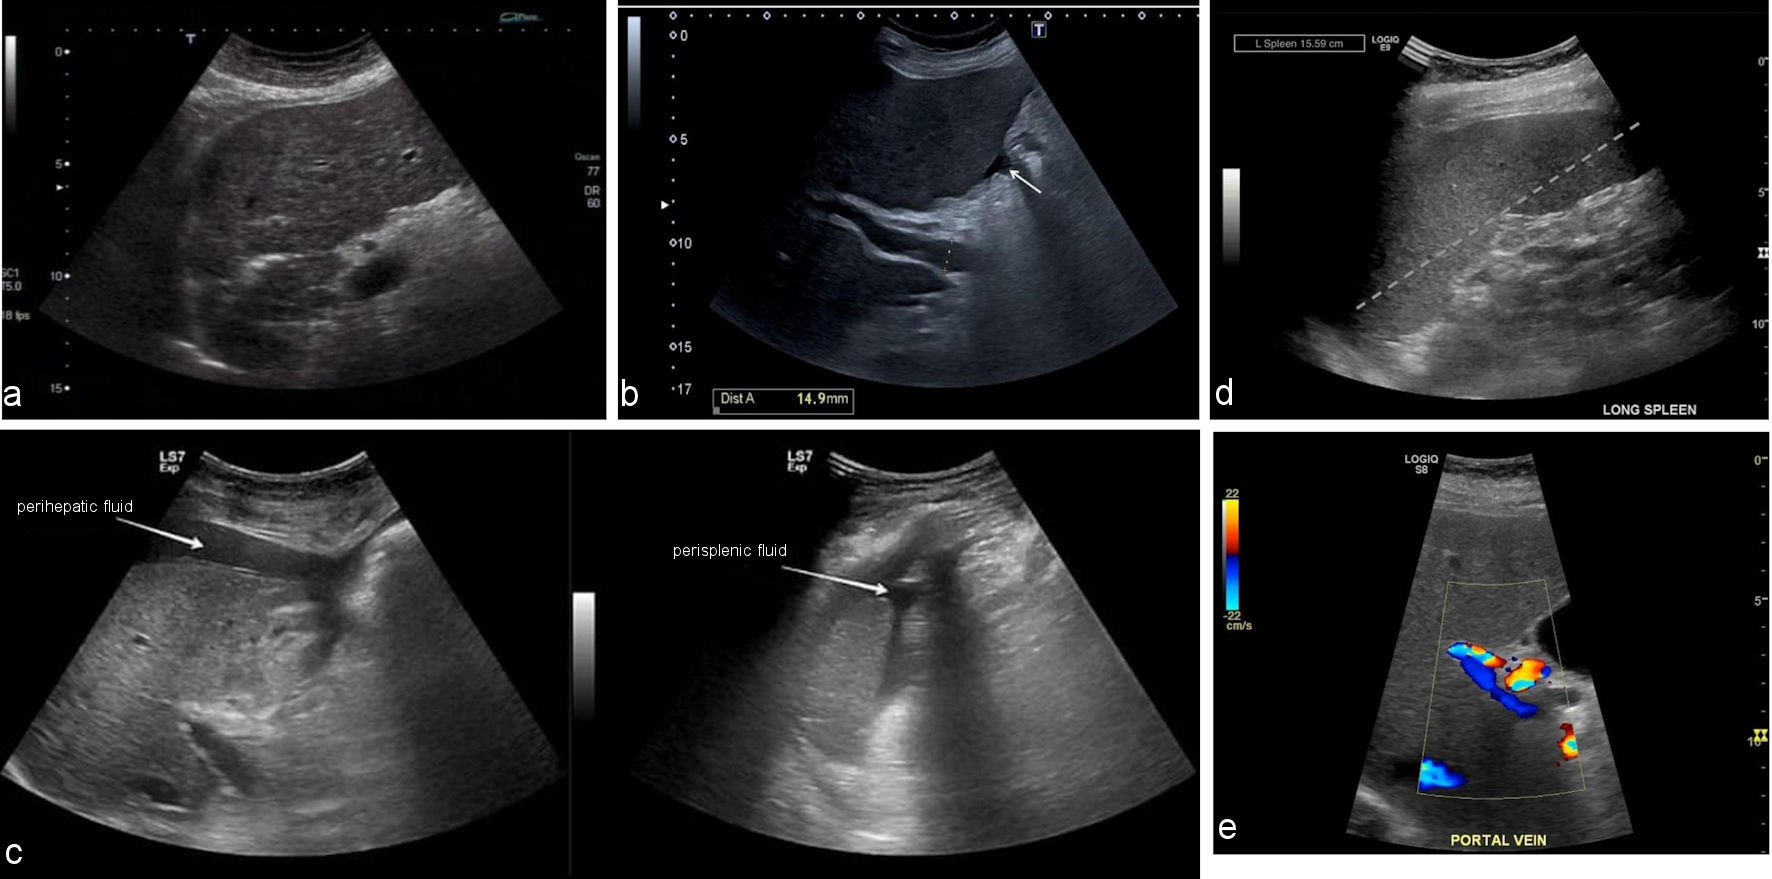
↓  Figure 2. Representative abdominal ultrasound findings of cirrhosis and portal hypertension in the study cohort. (a) Greyscale ultrasound of the liver showing coarse, heterogeneous parenchymal echotexture with an irregular, nodular surface contour, typical of cirrhosis. (b) Greyscale ultrasound with caliper measurement of the main portal vein showing a diameter of 14.9 mm (arrow), exceeding the normal upper limit of 13 mm and consistent with portal hypertension. (c) Greyscale ultrasound demonstrating free perihepatic (left) and perisplenic (right) fluid collections (arrows), consistent with ascites. (d) Greyscale ultrasound of the long axis of the spleen showing splenomegaly, with a measured splenic length of 15.59 cm (dashed line), consistent with portal hypertension. (e) Color Doppler ultrasound of the main portal vein showing preserved hepatopetal flow within a dilated vessel.
Figure 2.
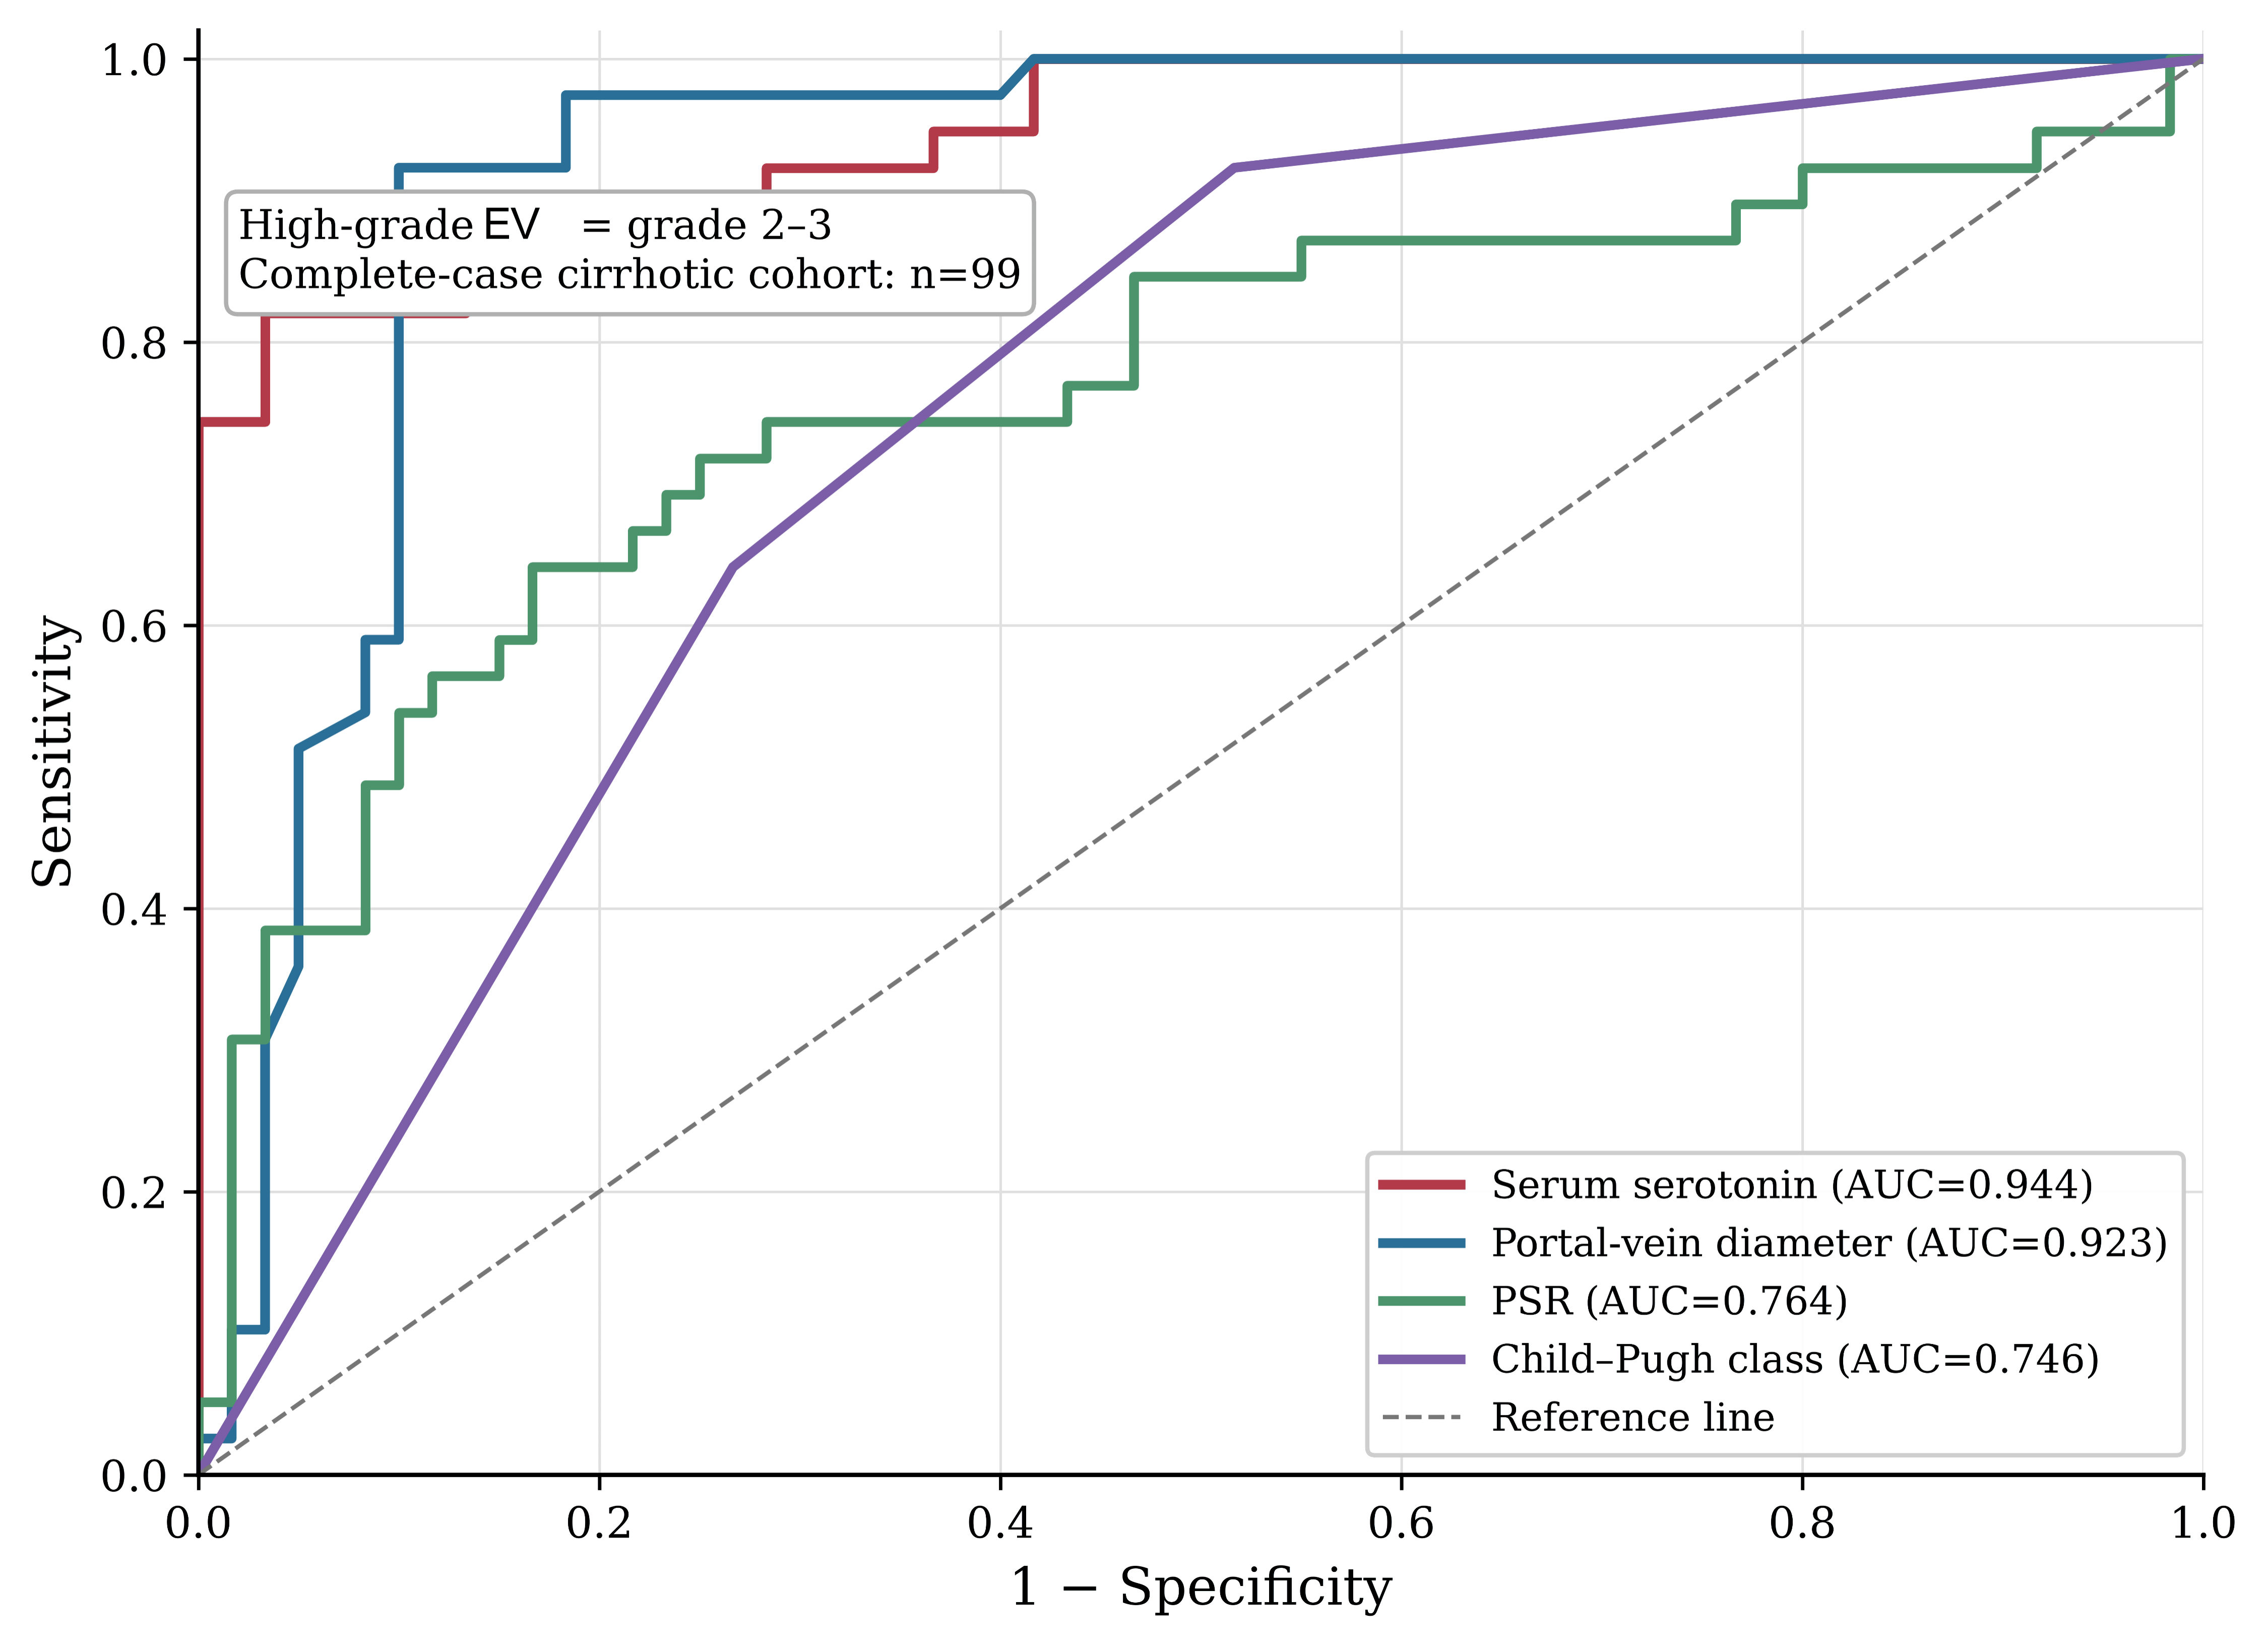
↓  Figure 3. Receiver operating characteristic curves for noninvasive markers of high-grade esophageal varices. The diagonal dashed line represents the line of non-discrimination (AUC = 0.5). EV: esophageal varices; AUC: area under the curve; PSR: platelet count to spleen diameter ratio.
Figure 3.

Tables

↓  Table 1. Baseline Demographic and Clinical Characteristics of the Study Cohort
 
CharacteristicControl (n = 40)Cirrhosis w/o EV (n = 40)Grade 1 EV (n = 20)Grade 2 EV (n = 20)Grade 3 EV (n = 20)Statistic, P value
Values are median (IQR), n (%), or as stated. aNot applicable to controls, who had no cirrhosis or hepatic decompensation; percentages and statistics for these rows are computed across the four cirrhotic groups only (n = 100). FFH: Fisher–Freeman–Halton exact test; H: Kruskal–Wallis statistic; χ2: chi-square statistic; EV: esophageal varices.
Age, years, median (IQR)50 (43–61)48 (43–65)50 (42–60)60 (49–64)58 (54–61)H = 9.120; P = 0.058
Male sex, n (%)30 (75.0)28 (70.0)12 (60.0)12 (60.0)13 (65.0)χ2 = 2.227; P = 0.694
Duration of liver disease, years, median (IQR)a—9 (8–10)9 (8–13)10 (8–12)13 (12–14)H = 26.589; P < 0.001
Jaundice, n (%)a—4 (10.0)2 (10.0)5 (25.0)10 (50.0)χ2 = 14.708; P = 0.002
Ascites, n (%)a—3 (7.5)1 (5.0)3 (15.0)6 (30.0)FFH P = 0.068
Gastrointestinal bleeding, n (%)a—0 (0.0)7 (35.0)9 (45.0)15 (75.0)χ2 = 38.055; P < 0.001
Lower-limb edema, n (%)a—5 (12.5)2 (10.0)5 (25.0)11 (55.0)χ2 = 16.008; P = 0.001
Splenomegaly (clinical), n (%)a—10 (25.0)11 (55.0)16 (80.0)19 (95.0)χ2 = 32.630; P < 0.001


↓  Table 2. Biochemical and Hematological Profile Across Study Groups
 
VariableControlCirrhosis without EVGrade 1 EVGrade 2 EVGrade 3 EVStatistic, P value
Values are mean ± SD (compared by one-way ANOVA, F) or median (IQR) (compared by Kruskal–Wallis test, H), according to the Shapiro–Wilk normality of model residuals for each variable. ALT: alanine aminotransferase; AST: aspartate aminotransferase; ALP: alkaline phosphatase; INR: international normalized ratio. EV: esophageal varices; SD: standard deviation; ANOVA: analysis of variance; IQR: interquartile range.
Platelet count, × 109/L, mean ± SD295.1 ± 30.4257.6 ± 69.9201.5 ± 94.9149.3 ± 67.2118.3 ± 41.8F = 38.746; P < 0.001
Prothrombin time, s, median (IQR)11.0 (11.0–11.2)22.0 (20.8–23.0)21.0 (20.0–23.0)22.0 (20.0–24.0)24.0 (22.8–25.3)H = 91.576; P < 0.001
INR, median (IQR)1.00 (1.00–1.02)2.00 (1.89–2.09)1.91 (1.82–2.09)2.00 (1.82–2.18)2.18 (2.07–2.30)H = 91.576; P < 0.001
Total bilirubin, mg/dL, median (IQR)0.86 (0.79–0.90)1.53 (1.48–1.58)1.60 (1.58–1.73)1.75 (1.70–2.17)2.60 (1.88–5.10)H = 107.648; P < 0.001
Direct bilirubin, mg/dL, median (IQR)0.39 (0.32–0.49)0.61 (0.53–0.72)0.67 (0.65–0.74)0.81 (0.71–1.12)1.25 (0.79–1.40)H = 91.459; P < 0.001
ALT, U/L, median (IQR)21.0 (18.0–24.0)59.5 (38.8–91.3)65.0 (56.0–74.5)78.0 (66.5–88.8)102.0 (85.0–117.3)H = 94.478; P < 0.001
AST, U/L, median (IQR)28.0 (25.0–31.3)78.0 (52.0–107.3)78.5 (71.5–86.3)95.0 (81.3–100.3)118.5 (98.0–130.0)H = 93.637; P < 0.001
ALP, U/L, median (IQR)142.0 (140.0–144.5)143.0 (133.3–154.0)143.0 (134.8–154.0)147.5 (136.3–154.3)152.5 (138.3–155.0)H = 6.023; P = 0.197
Albumin, g/dL, mean ± SD4.15 ± 0.123.05 ± 0.152.67 ± 0.202.59 ± 0.122.37 ± 0.20F = 659.734; P < 0.001
Total protein, g/dL, median (IQR)6.84 (6.76–6.93)5.54 (5.43–5.63)5.40 (5.30–5.45)5.29 (5.21–5.38)5.14 (5.04–5.27)H = 112.478; P < 0.001
Serum serotonin, ng/mL, mean ± SD (n)30.0 ± 5.6 (40)60.0 ± 9.8 (40)79.6 ± 6.9 (20)91.0 ± 13.2 (20)106.5 ± 5.2 (19)F = 347.575; P < 0.001


↓  Table 3. Ultrasonographic Findings and Composite Portal Hypertension Indices
 
VariableControlCirrhosis without EVGrade 1 EVGrade 2 EVGrade 3 EVStatistic, P value
Values are mean ± SD, median (IQR), or n (%). PSR was calculated for each participant individually as platelet count (× 109/L) divided by spleen diameter (cm), multiplied by 100. aGroup means are the mean of each participant’s individually calculated ratio, not the ratio of group-mean platelet count to group-mean spleen diameter. bChild-Pugh class was not assigned in controls (no cirrhosis); the chi-square test for class distribution was computed across the four cirrhotic groups only. EV: esophageal varices. PSR: platelet count to spleen diameter ratio.
Liver size, cm, median (IQR)13.68 (13.52–13.87)10.21 (9.88–10.62)9.97 (9.81–10.14)9.89 (9.71–10.01)9.88 (9.73–10.01)H = 92.211; P < 0.001
Portal-vein diameter, mm, mean ± SD10.03 ± 0.6913.17 ± 1.3014.04 ± 0.4314.72 ± 0.3315.13 ± 0.37F = 190.412; P < 0.001
Splenic-vein diameter, mm, mean ± SD6.31 ± 0.6810.31 ± 0.4710.24 ± 0.4511.04 ± 0.3511.36 ± 0.42F = 525.304; P < 0.001
Spleen diameter, cm, median (IQR)8.60 (8.08–8.94)10.61 (10.12–11.61)11.91 (10.05–13.24)13.63 (12.54–14.93)15.34 (14.82–16.04)H = 102.260; P < 0.001
PSRa, mean ± SD3,503.9 ± 482.82,392.4 ± 778.11,613.2 ± 970.01,355.6 ± 780.8829.8 ± 553.0F = 63.593; P < 0.001
Increased liver echogenicity, n (%)0 (0.0)36 (90.0)14 (70.0)16 (80.0)14 (70.0)χ2 = 141.472; P < 0.001
Child-Pugh class A/B/C, nb—/—/—20/10/109/5/62/6/121/5/14χ2 = 21.556; P = 0.001


↓  Table 4. Univariable Correlation and Multivariable Ordinal Regression Analysis of Predictors of Esophageal Variceal Severity (N = 59–60, Participants With Grade 1–3 Varices)
 
PredictorSpearman ρ (univariable)P valueAdjusted OR (95% CI), multivariableP value
Ordinal (proportional-odds) logistic regression model, n = 59 (complete serotonin data); likelihood-ratio χ2 = 77.882, df = 6, P < 0.001, McFadden pseudo-R2 = 0.601. Platelet count and spleen diameter were not entered alongside PSR because of direct mathematical overlap. Portal vein diameter is expressed per 0.1-mm increase because of its narrow range among participants with varices; the equivalent estimate per 1-mm increase is 197.1 (95% CI, 12.7–3059.4). Given the number of parameters relative to the sample size, adjusted estimates are exploratory; Firth-penalized estimates were 5.68 (2.19–14.70) for serotonin and 1.56 (1.24–1.96) for portal vein diameter, and in a model containing only these two variables, 4.19 (1.87–9.41) and 1.53 (1.24–1.89), respectively. OR: odds ratio; CI: confidence interval.
Serum serotonin, per 10 ng/mL0.759< 0.0017.48 (2.29–24.41)0.0009
Portal-vein diameter, per 0.1 mm0.754< 0.0011.70 (1.29–2.23)0.0002
Child-Pugh class, per class0.3950.0020.36 (0.09–1.46)0.152
PSR, per 100-unit decrease−0.3810.0030.94 (0.84–1.06)0.323
Age, per 1 year——1.03 (0.95–1.13)0.477
Male sex——0.61 (0.13–2.81)0.523


↓  Table 5. Diagnostic Performance (ROC Analysis) of Noninvasive Markers for Identifying Grade 2 or 3 Esophageal Varices
 
MarkerNAUC (95% CI)CutoffSensitivity/specificity, %PPV/NPV, %
Positive cases were grade 2 or 3 varices (n = 39); negative cases were no varices or grade 1 varices (n = 60), among 99 cirrhotic participants with complete serotonin data. Cutoffs were selected by the Youden index. The 95% Cis were obtained by stratified bootstrap resampling (2,000–3,000 replicates). PPV and NPV are shown at the prevalence of high-grade varices in this sample (39.4%), which was fixed by the stratified design; prevalence-independent likelihood ratios and prevalence-adjusted predictive values are given in Table 6. All cutoffs were derived and evaluated in the same sample and are exploratory. Pairwise DeLong comparisons of AUCs: serotonin vs portal vein diameter, P = 0.553; serotonin vs PSR, P < 0.001; serotonin vs Child-Pugh class, P < 0.001; portal vein diameter vs PSR, P = 0.004; portal vein diameter vs Child-Pugh class, P < 0.001; PSR vs Child-Pugh class, P = 0.687. AUC, area under the receiver operating characteristic curve; PPV, positive predictive value; NPV, negative predictive value;
Serum serotonin, ng/mL990.944 (0.895–0.980)≥ 88.3282.1/96.794.1/89.2
Portal-vein diameter, mm990.923 (0.864–0.974)≥ 14.4192.3/90.085.7/94.7
PSR990.764 (0.660–0.861)≤ 948.9564.1/83.371.4/78.1
Child-Pugh class990.746 (0.654–0.830)≥ 2.0092.3/48.353.7/90.6


↓  Table 6. Exploratory Accuracy Measures for Identifying Grade 2 or 3 Esophageal Varices: Optimism-Corrected, Prevalence-Independent, and Prevalence-Adjusted Estimates
 
Marker (cutoff)Apparent sensitivity, % (95% CI)Apparent specificity, % (95% CI)Optimism-corrected sensitivity/specificity, %LR+/LR−PPV/NPV at 10%; 25% prevalence, %
Positive cases were grade 2 or 3 varices (n = 39) and negative cases were no varices or grade 1 varices (n = 60), among 99 cirrhotic participants with complete serotonin data; the observed prevalence was 39.4%. Confidence intervals for sensitivity and specificity were calculated by the Wilson score method. Optimism-corrected values were obtained by bootstrap internal validation (1,000 stratified resamples), re-deriving the Youden cutoff in each resample and applying it to the original sample. PPV and NPV at 10% and 25% prevalence were calculated by Bayes’ theorem from the apparent sensitivity and specificity and are illustrative; they assume that sensitivity and specificity are unchanged in a population with a different case mix, which may not hold (spectrum effect). Cutoffs were derived in this sample and require external validation. LR+: positive likelihood ratio (sensitivity divided by (1 − specificity)); LR−: negative likelihood ratio ((1 − sensitivity) divided by specificity). PSR: platelet count to spleen diameter ratio; PPV: positive predictive value; NPV: negative predictive value; CI: confidence interval.
Serum serotonin (≥ 88.32 ng/mL)82.1 (67.3–91.0)96.7 (88.6–99.1)80.1/95.924.6/0.1973.2/98.0; 89.1/94.2
Portal-vein diameter (≥ 14.41 mm)92.3 (79.7–97.3)90.0 (79.9–95.3)90.2/89.19.2/0.0950.6/99.1; 75.5/97.2
PSR (≤≤ 948.95)64.1 (48.4–77.3)83.3 (72.0–90.7)60.2/81.23.8/0.4329.9/95.4; 56.2/87.4
Child-Pugh class (≥ B)92.3 (79.7–97.3)48.3 (36.2–60.7)90.1/47.21.8/0.1616.6/98.3; 37.3/95.0