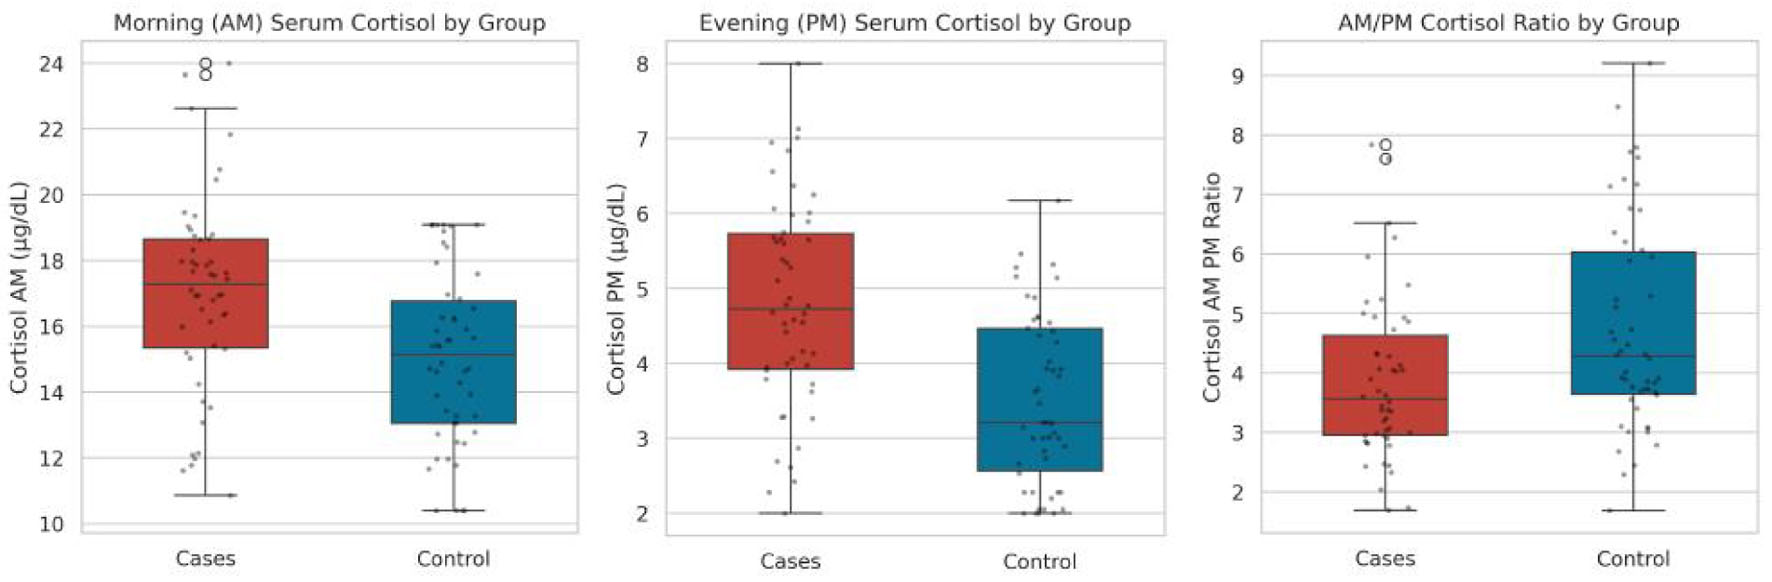
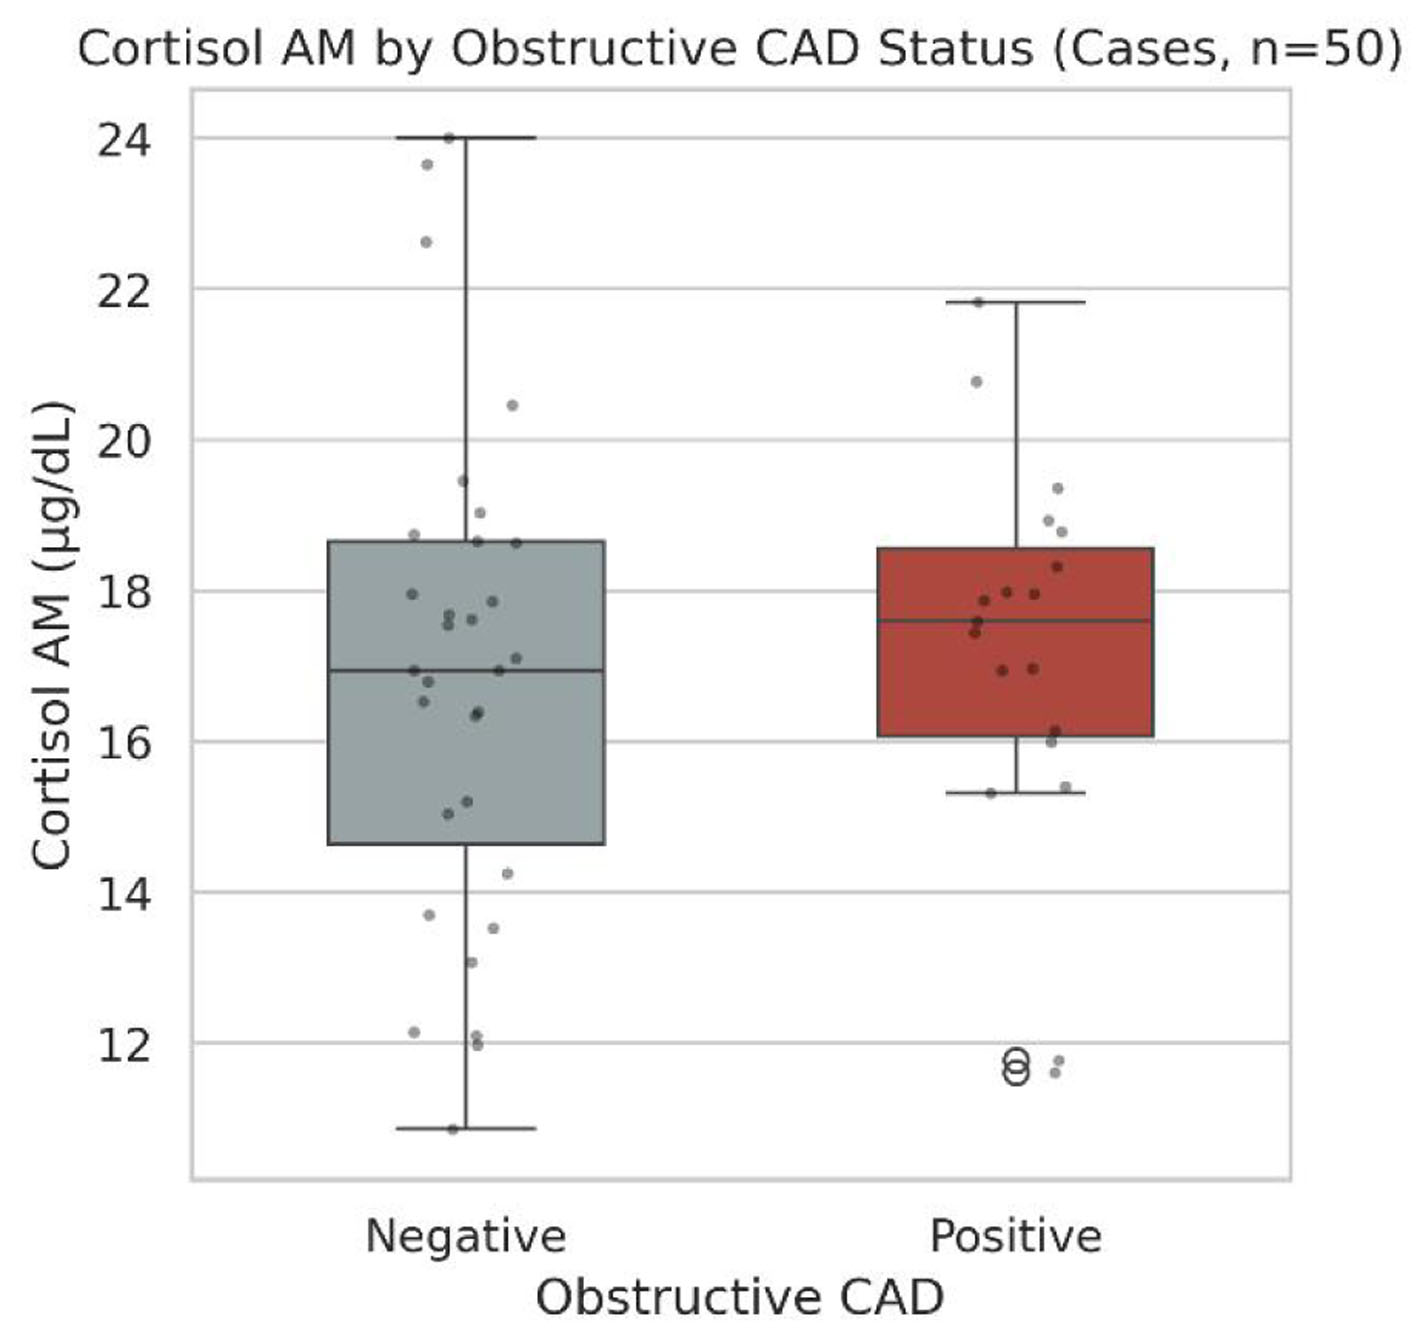
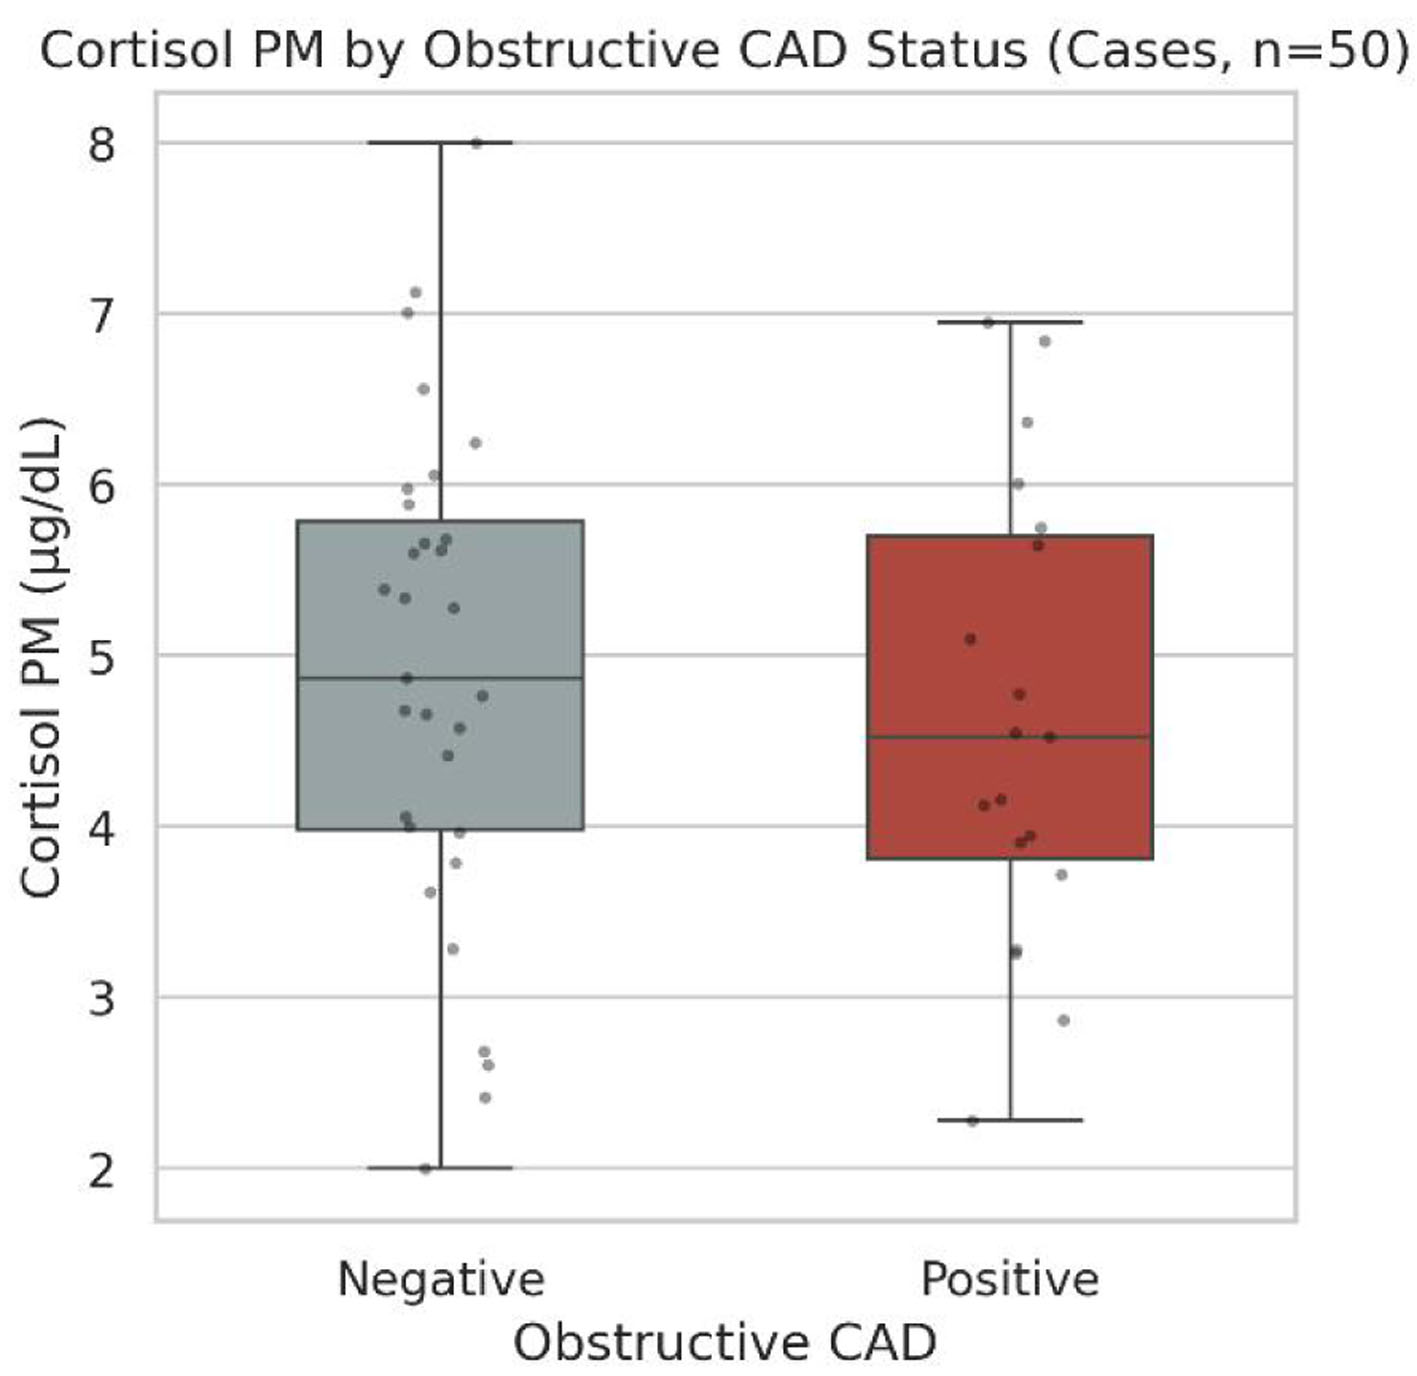
↓ Figure 1. Morning (AM) serum cortisol, evening (PM) serum cortisol, and AM/PM cortisol ratio by group.
| Journal of Clinical Medicine Research, ISSN 1918-3003 print, 1918-3011 online, Open Access |
| Article copyright, the authors; Journal compilation copyright, J Clin Med Res and Elmer Press Inc |
| Journal website https://jocmr.elmerjournals.com |
Original Article
Volume 18, Number 11, November 2026, pages 859-879
When Stress Biology Meets Coronary Atherosclerosis: Diurnal Cortisol Patterns and Coronary Artery Disease Burden in Patients With Diabetes and Chronic Depression
Figures
Tables
| Study element | Description |
|---|---|
| Study design | Observational, analytical study with a case-control component |
| Group I (cases) | 50 patients with type 2 diabetes mellitus and clinician-documented chronic depression |
| Group II (controls) | 50 healthy individuals as a comparative reference group |
| Total sample size | N = 100 participants |
| Variable | Definition and clinical criteria | Data source |
|---|---|---|
| BMI: body mass index; ICD: International Classification of Diseases. | ||
| Age | Participant age in years at the time of enrolment | Electronic medical records |
| Sex | Biological sex of the participant (male or female) | Electronic medical records |
| BMI | Body mass index, calculated as weight (kg)/height squared (m2) | Physical charts/vital logs |
| Diabetes mellitus | Confirmed diagnosis of type 2 diabetes mellitus | Clinical progress notes/ICD codes |
| Hypertension | Active clinician diagnosis or use of antihypertensive medication | Medical history/pharmacy records |
| Dyslipidemia | Documented abnormal lipid profile or active lipid-lowering therapy | Lab databases/pharmacy records |
| Smoking status | Documented active tobacco use at the time of study enrolment | Social history progress notes |
| Chronic depression | Verified history of a formal clinician-documented psychiatric diagnosis | Psychiatric notes/consult record |
| Variable | Cases (n = 50) | Control (n = 50) | Test | Statistic | P-value |
|---|---|---|---|---|---|
| Data are presented as median (IQR) or n (%). BMI: body mass index; DM: diabetes mellitus; HTN: hypertension; IQR: interquartile range. | |||||
| Age (years) | 62.00 (55.50–66.00) | 62.50 (58.25–66.00) | Mann–Whitney U | 1,177.5 | 0.6191 |
| BMI (kg/m2) | 30.00 (28.00–33.75) | 29.00 (27.00–31.00) | Mann–Whitney U | 1,528.5 | 0.0541 |
| Sex (male) | 33 (66.0%) | 32 (64.0%) | Chi-square | 0.000 | 1.000 |
| DM (positive) | 50 (100.0%) | 0 (0.0%) | Fisher’s exact | - | < 0.001 |
| HTN (positive) | 34 (68.0%) | 1 (2.0%) | Fisher’s exact | - | < 0.001 |
| Dyslipidemia (positive) | 28 (56.0%) | 4 (8.0%) | Fisher’s exact | - | < 0.001 |
| Smoking (positive) | 18 (36.0%) | 5 (10.0%) | Chi-square | 8.131 | 0.0044 |
| Chronic depression history (positive) | 50 (100.0%) | 0 (0.0%) | Fisher’s exact | - | < 0.001 |
| Cortisol parameter | Cases (n = 50) | Control (n = 50) | Test | Statistic | P-value |
|---|---|---|---|---|---|
| Data are presented as mean ± SD or median (IQR). AM: morning; IQR: interquartile range; PM: evening; SD: standard deviation. | |||||
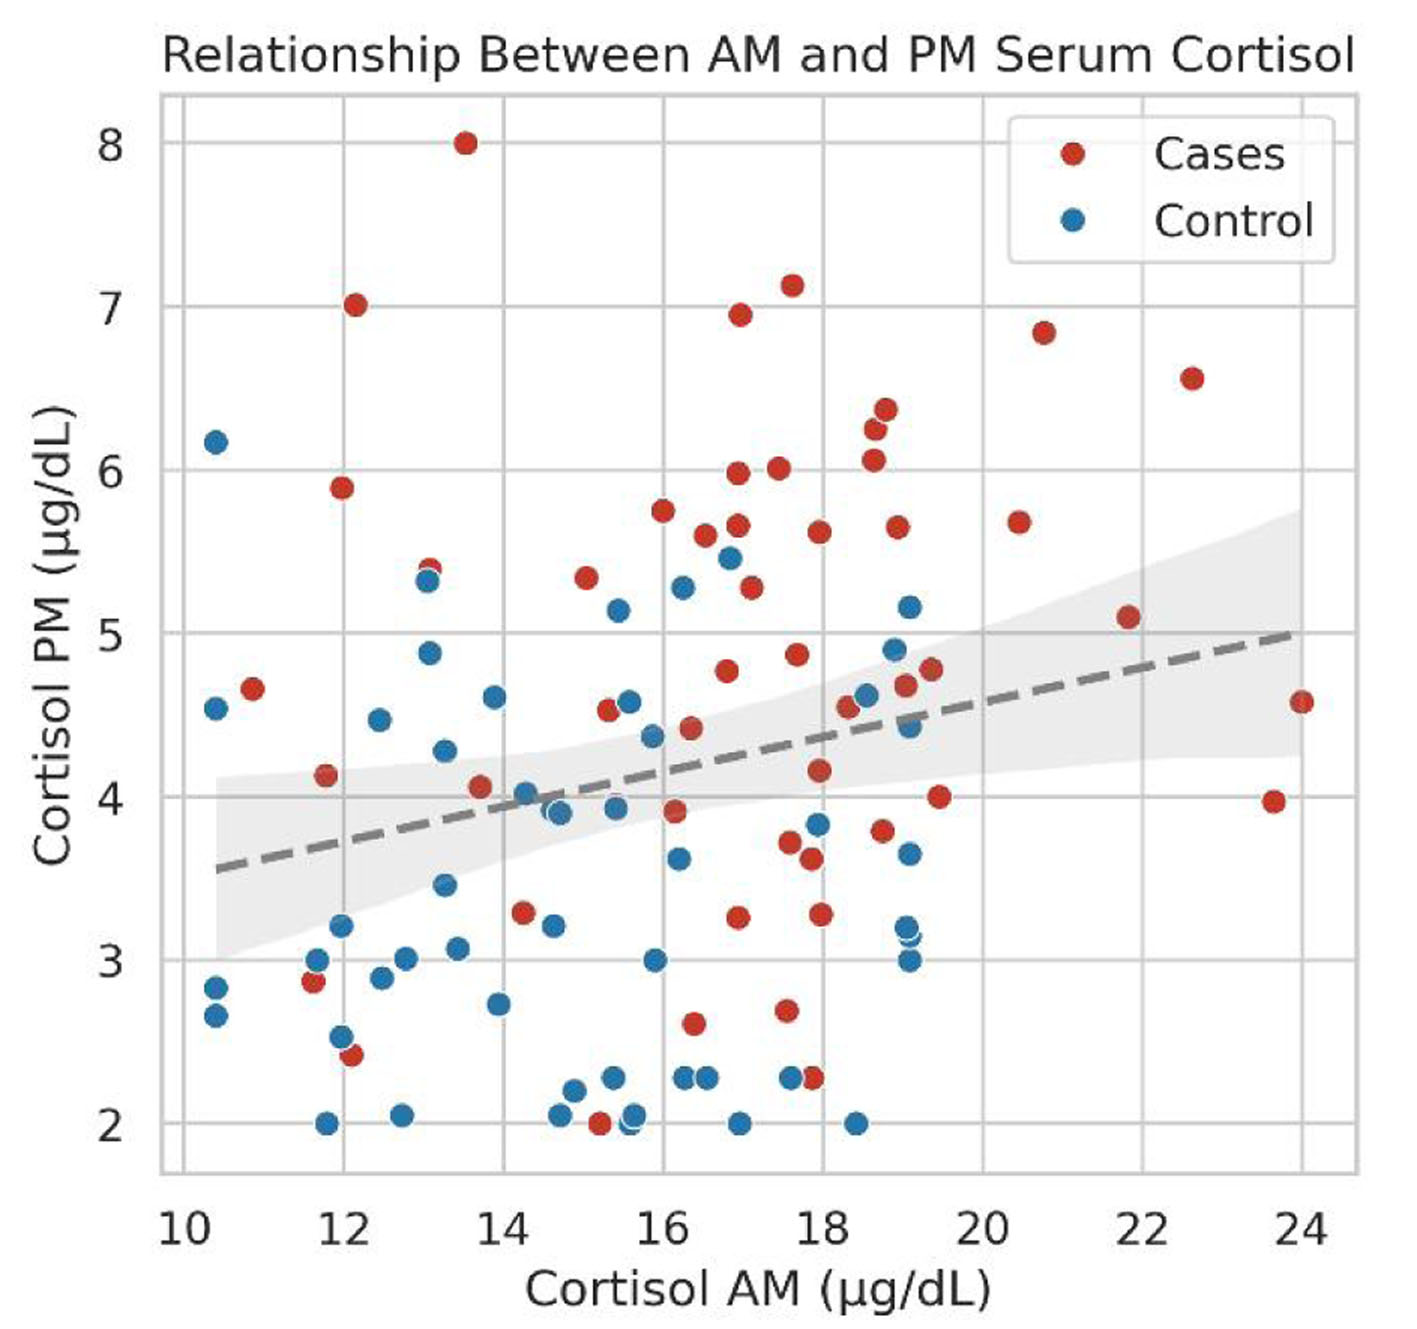
| Cortisol AM (µg/dL) | 17.00 ± 3.00 | 15.02 ± 2.63 | Independent t-test | 3.508 | 0.0007 |
| Cortisol PM (µg/dL) | 4.72 (3.92–5.73) | 3.21 (2.56–4.46) | Mann–Whitney U | 1,901.5 | < 0.001 |
| AM–PM difference (µg/dL) | 12.20 ± 3.15 | 11.51 ± 2.83 | Independent t-test | 1.152 | 0.2523 |
| AM/PM ratio | 3.56 (2.95–4.63) | 4.28 (3.64–6.03) | Mann–Whitney U | 869.0 | 0.0087 |
| Group | AM, mean (µg/dL) | PM, mean (µg/dL) | Test type | Statistic | P-value |
|---|---|---|---|---|---|
| AM: morning; PM: evening. | |||||
| Cases | 17.00 | 4.80 | Paired t-test | 27.387 | < 0.001 |
| Control | 15.02 | 3.51 | Paired t-test | 28.711 | < 0.001 |
| Overall | 16.01 | 4.15 | Paired t-test | 39.498 | < 0.001 |
| Sample | Variable X | Variable Y | Correlation coefficient (r) | P-value |
|---|---|---|---|---|
| Spearman correlation coefficients. AM: morning; BMI: body mass index; PM: evening. | ||||
| Overall (N = 100) | Age | Cortisol AM | 0.041 | 0.6860 |
| Age | Cortisol PM | −0.084 | 0.4065 | |
| Age | AM–PM difference | 0.089 | 0.3784 | |
| Age | AM/PM ratio | 0.124 | 0.2189 | |
| BMI | Cortisol AM | −0.006 | 0.9546 | |
| BMI | Cortisol PM | 0.093 | 0.3571 | |
| BMI | AM–PM difference | −0.047 | 0.6397 | |
| BMI | AM/PM ratio | −0.097 | 0.3392 | |
| Cases only (n = 50) | Age | Cortisol AM | 0.041 | 0.7762 |
| Age | Cortisol PM | −0.163 | 0.2593 | |
| Age | AM–PM difference | 0.097 | 0.5024 | |
| Age | AM/PM ratio | 0.202 | 0.1605 | |
| BMI | Cortisol AM | −0.213 | 0.1375 | |
| BMI | Cortisol PM | 0.026 | 0.8553 | |
| BMI | AM–PM difference | −0.255 | 0.0745 | |
| BMI | AM/PM ratio | −0.150 | 0.2976 | |
| Control only (n = 50) | Age | Cortisol AM | 0.078 | 0.5917 |
| Age | Cortisol PM | 0.011 | 0.9398 | |
| Age | AM–PM difference | 0.073 | 0.6127 | |
| Age | AM/PM ratio | 0.053 | 0.7163 | |
| BMI | Cortisol AM | 0.158 | 0.2725 | |
| BMI | Cortisol PM | −0.079 | 0.5863 | |
| BMI | AM–PM difference | 0.198 | 0.1671 | |
| BMI | AM/PM ratio | 0.130 | 0.3670 | |
| Cortisol parameter | Multivessel CAD positive (n = 37) | Multivessel CAD negative (n = 13) | Test type | Statistic | P-value |
|---|---|---|---|---|---|
| Data are presented as mean ± SD or median (IQR). AM: morning; CAD: coronary artery disease; IQR: interquartile range; PM: evening; SD: standard deviation. | |||||
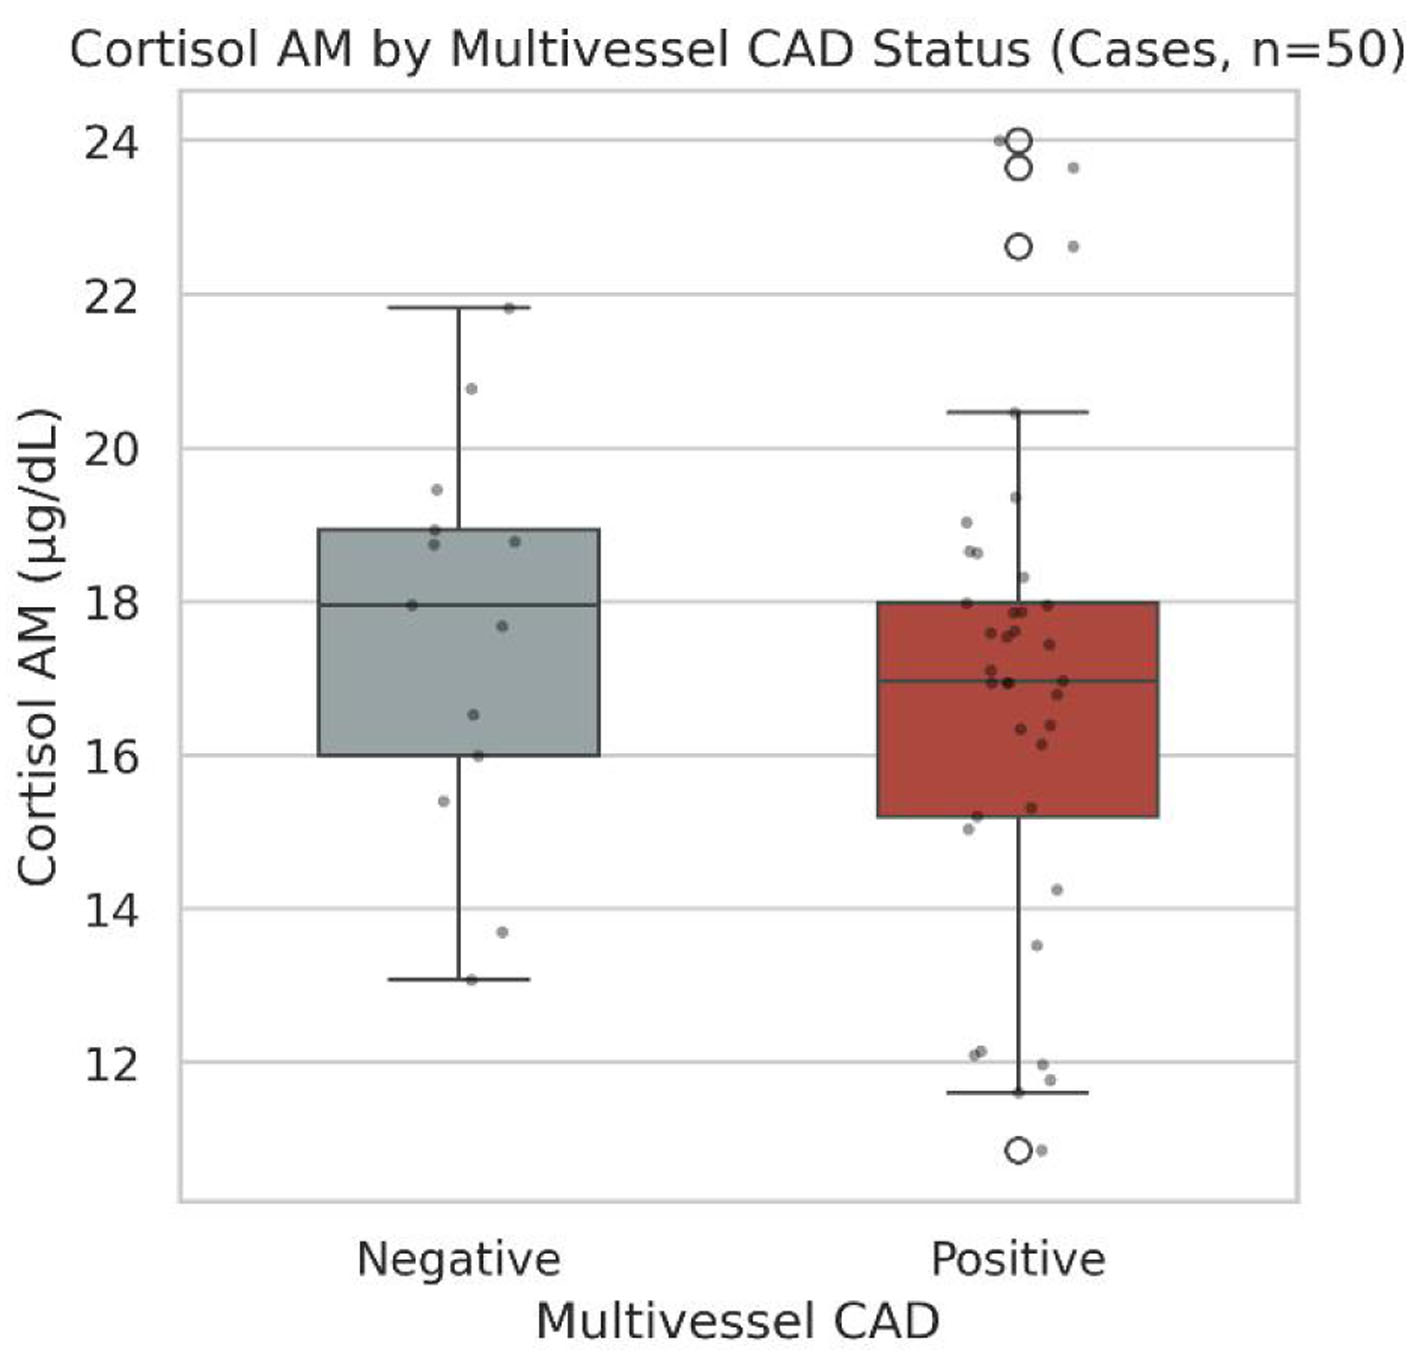
| Cortisol AM (µg/dL) | 16.79 ± 3.14 | 17.61 ± 2.58 | Independent t-test | −0.848 | 0.40 |
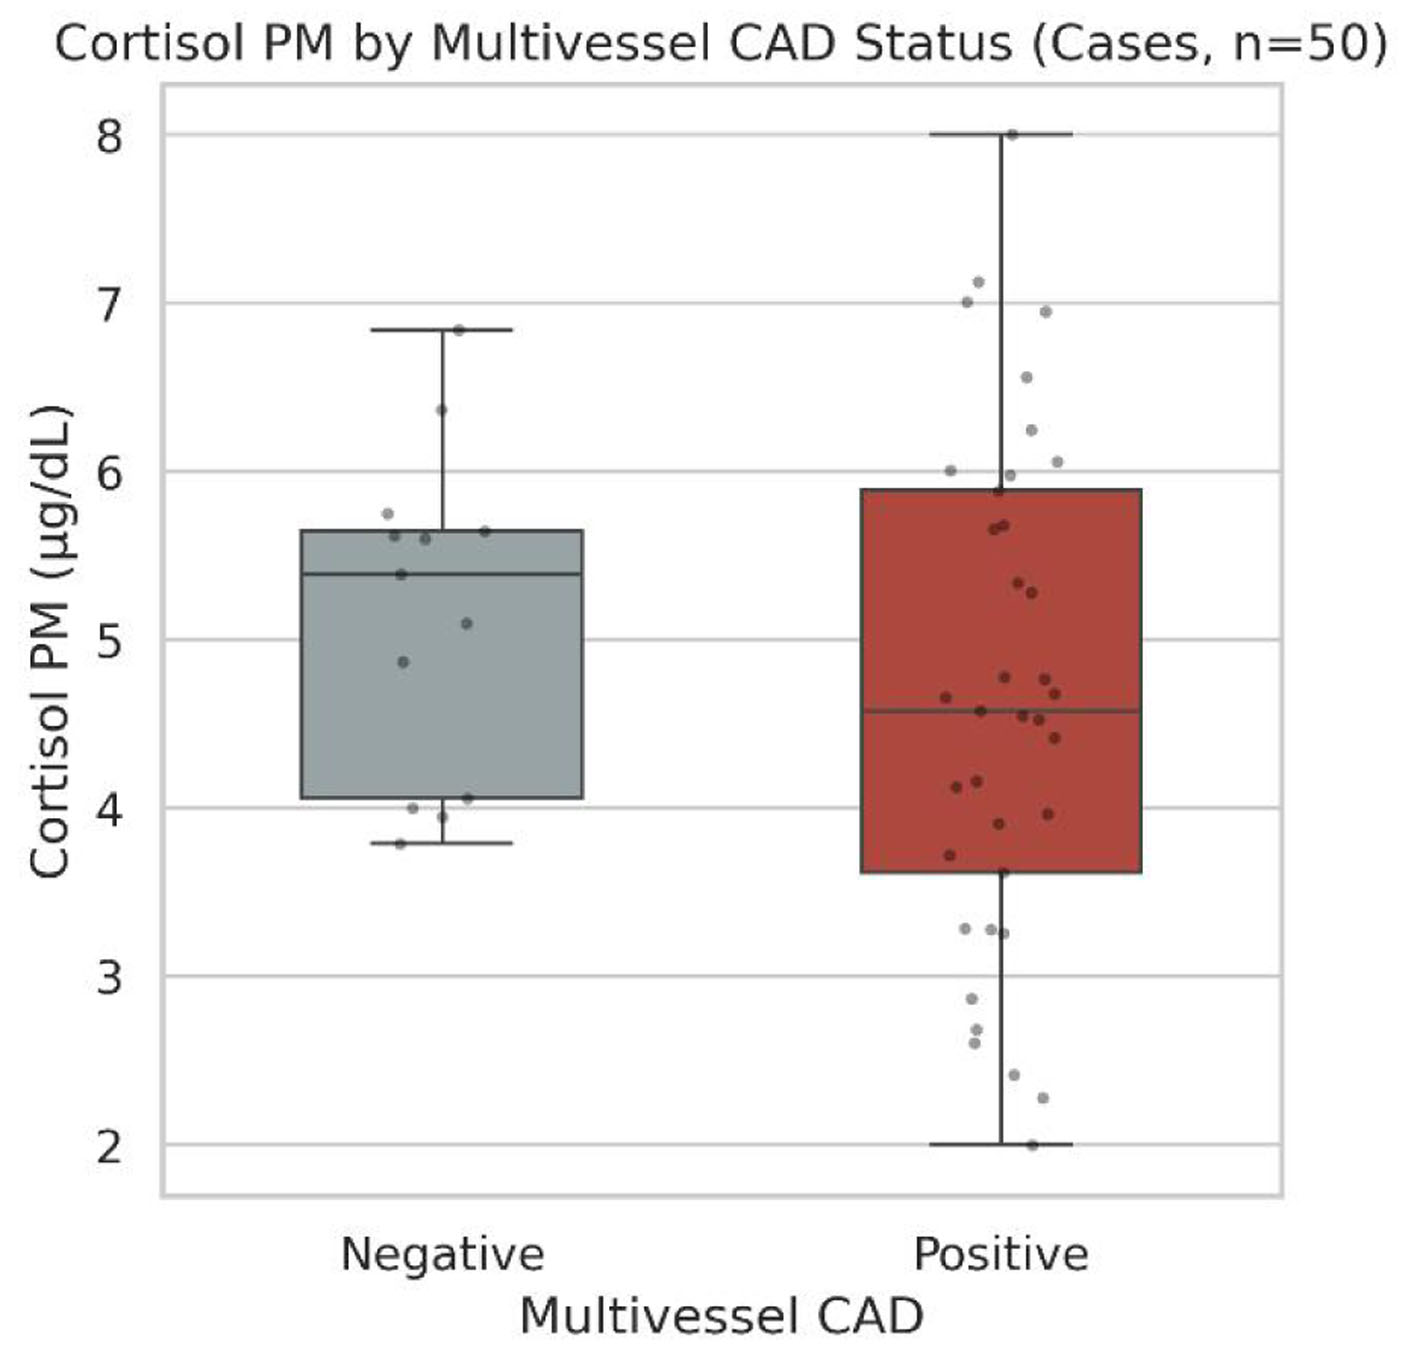
| Cortisol PM (µg/dL) | 4.68 ± 1.51 | 5.15 ± 0.97 | Independent t-test | −1.060 | 0.29 |
| AM–PM difference (µg/dL) | 12.11 ± 3.37 | 12.46 ± 2.51 | Independent t-test | −0.336 | 0.74 |
| AM/PM ratio | 3.70 (2.90–4.93) | 3.35 (2.95–3.90) | Mann–Whitney U | 282.0 | 0.36 |
| Cortisol parameter | Obstructive CAD positive (n = 19) | Obstructive CAD negative (n = 31) | Test type | Statistic | P-value |
|---|---|---|---|---|---|
| Data are presented as mean ± SD or median (IQR). AM: morning; CAD: coronary artery disease; IQR: interquartile range; PM: evening; SD: standard deviation. | |||||
| Cortisol AM (µg/dL) | 17.21 ± 2.55 | 16.87 ± 3.28 | Independent t-test | 0.391 | 0.6978 |
| Cortisol PM (µg/dL) | 4.64 ± 1.34 | 4.90 ± 1.45 | Independent t-test | −0.641 | 0.5246 |
| AM–PM difference (µg/dL) | 12.58 ± 2.35 | 11.97 ± 3.57 | Independent t-test | 0.658 | 0.5136 |
| AM/PM ratio | 4.03 (2.99–4.30) | 3.45 (2.89–4.90) | Mann–Whitney U | 324.0 | 0.5622 |
| Model and predictor | OR/aOR | 95% CI | P-value |
|---|---|---|---|
| Exploratory analysis: with 13 multivessel-CAD-negative cases for eight covariates, the events-per-variable ratio is < 2; estimates are imprecise and may be overfit. AM: morning; aOR: adjusted odds ratio; BMI: body mass index; CAD: coronary artery disease; CI: confidence interval; OR: odds ratio; PM: evening. | |||
| Univariate models | |||
| Cortisol AM (µg/dL) | 0.910 | 0.732–1.131 | 0.394 |
| Cortisol PM (µg/dL) | 0.776 | 0.484–1.242 | 0.290 |
| AM–PM difference (µg/dL) | 0.965 | 0.787–1.184 | 0.732 |
| AM/PM ratio | 1.342 | 0.786–2.289 | 0.281 |
| Multivariate model (adjusted) | |||
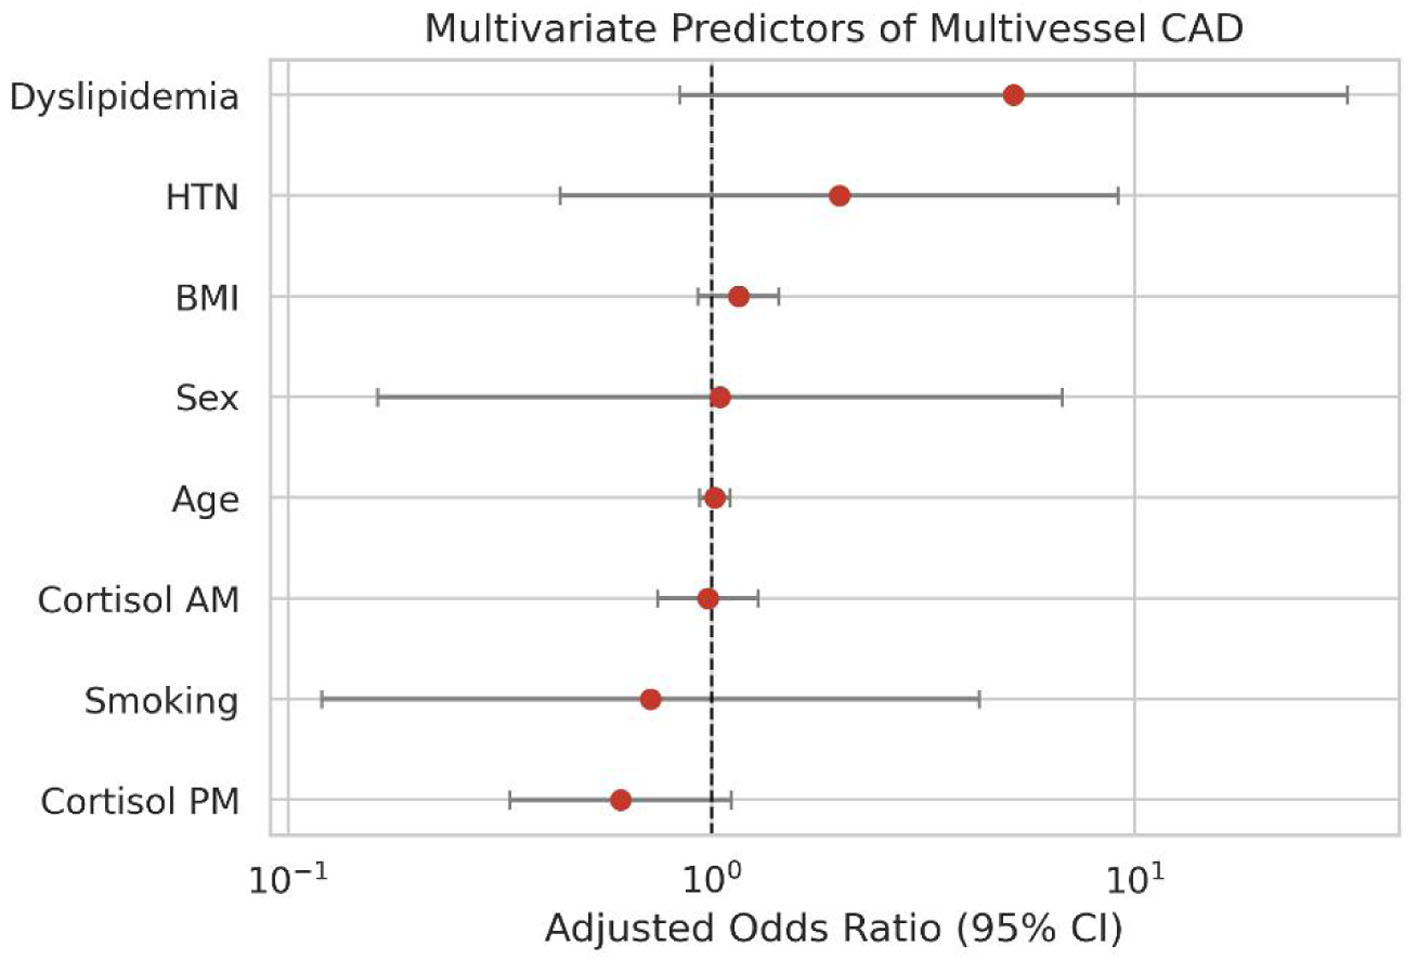
| Cortisol AM (µg/dL) | 0.981 | 0.747–1.289 | 0.892 |
| Cortisol PM (µg/dL) | 0.610 | 0.334–1.113 | 0.107 |
| Age (years) | 1.018 | 0.937–1.107 | 0.669 |
| Sex (male) | 1.047 | 0.163–6.742 | 0.961 |
| BMI (kg/m2) | 1.158 | 0.930–1.443 | 0.190 |
| Hypertension (positive) | 2.004 | 0.439–9.137 | 0.369 |
| Dyslipidemia (positive) | 5.180 | 0.843–31.815 | 0.076 |
| Smoking (positive) | 0.719 | 0.120–4.289 | 0.717 |
| Model and predictor | OR/aOR | 95% CI | P-value |
|---|---|---|---|
| Exploratory analysis: with 19 obstructive CAD events for eight covariates, the events-per-variable ratio is < 3; estimates are imprecise and may be overfit. AM: morning; aOR: adjusted odds ratio; BMI: body mass index; CI: confidence interval; OR: odds ratio; PM: evening. | |||
| Univariate models | |||
| Cortisol AM (µg/dL) | 1.040 | 0.857–1.262 | 0.6911 |
| Cortisol PM (µg/dL) | 0.871 | 0.574–1.321 | 0.5162 |
| AM–PM difference (µg/dL) | 1.065 | 0.884–1.284 | 0.5058 |
| AM/PM ratio | 1.104 | 0.727–1.675 | 0.6433 |
| Multivariate model (adjusted) | |||
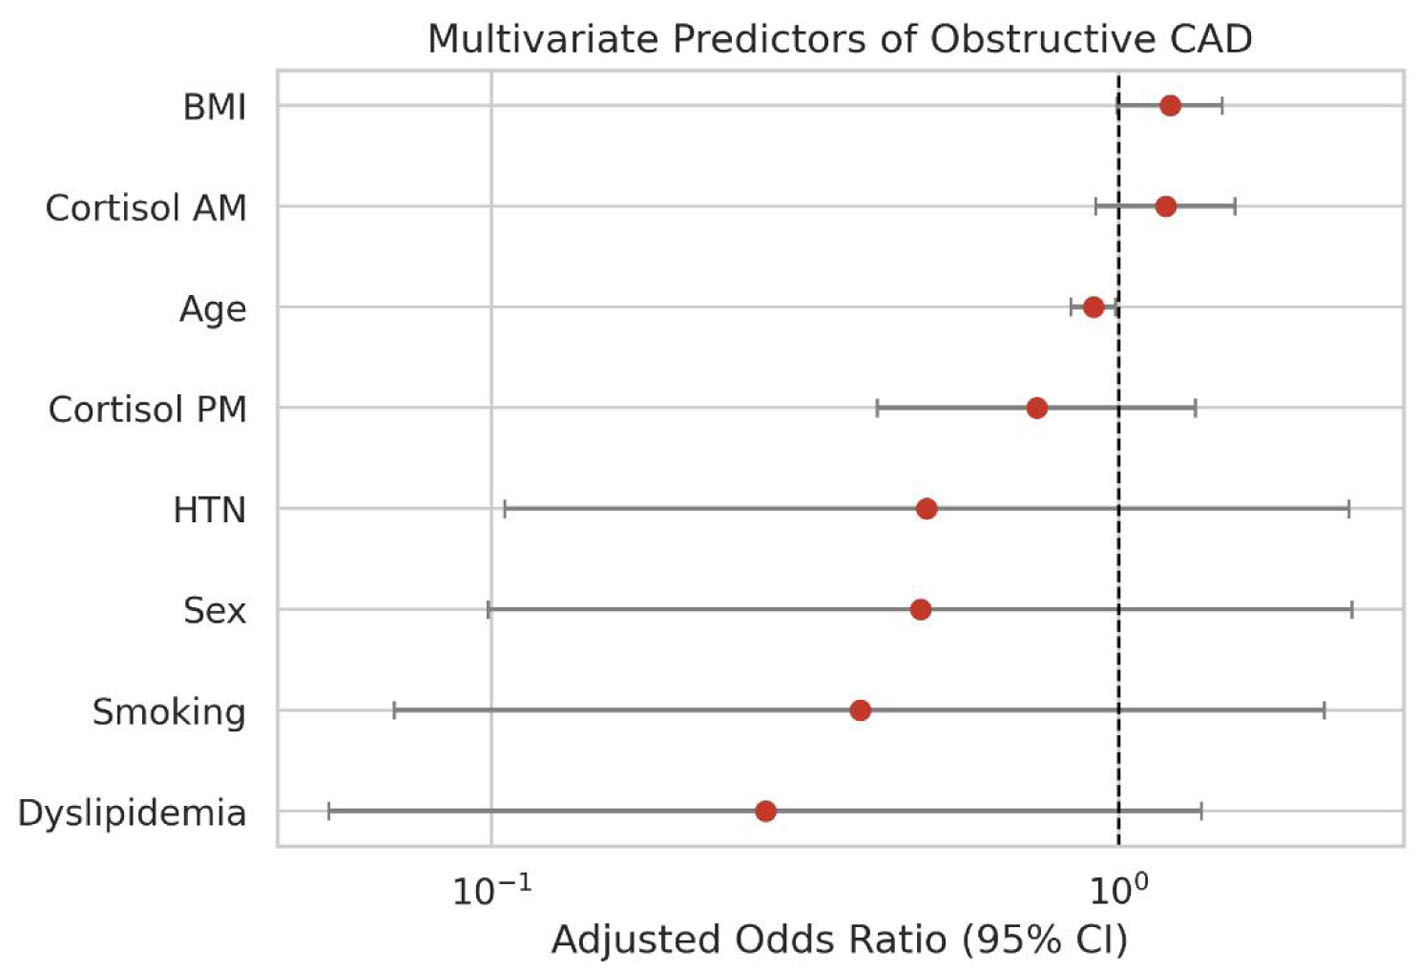
| Cortisol AM (µg/dL) | 1.188 | 0.920–1.533 | 0.1872 |
| Cortisol PM (µg/dL) | 0.740 | 0.413–1.327 | 0.3123 |
| Age (years) | 0.912 | 0.840–0.991 | 0.0300 |
| Sex (male) | 0.484 | 0.099–2.360 | 0.3695 |
| BMI (kg/m2) | 1.208 | 0.995–1.466 | 0.0557 |
| Hypertension (positive) | 0.494 | 0.105–2.331 | 0.3728 |
| Dyslipidemia (positive) | 0.274 | 0.055–1.358 | 0.1128 |
| Smoking (positive) | 0.387 | 0.070–2.128 | 0.2749 |
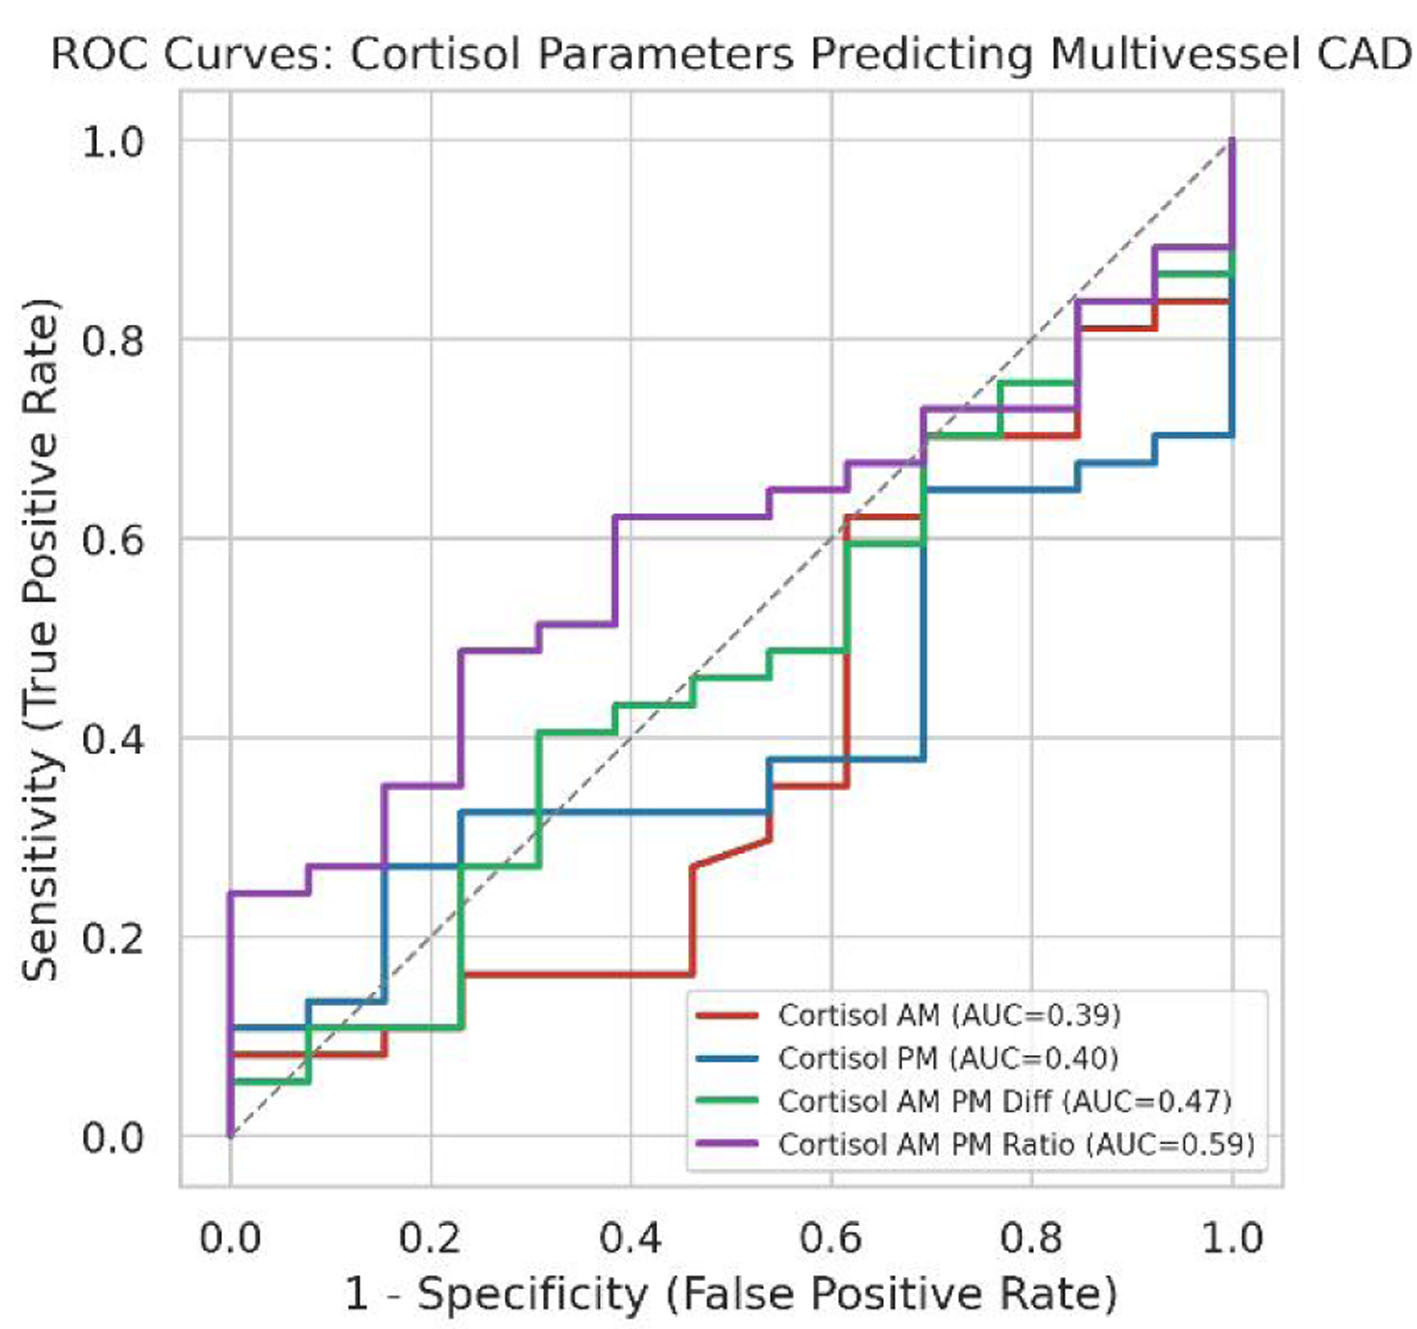
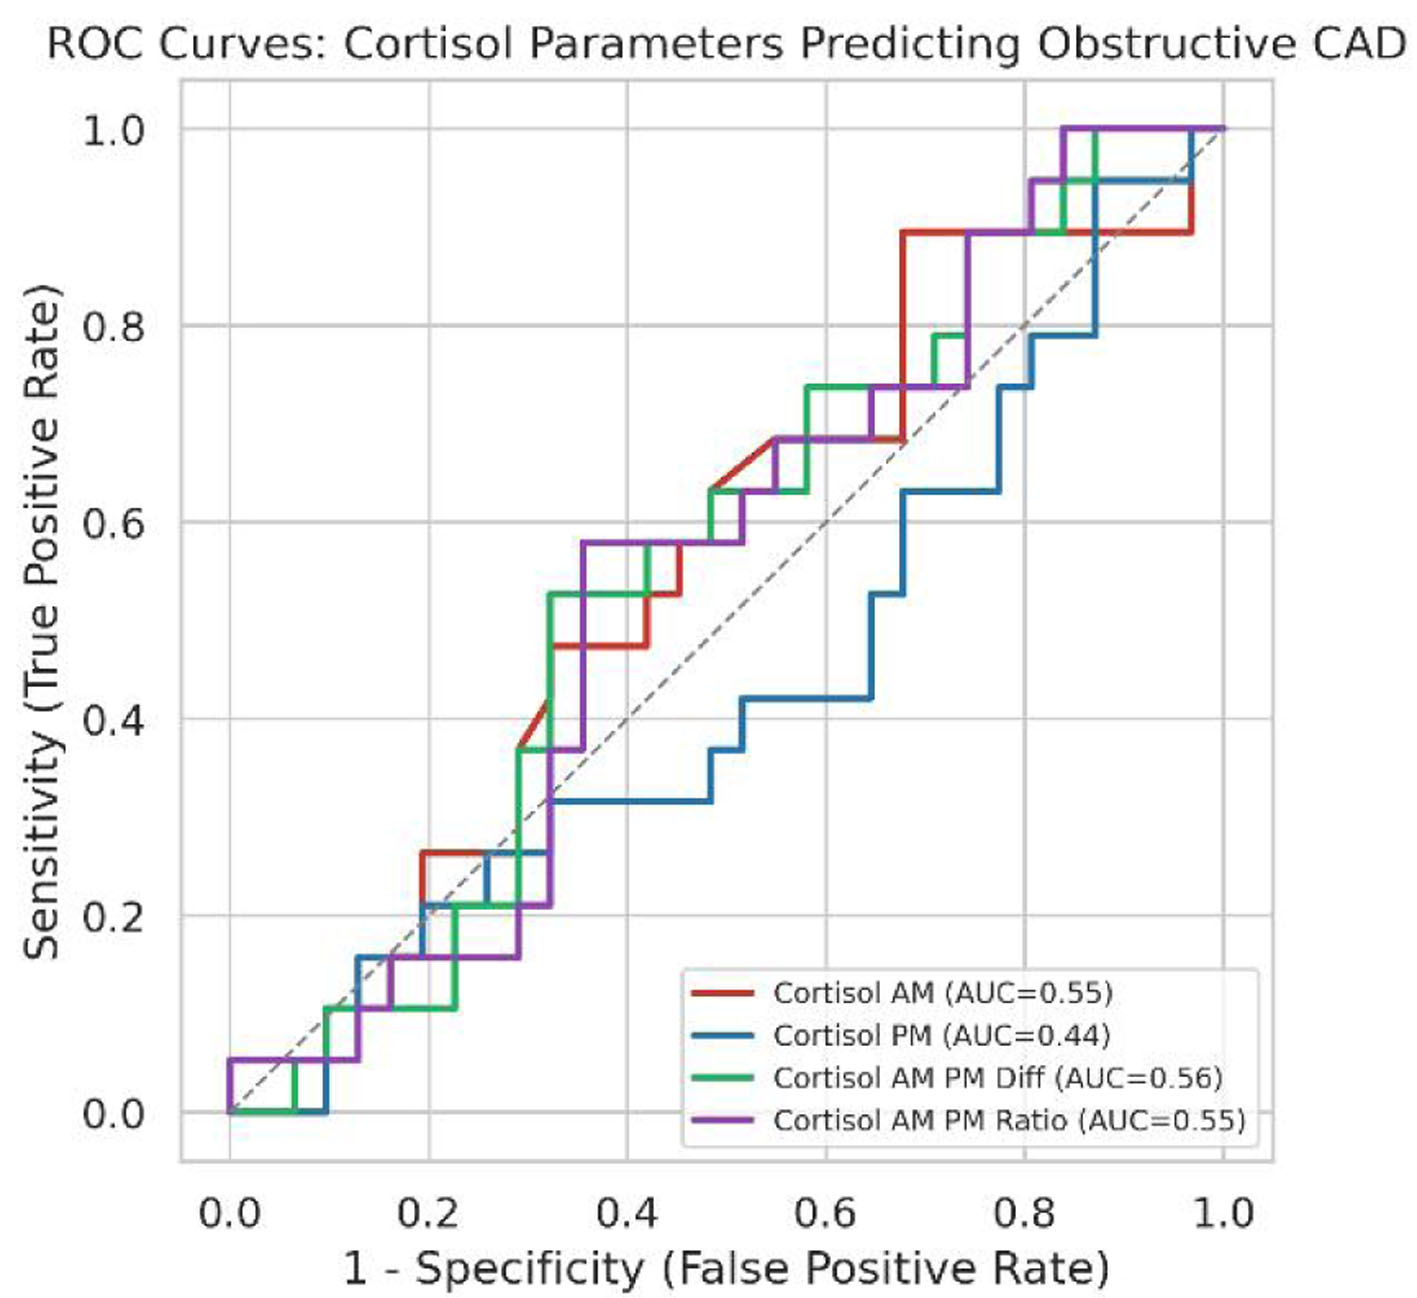
| Coronary endpoint and predictor | AUC | 95% CI | Exploratory Youden-derived threshold | Sensitivity (95% CI) | Specificity (95% CI) |
|---|---|---|---|---|---|
| Thresholds are exploratory and derived within this sample only. 95% CIs for sensitivity and specificity were calculated with the Wilson score method. Given the small number of events (37 vs. 13 for multivessel CAD; 19 vs. 31 for obstructive CAD), all estimates are exploratory. AM: morning; AUC: area under the receiver operating characteristic curve; CI: confidence interval (2,000 bootstrap resamples); CAD: coronary artery disease; PM: evening. | |||||
| Multivessel CAD | |||||
| Cortisol AM (µg/dL) | 0.390 | 0.215–0.585 | 22.63 | 8.1% (2.8–21.3) | 100.0% (77.2–100.0) |
| Cortisol PM (µg/dL) | 0.403 | 0.237–0.574 | 5.89 | 27.0% (15.4–43.0) | 84.6% (57.8–95.7) |
| AM–PM difference (µg/dL) | 0.468 | 0.296–0.656 | 13.68 | 40.5% (26.3–56.5) | 69.2% (42.4–87.3) |
| AM/PM ratio | 0.586 | 0.427–0.743 | 4.03 | 48.6% (33.4–64.1) | 76.9% (49.7–91.8) |
| Obstructive CAD | |||||
| Cortisol AM (µg/dL) | 0.554 | 0.390–0.723 | 15.32 | 89.5% (68.6–97.1) | 32.3% (18.6–49.9) |
| Cortisol PM (µg/dL) | 0.438 | 0.276–0.609 | 2.87 | 94.7% (75.4–99.1) | 12.9% (5.1–28.9) |
| AM–PM difference (µg/dL) | 0.557 | 0.389–0.715 | 13.29 | 52.6% (31.7–72.7) | 67.7% (50.1–81.4) |
| AM/PM ratio | 0.550 | 0.385–0.704 | 3.90 | 57.9% (36.3–76.9) | 64.5% (46.9–78.9) |