| Journal of Clinical Medicine Research, ISSN 1918-3003 print, 1918-3011 online, Open Access |
| Article copyright, the authors; Journal compilation copyright, J Clin Med Res and Elmer Press Inc |
| Journal website https://jocmr.elmerjournals.com |
Original Article
Volume 17, Number 6, June 2025, pages 320-333

The Long-Term Effects of the Selective Inhibitor of Urate Transporter 1, Dotinurad, on Metabolic Parameters and Renal Function in Japanese Patients With Asymptomatic Hyperuricemia
Hidekatsu Yanaia, b, Hiroki Adachia, Mariko Hakoshimaa, Hisayuki Katsuyamaa
aDepartment of Diabetes, Endocrinology and Metabolism, National Kohnodai Medical
Center, Japan Institute for Health Security, Chiba, Japan
bCorresponding Author:
Hidekatsu Yanai, Department of Diabetes, Endocrinology and Metabolism, National Kohnodai Medical
Center, Japan Institute for Health Security, Chiba 272-8516, Japan
Manuscript submitted March 27, 2025, accepted May 24, 2025, published online June 9,
2025
Short title: Dotinurad in Asymptomatic Hyperuricemia
doi:
https://doi.org/10.14740/jocmr6250
| Abstract | ▴Top |
Background: Epidemiological studies have reported that hyperuricemia is associated with the development of metabolic syndrome, hypertension, dyslipidemia, type 2 diabetes, and chronic kidney disease (CKD). Renal uric acid (UA) reabsorption is mainly mediated by urate transporter 1 (URAT1) in renal proximal tubule epithelial cells. Recently, URAT1 was found to be expressed in the liver and adipose tissue in addition to the kidney. UA enters such organs via URAT1 and induces inflammation and oxidative stress, which may lead to metabolic disorders. We investigated the effects of long-term treatment with the novel uricosuric drug, a highly selective inhibitor of URAT1, dotinurad, on metabolic parameters and renal function.
Methods: We retrospectively picked up patients who had taken dotinurad for the treatment of asymptomatic hyperuricemia for more than 2 years. We compared metabolic parameters and renal function at baseline with the data at 6, 12, 18, and 24 months after starting dotinurad.
Results: Pharmacologically, dotinurad decreases serum UA, by selectively inhibiting URAT1 and decreasing renal reabsorption of UA, which was supported by our result that dotinurad significantly increased urine UA and reduced serum UA. In addition to UA-lowering, dotinurad was associated with improvements in body weight, liver function, hepatic steatosis index as the marker for metabolic dysfunction-associated steatotic liver disease (MASLD), serum lipids, and albuminuria. The ATP-binding cassette transporter G2 (ABCG2) regulates renal and intestinal excretion of UA and uremic toxins and strongly affects renal function. Our study also indicates that switching from xanthine oxidase inhibitors, which inhibit ABCG2, to dotinurad, which does not inhibit ABCG2, was beneficial for albuminuria and maintaining the estimated glomerular filtration rate.
Conclusion: Dotinurad may improve obesity, MASLD, serum lipids, and CKD by blocking the entry of UA via URAT1 to the adipose tissue, liver, and kidney.
Keywords: ATP-binding cassette transporter G2; Chronic kidney disease; Dotinurad; Hyperuricemia; Urate transporter 1
| Introduction | ▴Top |
Uric acid (UA) is synthesized mainly in the liver, intestines, and vascular endothelium as the end product of an exogenous purine from food, and endogenously from damaged, dying, and dead cells, whereby nucleic acids, adenine, and guanine are degraded into UA [1]. Such nucleotides are metabolized to xanthine, which is finally converted to UA by the action of xanthine oxidase (XO), the rate-limiting enzyme for UA production.
Renal excretion of UA is the major regulator of serum UA concentration [2]. Renal UA reabsorption is mainly mediated by urate transporter 1 (URAT1) and glucose transporter 9 (GLUT9) in renal proximal tubule epithelial cells [3-6]. The ATP-binding cassette, subfamily G, 2 (ABCG2), has been identified as a high-capacity UA exporter that mediates renal and/or extra-renal (intestinal) UA excretion [7]. When UA production exceeds UA excretion, hyperuricemia, which has been defined as serum UA concentration > 7.0 mg/dL [8], occurs.
The meta-analysis suggested that higher serum UA levels led to an increased risk of metabolic syndrome with a linear dose-response relationship [9]. This study also suggested that each 1 mg/dL serum UA level increment led to 21% increase in the metabolic dysfunction-associated steatotic liver disease (MASLD) risk (relative risk (RR), 1.21; 95% confidence interval (CI), 1.03 - 1.41). Epidemiological studies have suggested that hyperuricemia is associated with the development of hypertension, dyslipidemia, type 2 diabetes, chronic kidney disease (CKD), and cardiovascular disease (CVD), in addition to metabolic syndrome and insulin resistance [10-14]. A recent study suggested that such cardiometabolic diseases are induced by various pro-inflammatory, pro-oxidative, and vasoconstrictive actions of UA [14].
Recently, URAT1 was found to be expressed in the liver and adipose tissue in addition to the kidney [15]. The selective inhibitor of URAT1, dotinurad, significantly ameliorated high-fat diet (HFD)-induced obesity, insulin resistance, and MASLD in mice [15]. This study suggested that UA enters the liver and adipose tissue via URAT1, where UA causes inflammation and oxidative stress, resulting in metabolic disorders. However, the effects of dotinurad on human metabolic parameters remain largely unknown. URAT1 mediates UA reabsorption in renal tubules, but the effect of its inhibition on long-term renal function remains unclear. Here, we investigated the effects of long-term treatment with dotinurad on metabolic parameters and renal function in Japanese patients with asymptomatic hyperuricemia.
| Materials and Methods | ▴Top |
Study design and ethics
The study protocol was approved by the Ethics Committee of the National Center for Global Health and Medicine (NCGM-S-004957-00) on December 6, 2024, and this study was performed in accordance with the Declaration of Helsinki.
Study population
We retrospectively reviewed medical records of patients treated with dotinurad for asymptomatic hyperuricemia who had completed more than 2 years of follow-up. These patients had regularly attended the Department of General Internal Medicine or the Department of Diabetes, Endocrinology and Metabolism, National Center for Global Health and Medicine, Kohnodai Hospital, Japan. Patients without serum UA measurements more than three times, and patients undergoing dialysis and those with malignancy were excluded. We collected demographic data (age, gender, body weight, and body mass index (BMI)) and clinical parameters (blood pressure (BP), comorbidities, and laboratory values) from electronic medical records at baseline and at 6, 12, 18, and 24 months after initiating dotinurad. Informed consent was obtained via the opt-out approach. Hyperuricemia, type 2 diabetes, hypertension, dyslipidemia, and chronic kidney disease (CKD) were diagnosed based on the criteria of the respective Japanese medical societies. Diagnoses were established either through the use of relevant medications or the following clinical thresholds: serum UA ≥ 7.0 mg/dL (Japanese Society of Gout and Uric and Nucleic Acids); hemoglobin A1c (HbA1c) > 6.5% (Japan Diabetes Society); systolic blood pressure (BP) ≥ 140 mm Hg or diastolic BP ≥ 90 mm Hg (Japanese Society of Hypertension); low-density lipoprotein-cholesterol (LDL-C) ≥ 140 mg/dL, triglyceride (TG) ≥ 150 mg/dL, high-density lipoprotein-cholesterol (HDL-C) < 40 mg/dL (Japan Atherosclerosis Society); estimated glomerular filtration rate (eGFR) < 60 mL/min/1.73 m2 or urine albumin/creatinine ratio (UACR) ≥ 30 (Japanese Society of Nephrology).
Laboratory measurements
Anthropometric and BP measurements
Body weight, height, and BP were measured according to the clinical guidelines set by the World Health Organization and the Japanese Society of Hypertension, respectively.
Blood and urine biochemical tests
The measurements of HbA1c, total cholesterol (TC), and TG were performed using enzymatic assays. A direct method was used to measure serum LDL-C and HDL-C. Serum and urine UA were measured using the uricase-peroxidase method. Serum aspartate aminotransferase (AST), alanine aminotransferase (ALT), and gamma-glutamyl transferase (GGT) were measured by using the Japan Society of Clinical Chemistry transferable method. Urinary albumin levels were measured with the turbidimetric immunoassay.
Calculated indices
BMI was calculated by dividing the body weight in kilograms by the body height squared in meters. The eGFR was calculated based on their age and serum creatinine, measured using the enzymatic assay based on the estimation equation for Japanese patients [16]. Since eGFR varies widely between patients, eGFR slope was evaluated by setting the baseline data of each patient as 100% and evaluating the change in eGFR as percent changes at each observation period. Urine albumin and UA were assessed by using spot urine because not all patients in the Outpatient Clinic had 24-h urine sampling performed on retrospective analysis. Urine albumin excretion was evaluated by dividing by urine creatinine, such as UACR. We divided the urine UA concentration by the urine creatinine concentration. Non-HDL-C was calculated by subtracting HDL-C from TC. To evaluate the severity of MASLD, we used the hepatic steatosis index as the marker for hepatic steatosis, and this index was calculated by using the following formula: 8 × (ALT/AST) + BMI + (2, if diabetes mellitus) + (2, if female) [17].
Statistical analysis
We evaluated our data using the Shapiro-Wilk test to verify their normality. The data did not show normality, so we used non-parametric tests. Comparisons between the baseline data and those after starting dotinurad were analyzed using the Wilcoxon signed-rank test. The Kruskal-Wallis test was used to test whether there were differences in mean values among the three doses (0.5, 1.0, and 2.0 mg) of dotinurad groups. For factors for which the Kruskal-Wallis test showed significant differences, to test differences between any two groups, we used the Dunn’s test. We used the Spearman rank correlation coefficient, a non-parametric correlation measure, to determine the correlations between the parameters. All data were expressed as the mean ± standard deviation (SD), and P < 0.05 was considered statistically significant. We used SPSS version 29 (IBM Corp, Armonk, NY, USA) for statistical analysis.
Data management and curation
This study is a retrospective observational study, and our data included missing data as follows: body weight, 25/355 (7.0%); systolic and diastolic BP, 17/355 (5.0%); serum UA, 3/355 (0.8%); urine UA, 85/355 (24.0%), HbA1c, 21/355 (6.0%); AST and ALT, 3/355 (0.8%); GGT, 14/355 (4.0%); TG and HDL-C, 4/355 (1.1%); LDL-C, 28/355 (7.9%); non-HDL-C, 47/355 (13.2%); eGFR, 3/355 (0.8%); UACR, 130/355 (36.6%). Urine UA measurement is not routinely performed in Japan and was only recently introduced at our institution, which accounts for the relatively high proportion of missing values for this parameter. Additionally, under the Japanese Health Insurance System, UACR measurement is typically restricted to patients diagnosed with diabetic nephropathy. Since our cohort included a considerable number of patients without this diagnosis, this contributed to a substantial rate of missing UACR data. Considering the influence of such missing data, we performed statistical analysis using paired non-parametric analysis. Therefore, only patients with data at baseline and each time point were subject to analysis, and the number of eligible patients at each time point is shown in Tables.
| Results | ▴Top |
Characteristics of patients studied
During the observation period, 73 patients had taken dotinurad for 2 years. The clinical and laboratory characteristics of the patients studied are shown in Table 1. The mean BMI was 28.3 kg/m2, and more than 60% of patients had a BMI of 25 or more. Over 60% of patients had type 2 diabetes and dyslipidemia, and over half of patients had hypertension. Over 70% of patients had CKD. Despite the diagnosis of hyperuricemia, baseline serum UA levels were within the reference range in many patients, likely reflecting the ongoing use of UA-lowering therapy prior to the initiation of dotinurad. The mean values of AST and ALT were within the normal range. The mean value of GGT was close to the upper limit of the normal range in males and was above the normal range in females. The mean values of TG and HbA1c were above the upper limit of the normal range. The mean value of eGFR was within the normal range. Drugs used for hyperuricemia prior to the initiation of dotinurad, and drugs for type 2 diabetes, hypertension, dyslipidemia, and daily doses of dotinurad at 24 months are shown in Table 2.
 Click to view |
Table 1. Clinical and Laboratory
Characteristics of Patients Studied at Baseline (n = 73) |
Click to view |
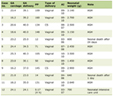
Table 2. Drugs Used for Hyperuricemia Prior to
the Initiation of Dotinurad, and Drugs for Type 2 Diabetes, Hypertension,
Dyslipidemia, and Daily Doses of Dotinurad at 24 Months |
The daily doses of dotinurad used in patients studied
Twenty-three patients (31.5%), 28 patients (38.4%), 20 patients (27.4%), and two patients (2.7%) were treated with daily doses of 0.5, 1.0, 2.0, and 4.0 mg of dotinurad, respectively (Table 2). The 4 mg group (n = 2) is too small, and two patients treated with daily 4 mg of dotinurad were excluded from the statistical analyses.
UA-lowering drugs taken by the studied patients before starting dotinurad
Thirty-eight patients had no prior treatment for hyperuricemia before starting dotinurad. All patients whose hyperuricemia was already treated had taken oral XO inhibitors before switching to dotinurad. Twenty-six patients, three patients, and six patients had taken febuxostat, topiroxostat, and allopurinol before starting dotinurad, respectively (Table 2).
Changes in metabolic parameters and renal function at 6, 12, 18, and 24 months after starting dotinurad in all patients
The changes in metabolic parameters at 6, 12, 18, and 24 months after starting dotinurad in all patients are shown in Table 3. Body weight significantly decreased at 24 months after starting dotinurad. Dotinurad significantly decreased serum UA levels and increased urine UA levels at 6, 12, 18, and 24 months. Dotinurad significantly reduced serum ALT after 12 months, serum TG after 24 months, and serum GGT and non-HDL-C after 12, 18, and 24 months. eGFR significantly decreased after 12, 18, and 24 months. UACR was significantly reduced at 6 and 24 months after starting dotinurad.
Click to view |
Table 3. Changes in Metabolic Parameters at 6,
12, 18, and 24 Months After Starting Dotinurad in All Patients |
Changes in metabolic parameters at 6, 12, 18, and 24 months after starting dotinurad in patients naive to UA-lowering drugs
Changes in metabolic parameters at 6, 12, 18, and 24 months after starting dotinurad in patients naive to UA-lowering drugs are shown in Table 4. Dotinurad significantly decreased serum UA levels at 6, 12, 18, and 24 months. Dotinurad significantly reduced serum LDL-C at 12 months and non-HDL-C after 12 and 18 months. eGFR significantly decreased after 24 months. UACR was significantly reduced at 24 months after starting dotinurad.
Click to view |
Table 4. Changes in Metabolic Parameters at 6,
12, 18, and 24 Months After Starting Dotinurad in Patients Naive to UA-Lowering
Drugs |
Changes in metabolic parameters at 6, 12, 18, and 24 months after starting dotinurad in patients who switched from XO inhibitors
Changes in metabolic parameters at 6, 12, 18, and 24 months after starting dotinurad in patients who switched from XO inhibitors are shown in Table 5. Although dotinurad did not change serum UA levels, urine UA significantly increased at 6, 12, 18, and 24 months. After 12 months, HbA1c showed a small but statistically significant increase. Dotinurad significantly reduced serum GGT after 12 and 24 months, serum TG and non-HDL-C after 24 months. eGFR significantly decreased after 18 months. UACR was significantly reduced at 6 months after starting dotinurad.
Click to view |
Table 5. Changes in Metabolic Parameters at 6,
12, 18, and 24 Months After Starting Dotinurad in Patients Who Switched From XO
Inhibitors |
The analysis for the reduction in serum UA according to the doses of dotinurad
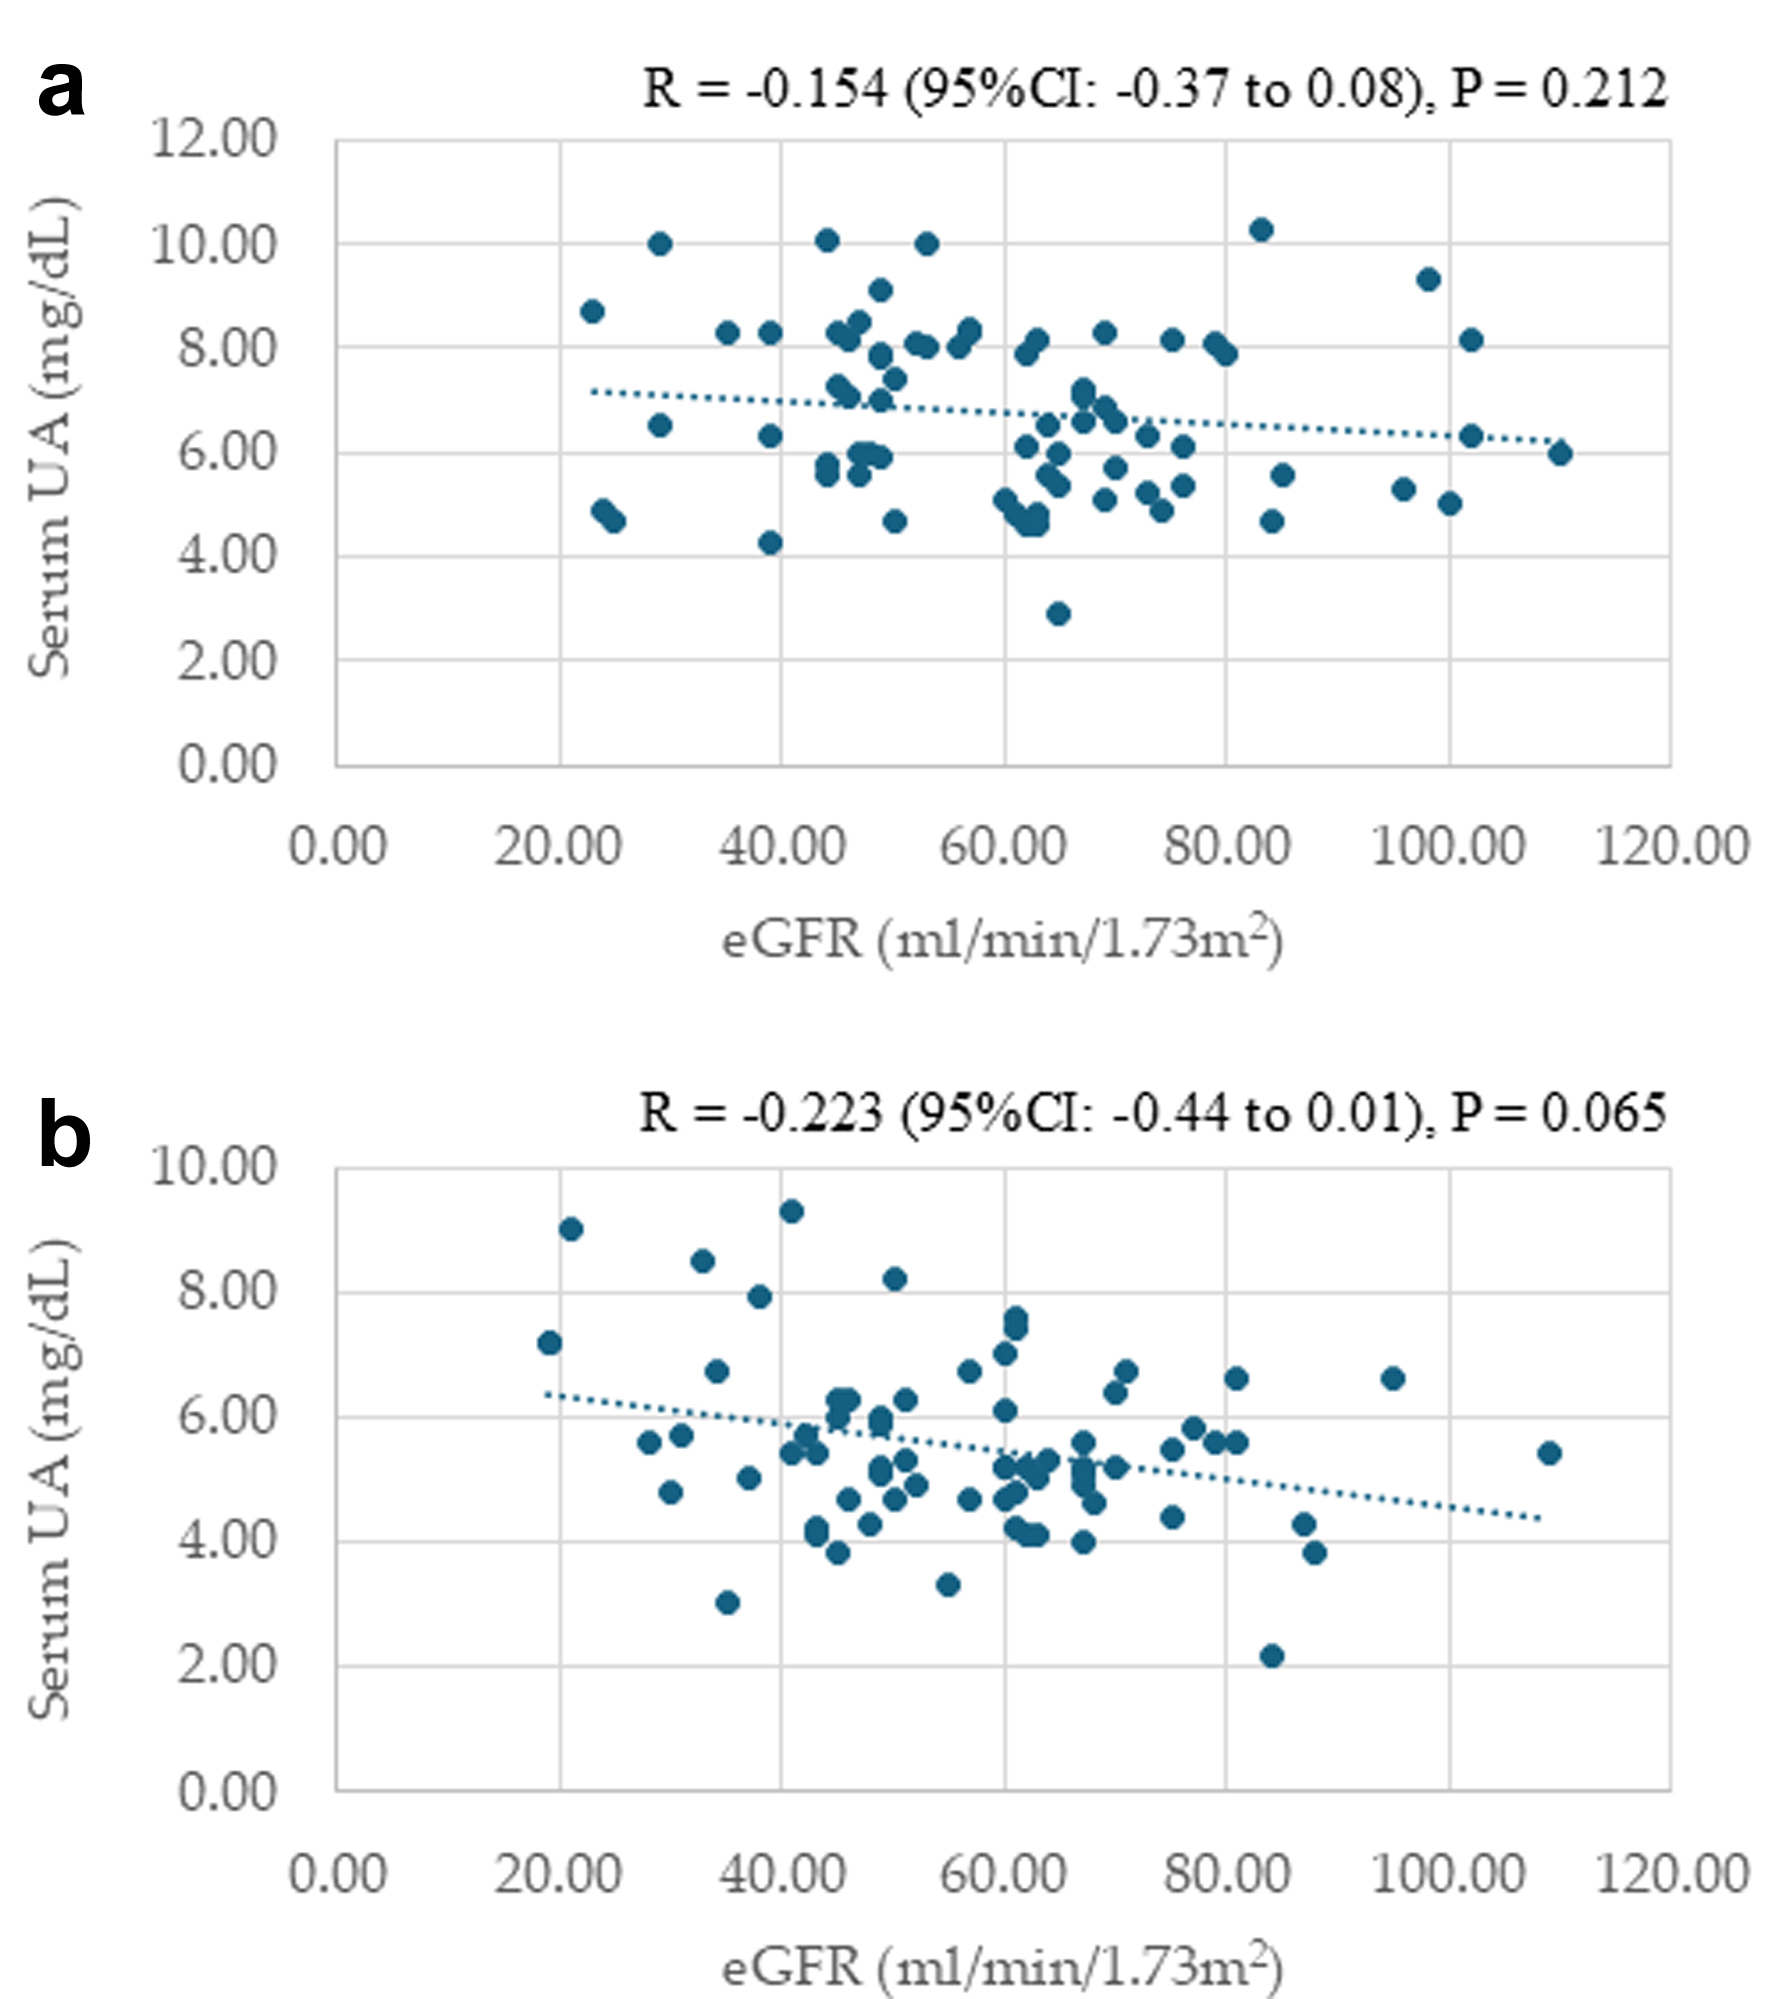
Changes in serum UA as compared with baseline by each dose of dotinurad are shown in Figure 1. Significant differences were observed at 18 and 24 months after starting dotinurad. Reduction in serum UA by daily 2.0 mg of dotinurad was significantly larger than those by both daily 0.5 and 1.0 mg of dotinurad after 18 and 24 months.
 Click for large image |
Figure 1. Changes in serum uric acid (UA) as compared with baseline by each dose of dotinurad. Black, blue, and red circles and error bars indicate the mean ± standard error of reduced values in serum UA among patients who had taken daily 0.5, 1.0, and 2.0 mg of dotinurad, respectively. *P < 0.05 vs. patients who had taken daily 0.5 and 1.0 mg of dotinurad. |
Adverse reactions after the administration of dotinurad
We did not observe any adverse reactions after the administration of dotinurad.
Changes in the severity of MASLD after starting dotinurad
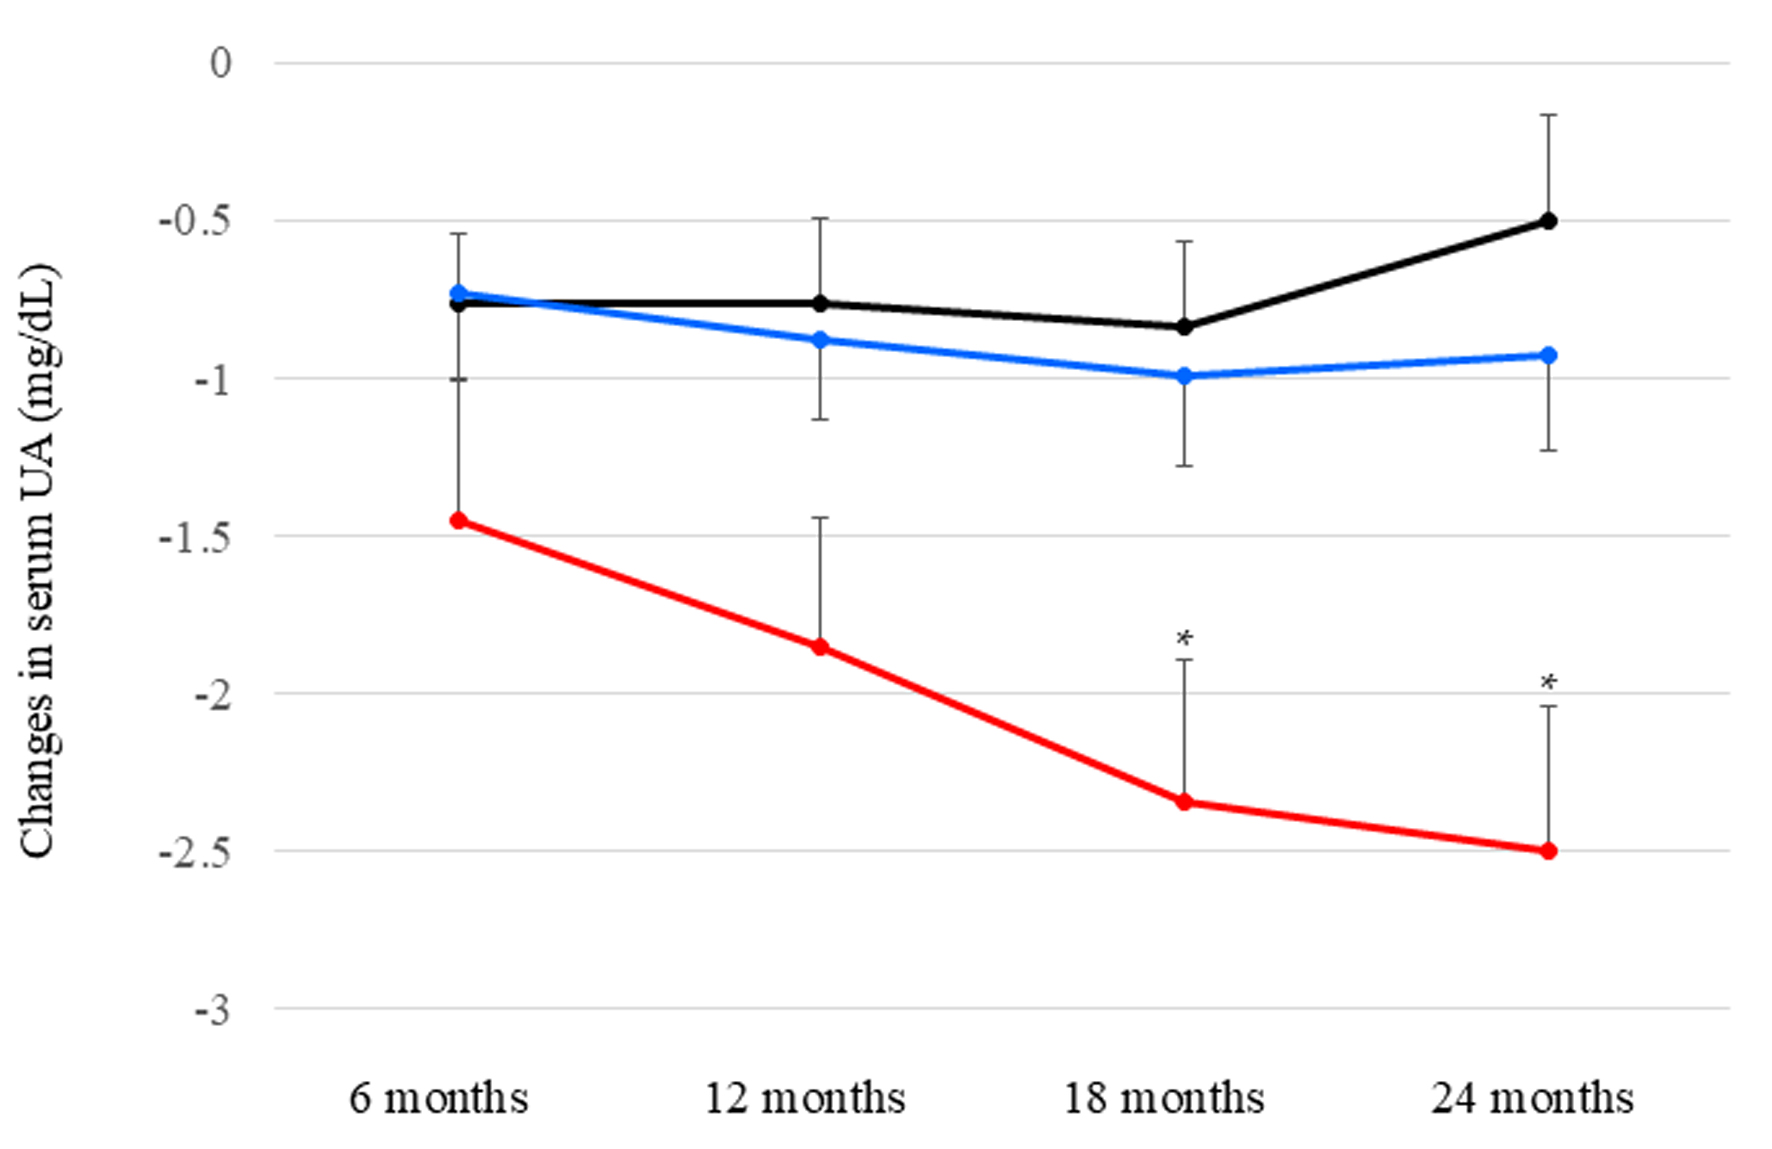
To evaluate the severity of MASLD, we used the hepatic steatosis index as the marker for hepatic steatosis [17]. Changes in the hepatic steatosis index are shown in Figure 2. The hepatic steatosis index significantly decreased after 24 months in all patients and patients who switched from XO inhibitors.
 Click for large image |
Figure 2. Changes in the hepatic steatosis index after starting dotinurad in all patients (a), patients naive to uric acid (UA)-lowering drugs (b), and patients who switched from xanthine oxidase (XO) inhibitors (c). *P < 0.05 vs. baseline. Circles and error bars indicate the mean ± standard error. |
Correlations between serum UA levels and eGFR at baseline and 24 months after starting dotinurad
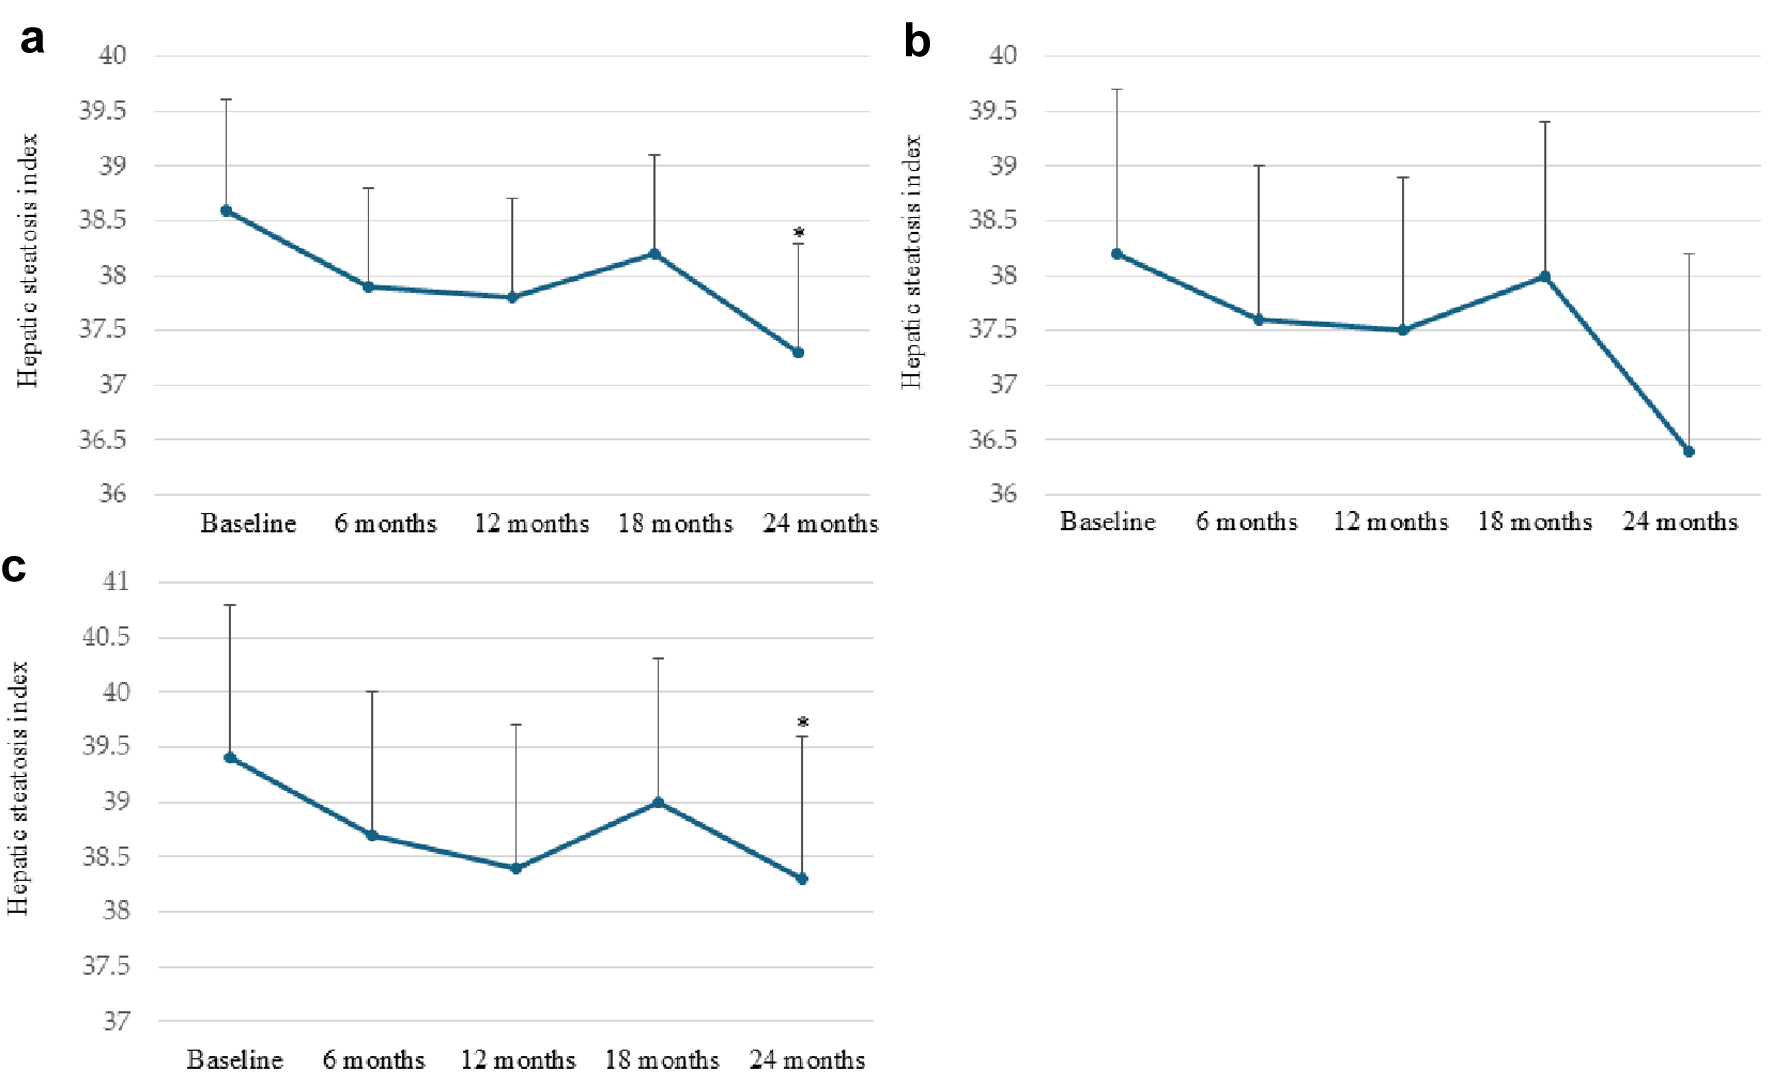
Correlations between serum UA levels and eGFR at baseline and 24 months after starting dotinurad are shown in Figure 3. Serum UA levels were not significantly correlated with eGFR at baseline and 24 months after starting dotinurad.
 Click for large image |
Figure 3. Correlations between serum uric acid (UA) levels and estimated glomerular filtration rate (eGFR) at baseline (a) and 24 months after starting dotinurad (b). |
Correlations between urine UA levels and eGFR at baseline and 24 months after starting dotinurad
Correlations between urine UA levels and eGFR at baseline and 24 months after starting dotinurad are shown in Figure 4. Urine UA levels were not significantly correlated with eGFR at baseline. However, urine UA levels were significantly and positively correlated with eGFR at 24 months after the start of dotinurad.
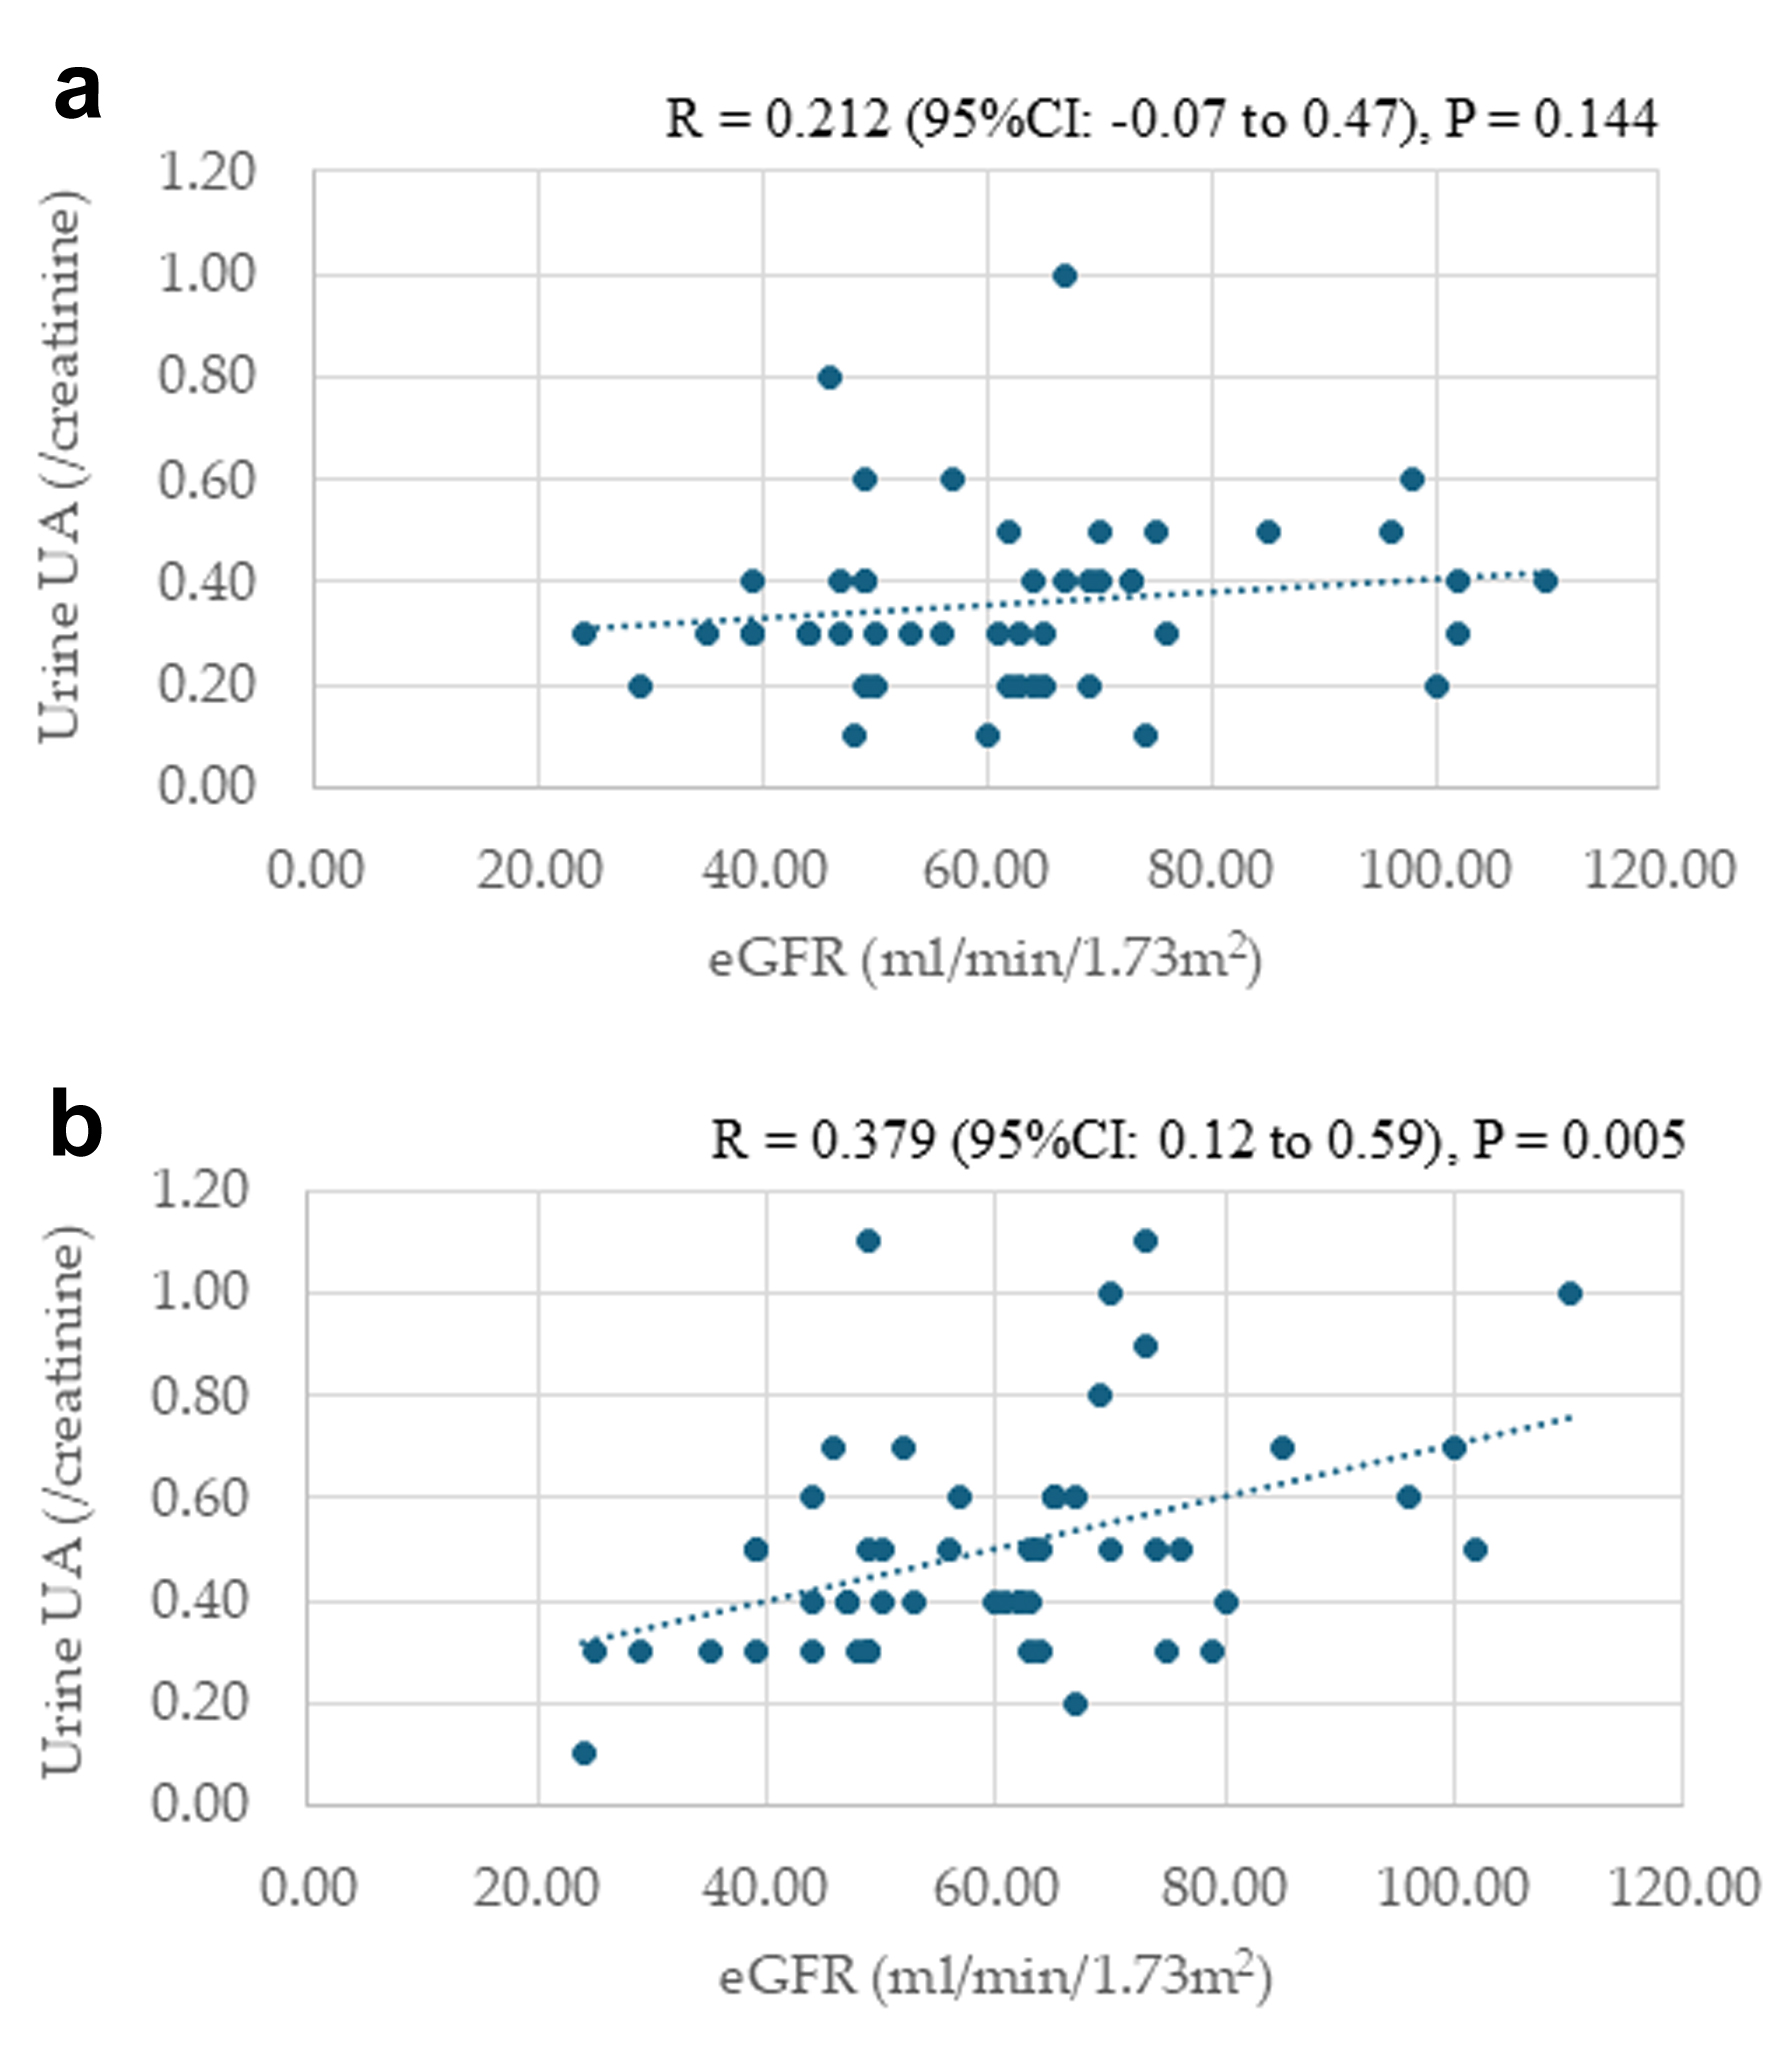 Click for large image |
Figure 4. Correlations between urine uric acid (UA) levels and estimated glomerular filtration rate (eGFR) at baseline (a) and 24 months after starting dotinurad (b). |
Changes in eGFR after starting dotinurad from baseline
The changes in eGFR after 6, 12, 18, and 24 months from baseline in all patients, those naive to UA-lowering drugs, and those who switched from XO inhibitors are shown in Figure 5. In all patients, eGFR significantly decreased at 12, 18, and 24 months after starting dotinurad compared with baseline. In patients naive to UA-lowering drugs, over the 12 months after starting dotinurad, eGFR changed little, and eGFR recovered to baseline after 12 months. A significant decrease in eGFR compared with baseline was observed after 24 months in this group. During the observational period, a significant decline in eGFR from baseline was not observed in patients who switched from XO inhibitors. There were no significant differences in eGFR changes among the three groups at any observation time.
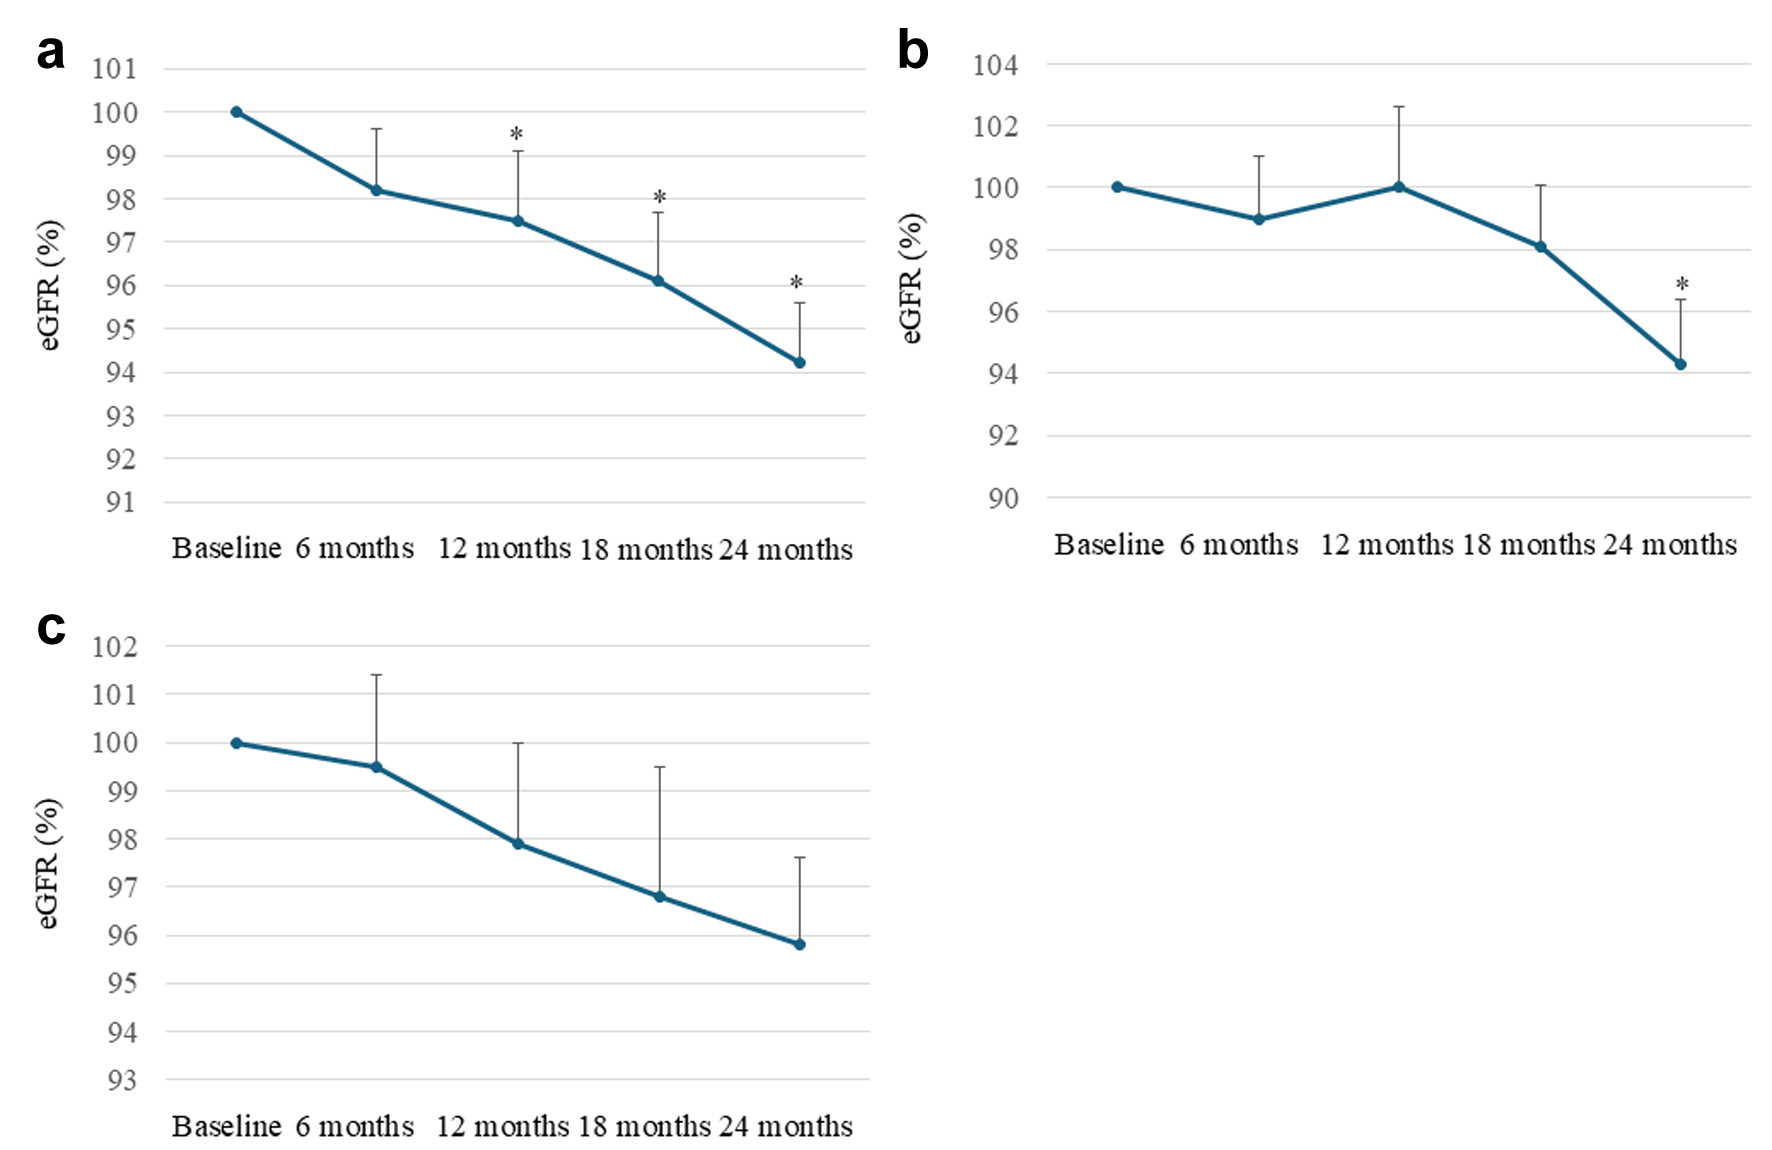 Click for large image |
Figure 5. Changes in estimated glomerular filtration rate (eGFR) after 6, 12, 18, and 24 months from baseline in all patients (a), patients naive to uric acid (UA)-lowering drugs (b), and patients who switched from xanthine oxidase (XO) inhibitors (c). We set the baseline data of each patient as 100% and evaluated the changes in eGFR as percent changes in each observation period. *P < 0.05 vs. baseline. Circles and error bars indicate the mean ± standard error. |
| Discussion | ▴Top |
Pharmacologically, dotinurad decreases serum UA levels by selectively inhibiting URAT1 and decreasing reabsorption of urine UA, which was supported by our result that dotinurad significantly increased urine UA and reduced serum UA during the observation time in all patients. Although a difference in serum UA was not observed after the switching from XO inhibitors to dotinurad, an elevation in urine UA (P < 0.05 vs. baseline) was observed in such patients. Dotinurad showed a UA-lowering effect equivalent to that of XO inhibitors that reduce UA production. Furthermore, in our study, the dose-dependent reduction in serum UA was observed. Interestingly, such a dose-dependent reduction in serum UA was more prominent after 18 months.
In the animal study conducted by Tanaka et al, after 16 - 18 weeks of HFD feeding, the mice developed considerable obesity, and dotinurad significantly reduced the body weight of HFD-fed mice at weeks 3 and 4 [15]. Serum TG in HFD-fed mice was increased compared to that in normal-fat diet (NFD)-fed mice and dotinurad significantly decreased serum TG in both NFD- and HFD-fed mice. Furthermore, dotinurad improved HFD-induced MASLD in mice [15]. HFD feeding led to the development of macrovesicular steatosis, lobular inflammation, and hepatocellular ballooning, all of which were dramatically attenuated by dotinurad. Serum ALT and TG were significantly higher in HFD-fed mice than in NFD-fed mice, and dotinurad significantly reduced serum ALT and TG in HFD-fed mice.
In line with these preclinical findings from the animal study by Tanaka et al, our human cohort exhibited a reduction in body weight, an improvement in liver function, a decrease in hepatic steatosis index, and an improvement in serum lipid profile.
URAT1 action has been suggested to be enhanced in the insulin-resistant state, as represented by metabolic syndrome, presumably via persistent exposure to hyperinsulinemia [3, 15, 18, 19]. Conversely, enhanced URAT1 action may induce insulin resistance, leading to a vicious cycle. The development of MASLD is mediated by multiple factors, such as elevated pro-inflammatory cytokines released from adipose tissues, dyslipidemia, and hyperuricemia [20]. In addition, hyperuricemia directly induces fat accumulation and inflammation in hepatocytes and adipose tissue through URAT1 [21]. Thus, we assume that dotinurad improved obesity and MASLD by inhibiting extracellular UA uptake in adipose tissue and hepatocytes via URAT1, reducing lipid deposition and inflammation. UA enters the liver via URAT1, and induces inflammation and oxidative stress, which upregulates the genes associated with fatty acids (FAs) and lipids synthesis, such as sterol regulatory element-binding protein 1c (SREBP-1c) and stearoyl-CoA desaturase 1 (SCD-1), and downregulates the genes associated with FA oxidation such as peroxisome proliferator-activated receptor alpha (PPARα) and carnitine palmitoyl-transferase 1 (CPT-1) [22]. The inhibition of UA entry into the liver via URAT1 by dotinurad may upregulate the genes associated with FA oxidation and may downregulate the genes associated with FA and lipids synthesis, which can explain an improvement in serum lipids by dotinurad in our study [22].
UA is taken up into the adipocytes via URAT1 and induces reactive oxygen species (ROS) synthesis and inflammation, impairing systemic insulin resistance [23]. ROS inhibition has been shown to lead to uncoupling protein 1 (UCP1) activation and vice versa in brown adipocytes [24]. Tanaka et al confirmed extracellular uptake of UA into brown adipocytes via URAT1 and that HFD feeding induced ROS synthesis in adipose tissue [15]. Dotinurad reduced ROS levels, leading to the upregulation of UCP1 in adipose tissue [15]. Upregulation of UCP1 resulting from reduced ROS production by blocking UA entry to adipose tissue by dotinurad might have induced body weight loss in our study.
Epidemiological studies have reported a significant association between hyperuricemia and CKD [14]. Hyperuricemia contributes to the development of glomerulosclerosis and interstitial fibrosis [25, 26]. Hyperuricemia may aggravate kidney damage through renin-angiotensin system activation [25, 27], induction of macrophage infiltration, renal tubular epithelial to mesenchymal transition, and increased expression of inflammatory mediators [28].
Another URAT1 inhibitor compound 18 with cytoprotective efficacy was recently identified by screening an internal library against hyperuricemia using a UA-induced HK-2 cell injury model [29]. Compound 18 significantly reduced serum UA levels by inhibiting URAT1 activity and improved kidney function by lowering serum creatinine and urea nitrogen levels while attenuating tubular dilation and inflammatory cell infiltration in the kidneys in hyperuricemic nephropathy mice. Additionally, it suppressed the release of the proinflammatory cytokines interleukin 1 beta (IL-1β) and tumor necrosis factor-alpha (TNF-α) and reduced kidney fibrosis.
In our study, another selective inhibitor of URAT1, dotinurad, significantly reduced UACR at 24 months after starting dotinurad compared to baseline in all patients and patients naive to UA-lowering drugs. In patients naive to UA-lowering drugs, over the 12 months after starting dotinurad, eGFR changed little, and eGFR recovered to baseline after 12 months. These results suggest that dotinurad improved renal function by blocking the entry of UA into the kidney. A significant and positive correlation between urine UA and eGFR at 24 months supports this hypothesis.
Furthermore, dotinurad showed a significant reduction in UACR at 6 months after starting dotinurad compared to baseline in all patients and patients who switched from XO inhibitors. Patients who switched from XO inhibitors did not show a significant decrease in eGFR after starting dotinurad compared to baseline at any time. An improvement in renal function due to switching from XO inhibitors to dotinurad may be associated with an inhibition of ABCG2 by XO inhibitors.
ABCG2 is a high-capacity UA exporter [30], and ABCG2 is also a major transporter of uremic toxins such as indoxyl sulfate (IS) [31]. ABCG2 regulates the pathophysiological excretion of IS and strongly affects CKD survival rates [32]. Dotinurad has no effect on ABCG2 [33]. However, febuxostat (XO inhibitor) completely inhibits ABCG2, and topiroxostat (XO inhibitor) inhibits ABCG2 by over 80% [34]. CKD patients accumulate uremic toxins in the body. Over 80% of patients who switched from XO inhibitors had taken febuxostat or topiroxostat. Over 70% of patients had CKD at baseline. Such backgrounds may induce an improvement in renal function due to switching from XO inhibitors to dotinurad. High selectivity for URAT1 without inhibiting ABCG2 of dotinurad may be beneficial for suppressing CKD progression.
However, eGFR significantly decreased at 12, 18, and 24 months after starting dotinurad compared with baseline in all patients. It seems that GFR was significantly reduced after the dotinurad therapy. Over 70% of patients had CKD, and over 65% of patients had type 2 diabetes at baseline, suggesting that approximately two-thirds of patients had diabetic kidney disease (DKD). In the Japanese CKD cohort study, the annual decline of eGFR in DKD patients was reported to be 2.96 mL/min/1.73 m2 [35]. In our study, the annual decline of eGFR was approximately 1.9 mL/min/1.73 m2, indicating that dotinurad would rather retard eGFR decline. However, to elucidate this, a prospective randomized controlled trial comparing dotinurad to placebo should be performed in the future.
After 12 months, HbA1c showed a small (0.1%) but statistically significant increase in patients who switched from XO inhibitors. The cause of this phenomenon is currently unknown, but it should be studied in the future.
Limitations of the study need to be addressed. This is a retrospective observational study, limiting inferences of causality and its direction. Although we did not change treatments for diabetes, hypertension, and dyslipidemia intentionally during the observation period, we cannot deny the beneficial role of the concomitant assumption of other drugs, including the aspect of synergism and/or the possible interaction between dotinurad and other treatments for metabolic parameters. Lack of information for diet and physical activity may be also limitation in the study. The most fundamental limitation lies in its design as a retrospective observational study without a control group. This makes it impossible to establish definitive causal relationships between dotinurad treatment and observed changes in metabolic parameters and renal function. To address fundamental design issues, a prospective randomized controlled trial comparing dotinurad to placebo or standard treatment would provide more robust evidence.
Conclusion
Pharmacologically, dotinurad decreases serum UA levels, by selectively inhibiting URAT1 and decreasing renal reabsorption of UA, which was supported by our result that dotinurad significantly increased urine UA and reduced serum UA. In addition to UA-lowering, dotinurad was associated with an improvement in body weight, liver function, hepatic steatosis index, and serum lipids, which may be induced by the blocking of entry of UA via URAT1 to the liver and adipose tissue. Dotinurad was associated with reduced albuminuria and the maintenance of eGFR in patients naive to UA-lowering drugs, suggesting that dotinurad improved renal function by blocking the entry of UA into the kidney. The switching from XO inhibitors to dotinurad was beneficial for UACR and maintaining eGFR. ABCG2 regulates renal and intestinal excretion of IS and strongly affects CKD prognosis. Febuxostat and topiroxostat are strong ABCG2 inhibitors, decreasing renal and intestinal IS excretion, which unfavorably affects renal function. Therefore, the switching from XO inhibitors to dotinurad, which does not inhibit ABCG2, may be beneficial for UACR and maintaining eGFR in CKD patients with hyperuricemia.
Acknowledgments
We thank Ayano Sakakibara and Yukie Kawamura, the Division of Research Support staff at the National Center for Global Health and Medicine Kohnodai Hospital.
Financial Disclosure
The authors have no financial disclosures to report.
Conflict of Interest
The authors declare that they have no conflict of interest concerning this article.
Informed Consent
Not applicable.
Author Contributions
HY contributed to conceptualization, supervision, writing - original draft, review and editing. MH and HA contributed to formal analysis and data curation. HK contributed to conceptualization and data curation. All authors have read and agreed to the published version of the manuscript.
Data Availability
The data supporting the findings of this study are available from the corresponding author upon reasonable request.
Abbreviations
ABCG2: ATP-binding cassette transporter G2; ALT: alanine aminotransferase; AST: aspartate aminotransferase; BMI: body mass index; BP: blood pressure; CI: confidence interval; CKD: chronic kidney disease; CPT-1: carnitine palmitoyl-transferase 1; CVD: cardiovascular disease; DKD: diabetic kidney disease; eGFR: estimated glomerular filtration rate; FA: fatty acid; GLUT9: glucose transporter 9; GGT: gamma-glutamyl transferase; HbA1c: hemoglobin A1c; HDL-C: high-density lipoprotein-cholesterol; HFD: high-fat diet; IL-1β: interleukin 1 beta; IS: indoxyl sulfate; LDL-C: low-density lipoprotein-cholesterol; MASLD: metabolic dysfunction-associated steatotic liver disease; NFD: normal-fat diet; PPARα: peroxisome proliferator-activated receptor alpha; ROS: reactive oxygen species; RR: relative risk; SCD-1: stearoyl-CoA desaturase 1; SREBP-1c: sterol regulatory element-binding protein 1c; TC: total cholesterol; TG: triglyceride; TNF-α: tumor necrosis factor-alpha; UA: uric acid; UACR: urine albumin/creatinine ratio; UCP1: uncoupling protein 1; URAT1: urate transporter 1; XO: xanthine oxidase
| References | ▴Top |
- El Ridi R, Tallima H. Physiological functions and pathogenic
potential of uric acid: A review. J Adv Res. 2017;8(5):487-493.
doi pubmed - Simmonds HA, McBride MB, Hatfield PJ, Graham R, McCaskey J, Jackson
M. Polynesian women are also at risk for hyperuricaemia and gout because of a genetic defect in
renal urate handling. Br J Rheumatol. 1994;33(10):932-937.
doi pubmed - Yanai H, Adachi H, Hakoshima M, Katsuyama H. Molecular biological and
clinical understanding of the pathophysiology and treatments of hyperuricemia and its
association with metabolic syndrome, cardiovascular diseases and chronic kidney disease.
Int J Mol Sci. 2021;22(17):9221.
doi pubmed - Enomoto A, Kimura H, Chairoungdua A, Shigeta Y, Jutabha P, Cha SH,
Hosoyamada M, et al. Molecular identification of a renal urate anion exchanger that regulates
blood urate levels. Nature. 2002;417(6887):447-452.
doi pubmed - Li S, Sanna S, Maschio A, Busonero F, Usala G, Mulas A, Lai S, et al.
The GLUT9 gene is associated with serum uric acid levels in Sardinia and Chianti cohorts. PLoS
Genet. 2007;3(11):e194.
doi pubmed - Vitart V, Rudan I, Hayward C, Gray NK, Floyd J, Palmer CN, Knott SA,
et al. SLC2A9 is a newly identified urate transporter influencing serum urate concentration,
urate excretion and gout. Nat Genet. 2008;40(4):437-442.
doi pubmed - Matsuo H, Takada T, Ichida K, Nakamura T, Nakayama A, Ikebuchi Y, Ito
K, et al. Common defects of ABCG2, a high-capacity urate exporter, cause gout: a function-based
genetic analysis in a Japanese population. Sci Transl Med. 2009;1(5):5ra11.
doi pubmed - Hisatome I, Ichida K, Mineo I, Ohtahara A, Ogino K, Kuwabara M, Ishizaka N, et al. Japanese Society of Gout and Uric & Nucleic Acids. 2019 Guidelines for Management of Hyperuricemia and Gout 3rd Edition. Gout Uric Nucleic Acids. 2020;44(Supplement):1-40.
- Yuan H, Yu C, Li X, Sun L, Zhu X, Zhao C, Zhang Z, et al. Serum uric
acid levels and risk of metabolic syndrome: a dose-response meta-analysis of prospective
studies. J Clin Endocrinol Metab. 2015;100(11):4198-4207.
doi pubmed - Kuwabara M, Ae R, Kosami K, Kanbay M, Andres-Hernando A, Hisatome I,
Lanaspa MA. Current updates and future perspectives in uric acid research, 2024. Hypertens Res.
2025;48(2):867-873.
doi pubmed - Wang Z, Wu M, Yan H, Zhong S, Xu R, Zhao Z, Yang Q. Association
between remnant cholesterol and risk of hyperuricemia: a cross-sectional study. Horm Metab Res.
2024;56(12):882-889.
doi pubmed - Wang Z, Wu M, Du R, Tang F, Xu M, Gu T, Yang Q. The relationship
between non-high-density lipoprotein cholesterol to high-density lipoprotein cholesterol ratio
(NHHR) and hyperuricaemia. Lipids Health Dis. 2024;23(1):187.
doi pubmed - Hu X, Rong S, Wang Q, Sun T, Bao W, Chen L, Liu L. Association
between plasma uric acid and insulin resistance in type 2 diabetes: A Mendelian randomization
analysis. Diabetes Res Clin Pract. 2021;171:108542.
doi pubmed - Borghi C, Agabiti-Rosei E, Johnson RJ, Kielstein JT, Lurbe E, Mancia
G, Redon J, et al. Hyperuricaemia and gout in cardiovascular, metabolic and kidney disease.
Eur J Intern Med. 2020;80:1-11.
doi pubmed - Tanaka Y, Nagoshi T, Takahashi H, Oi Y, Yoshii A, Kimura H, Ito K, et
al. URAT1-selective inhibition ameliorates insulin resistance by attenuating diet-induced
hepatic steatosis and brown adipose tissue whitening in mice. Mol Metab. 2022;55:101411.
doi pubmed - Matsuo S, Imai E, Horio M, Yasuda Y, Tomita K, Nitta K, Yamagata K,
et al. Revised equations for estimated GFR from serum creatinine in Japan.
Am J Kidney Dis. 2009;53(6):982-992.
doi pubmed - Lee JH, Kim D, Kim HJ, Lee CH, Yang JI, Kim W, Kim YJ, et al. Hepatic
steatosis index: a simple screening tool reflecting nonalcoholic fatty liver disease. Dig Liver
Dis. 2010;42(7):503-508.
doi pubmed - Toyoki D, Shibata S, Kuribayashi-Okuma E, Xu N, Ishizawa K,
Hosoyamada M, Uchida S. Insulin stimulates uric acid reabsorption via regulating urate
transporter 1 and ATP-binding cassette subfamily G member 2. Am J Physiol Renal
Physiol. 2017;313(3):F826-F834.
doi pubmed - Matsubayashi M, Sakaguchi YM, Sahara Y, Nanaura H, Kikuchi S, Asghari
A, Bui L, et al. 27-Hydroxycholesterol regulates human SLC22A12 gene expression through estrogen
receptor action. FASEB J. 2021;35(1):e21262.
doi pubmed - Friedman SL, Neuschwander-Tetri BA, Rinella M, Sanyal AJ. Mechanisms
of NAFLD development and therapeutic strategies. Nat Med. 2018;24(7):908-922.
doi pubmed - Spiga R, Marini MA, Mancuso E, Di Fatta C, Fuoco A, Perticone F,
Andreozzi F, et al. Uric Acid Is Associated With Inflammatory Biomarkers and Induces
Inflammation Via Activating the NF-kappaB Signaling Pathway in HepG2 Cells. Arterioscler Thromb
Vasc Biol. 2017;37(6):1241-1249.
doi pubmed - Yanai H, Adachi H, Hakoshima M, Iida S, Katsuyama H. A possible
therapeutic application of the selective inhibitor of urate transporter 1, Dotinurad, for
metabolic syndrome, chronic kidney disease, and cardiovascular disease. Cells.
2024;13(5):450.
doi pubmed - Baldwin W, McRae S, Marek G, Wymer D, Pannu V, Baylis C, Johnson RJ,
et al. Hyperuricemia as a mediator of the proinflammatory endocrine imbalance in the adipose
tissue in a murine model of the metabolic syndrome. Diabetes. 2011;60(4):1258-1269.
doi pubmed - Cui X, Xiao W, You L, Zhang F, Cao X, Feng J, Shen D, et al.
Age-induced oxidative stress impairs adipogenesis and thermogenesis in brown fat. FEBS J.
2019;286(14):2753-2768.
doi pubmed - Kang DH, Nakagawa T, Feng L, Watanabe S, Han L, Mazzali M, Truong L,
et al. A role for uric acid in the progression of renal disease. J Am Soc Nephrol.
2002;13(12):2888-2897.
doi pubmed - Liu N, Wang L, Yang T, Xiong C, Xu L, Shi Y, Bao W, et al. EGF
receptor inhibition alleviates hyperuricemic nephropathy. J Am Soc Nephrol.
2015;26(11):2716-2729.
doi pubmed - Watanabe S, Kang DH, Feng L, Nakagawa T, Kanellis J, Lan H, Mazzali
M, et al. Uric acid, hominoid evolution, and the pathogenesis of salt-sensitivity. Hypertension.
2002;40(3):355-360.
doi pubmed - Balakumar P, Alqahtani A, Khan NA, Mahadevan N, Dhanaraj SA.
Mechanistic insights into hyperuricemia-associated renal abnormalities with special emphasis on
epithelial-to-mesenchymal transition: Pathologic implications and putative pharmacologic
targets. Pharmacol Res. 2020;161:105209.
doi pubmed - Mao Q, Zhang P, Lin F, Fu X, Zhang B, Liu C, Liu Z, et al. Design,
synthesis and biological evaluation of
2-[1-(pyridin-2-ylmethyl)-1H-pyrazole-3-carboxamido]benzoic acids as promising urate transporter
1 inhibitors with potential nephroprotective efficacy for the treatment of hyperuricemic
nephropathy. Eur J Med Chem. 2025;290:117507.
doi pubmed - Ichida K, Matsuo H, Takada T, Nakayama A, Murakami K, Shimizu T,
Yamanashi Y, et al. Decreased extra-renal urate excretion is a common cause of hyperuricemia.
Nat Commun. 2012;3:764.
doi pubmed - Takada T, Yamamoto T, Matsuo H, Tan JK, Ooyama K, Sakiyama M, Miyata
H, et al. Identification of ABCG2 as an exporter of uremic toxin indoxyl sulfate in mice and as
a crucial factor influencing CKD progression. Sci Rep. 2018;8(1):11147.
doi pubmed - Holle J, Kirchner M, Okun J, Bayazit AK, Obrycki L, Canpolat N, Bulut
IK, et al. Serum indoxyl sulfate concentrations associate with progression of chronic kidney
disease in children. PLoS One. 2020;15(10):e0240446.
doi pubmed - Taniguchi T, Ashizawa N, Matsumoto K, Saito R, Motoki K, Sakai M,
Chikamatsu N, et al. Pharmacological evaluation of Dotinurad, a selective urate reabsorption
inhibitor. J Pharmacol Exp Ther. 2019;371(1):162-170.
doi pubmed - Miyata H, Takada T, Toyoda Y, Matsuo H, Ichida K, Suzuki H.
Identification of febuxostat as a new strong ABCG2 inhibitor: potential applications and risks
in clinical situations. Front Pharmacol. 2016;7:518.
doi pubmed - Hoshino J, Tsunoda R, Nagai K, Kai H, Saito C, Ito Y, Asahi K, et al.
Comparison of annual eGFR decline among primary kidney diseases in patients with CKD G3b-5:
results from a REACH-J CKD cohort study. Clin Exp Nephrol. 2021;25(8):902-910.
doi pubmed
This
article is distributed under the terms of the Creative Commons Attribution Non-Commercial 4.0
International License, which permits unrestricted non-commercial use, distribution, and
reproduction in any medium, provided the original work is properly cited.
Journal
of Clinical Medicine Research is published by Elmer Press Inc.