| Journal of Clinical Medicine Research, ISSN 1918-3003 print, 1918-3011 online, Open Access |
| Article copyright, the authors; Journal compilation copyright, J Clin Med Res and Elmer Press Inc |
| Journal website https://jocmr.elmerjournals.com |
Original Article
Volume 17, Number 7, July 2025, pages 398-407

Improving a Clinical Prediction Model for Computed Tomography Head Scan Use in Non-Traumatic Seizures: The SeizCT Optimized Model
Kreshya Sudsanoha ![]() , Thanin Lokeskraweea,
f
, Thanin Lokeskraweea,
f ![]() , Natthaphon
Pruksathorna
, Natthaphon
Pruksathorna ![]() , Suppachai
Lawanaskolb
, Suppachai
Lawanaskolb ![]() , Jayanton Patumanondc, Wanwisa
Bumrungpagdeed, Suwapim Chanlaord, Chawalit Lakdeed, Pimploy
Suriyanusorne
, Jayanton Patumanondc, Wanwisa
Bumrungpagdeed, Suwapim Chanlaord, Chawalit Lakdeed, Pimploy
Suriyanusorne
aDepartment of Emergency Medicine, Lampang Hospital, Mueang District, Lampang 52000,
Thailand
bChaiprakarn Hospital, Chiang Mai, Thailand
cClinical
Epidemiology and Clinical Statistics Unit, Faculty of Medicine, Naresuan University,
Phitsanulok, Thailand
dDepartment of Radiology, Buddhachinaraj Phitsanulok
Hospital, Phitsanulok, Thailand
eDepartment of Emergency Medicine, Chomthong
Hospital, Chiang Mai, Thailand
fCorresponding Author: Thanin Lokeskrawee,
Department of Emergency Medicine, Lampang Hospital, Mueang District, Lampang 52000, Thailand
Manuscript submitted May 29, 2025, accepted July 22, 2025, published online July 31,
2025
Short title: SeizCT Optimized Model for CT in Seizures
doi:
https://doi.org/10.14740/jocmr6282
| Abstract | ▴Top |
Background: A previous study developed a predictive model for identifying positive findings on computed tomography (CT) brain imaging in patients with non-traumatic seizures. One key predictor was the Glasgow Coma Scale (GCS), categorized into three groups (≤ 8, 9 - 13, >13). However, in real-world practice, some bedridden patients have low baseline GCS, which may lead to overprediction and unnecessary CT imaging. The original model yielded a false positive of 16.6%, exceeding the predefined threshold of less than 15%. This study aimed to improve the model by replacing categorized GCS with GCS change from baseline to reduce false positives below 15%, while maintaining false negatives below 5%.
Methods: This diagnostic predictive study included patients with non-traumatic seizures who underwent CT brain imaging at the emergency department between November 2019 and November 2023. The original predictors were retained, with GCS change from baseline replacing the categorized GCS. Multivariable logistic regression analysis was used to estimate multivariable odds ratios. Discriminative performance was assessed using the area under the receiver operating characteristic (AuROC) curve. A trade-off between sensitivity and specificity was applied to identify a probability cut-off that met the target for false positives and false negatives. The revised model was named the “SeizCT optimized model”.
Results: Of the 625 patients included, 18.9% had positive CT findings. The majority were male (74.9%) with a mean age of 55 years. The SeizCT optimized model incorporated six predictors: prior stroke (> 3 months), current cancer, GCS change from baseline, alcohol withdrawal symptoms, epilepsy, and focal neurological deficit. The model demonstrated an AuROC of 0.8221 (95% confidence interval (CI): 0.7813, 0.8629). Using a threshold probability of 22.57%, it outperformed the original model (AuROC of 0.8156; 95% CI: 0.7586, 0.8727) with narrower confidence intervals. It achieved a false negative of 4.8% and a false positive of 14.4%.
Conclusions: The SeizCT optimized model showed improved performance over the original tool, reducing both false positives and false negatives within the predefined thresholds. External validation is recommended.
Keywords: Seizures; Computed tomography; Glasgow Coma Scale; Clinical prediction rules; Diagnosis; Mobile applications
| Introduction | ▴Top |
Non-traumatic seizures are a common presentation in the emergency department (ED). Following the initial assessment, all patients routinely undergo capillary blood glucose (CBG) testing, serum electrolyte evaluation, and computed tomography (CT) of the head [1-3]. In Thailand, this standardized approach results in an annual expenditure of approximately 3,360,000 THB ($93,000), despite the relatively low diagnostic yield of CT reported globally. According to a systematic review, the yield ranges from 3.2% to 21.3% of cases [4]. This financial burden highlights the need for a more selective imaging strategy. To address this issue, we developed a clinical prediction model (CPM) tailored for Thai patients - referred to as the SeizCT primer model [5] - which incorporates six clinical parameters: categorized Glasgow Coma Scale (GCS) at ED presentation, focal neurological deficit, history of malignancy, history of cerebrovascular accident (CVA), epilepsy, and symptoms of alcohol withdrawal. The model demonstrated good discriminative ability, with an area under the receiver operating characteristic curve (AuROC) of 0.8156 (95% confidence interval (CI): 0.7598, 0.8746). However, certain limitations emerged in clinical practice, particularly among bedridden patients with a low baseline GCS, which led to overprediction of positive CT head scan. Consequently, the original model yielded a false positive proportion reflecting overinvestigation, reaching 16.6%. When applied in real-world settings, this increased to 17.9% based on local data, exceeding the predetermined threshold of less than 15%. Therefore, the present study aims to refine the model by replacing categorized GCS at presentation with the change in GCS from baseline, in order to reduce false positives to below 15% while maintaining false negatives under 5%.
| Materials and Methods | ▴Top |
Study design
This diagnostic prediction research employed a retrospective observational cross-sectional design conducted in the ED of Lampang Hospital, a tertiary regional center in northern Thailand with 743 general beds and 82 intensive care unit beds. Between November 2019 and November 2023, all patients presenting with non-traumatic seizures routinely underwent laboratory investigations and CT head scan following initial clinical assessment. Baseline characteristics and candidate predictors including the change in GCS from baseline were collected. In contrast, CT head scan results were independently reviewed and interpreted by separate assessors.
Participant and data collection
Participants
Eligible participants were adults aged 18 years or older who presented with non-traumatic seizures and underwent non-contrast CT head scan. Patients were excluded if, upon medical record review, there was evidence suggesting possible traumatic brain injury (TBI) within the preceding 30 days [6]; if the CT head scan were inconclusive and specialists could not determine whether they were related to the seizure etiology; if there was no close relative or caregiver available to help assess the patient’s baseline level of consciousness; or if the patient was pregnant.
Endpoints
The primary endpoint was a positive CT head scan, defined as the presence of one or more lesions routinely identified by a radiologist. These included intracerebral hemorrhage, subarachnoid hemorrhage, acute infarction, arachnoid or subarachnoid cysts, neurocysticercosis, tuberculoma, granulomatous lesions, calcifications, tumors, malignancies, brain metastases, brain edema, arteriovenous malformation (AVM), cerebral venous sinus thrombosis, and hydrocephalus [7-9]. The determination of whether such lesions could have contributed to the current seizure episode was made by consensus of at least two out of three specialists: a neurologist, a neurosurgeon, and a radiologist.
Candidate predictors
1) GCS change from baseline (0 - 12 points)
This was assessed by comparing the presenting GCS score with the patient’s baseline GCS, as documented in the medical record. If the baseline GCS was not available, it was estimated by asking a reliable caregiver simple questions regarding the patient’s eye-opening, verbal, and motor responses. Patients were excluded if the caregiver was uncertain, deemed unreliable, or did not live with the patient [10].
2) Focal neurological deficit (yes or no) [11]
This was determined through neurological examination. A “yes” was recorded if one or more newly observed signs were present, including: a) Motor deficits (weakness in any limb or part of the body); b) Sensory deficits (loss or reduction in sensation, including touch, pain, temperature, or proprioception); c) Visual deficits (visual loss or visual field defects (e.g., hemianopia); d) Speech and language problems (impaired communication, comprehension, or slurred speech); e) Coordination problems (signs such as ataxia or loss of coordination in one limb or one side of the body); f) Cranial nerve deficits (such as facial muscle weakness).
In the previous paper, the term “history of malignancy” was used to describe patients with active cancer, though this wording was imprecise. In this study, we use the term “current cancer” for greater accuracy in identifying patients with active or ongoing disease. It is defined as follows: a) Patients receiving chemotherapy, radiotherapy, or oral anticancer medications; b) Asymptomatic patients with a pathological diagnosis of cancer; c) Patients recently diagnosed and awaiting treatment; d) Patients who declined treatment or are receiving palliative care only.
It is a physiological and psychological condition that occurs after reducing or discontinuing alcohol intake. Common symptoms include tremors, irritability, restlessness, nausea, vomiting, heightened autonomic activity, particularly of the sympathetic nervous system such as anxiety, exaggerated startle response, sweating, fever, facial flushing, dilated pupils, tachycardia, and hypertension.
5) Epilepsy (yes or no) [16]
Epilepsy is a brain disorder defined by any of the following conditions: a) At least two unprovoked seizures occurring more than 24 h apart; b) One unprovoked seizure with a high probability of further seizures (at least 60% risk over the next 10 years) similar to the risk following two unprovoked seizures; c) A diagnosis of an epilepsy syndrome.
6) Prior stroke more than 3 months (yes or no) [17]
In the previous paper, the term “history of CVA” was used to describe the same condition, though the wording was imprecise. In this study, we use “prior stroke more than 3 months” for greater clarity and clinical accuracy. It is defined as a history of CVA, either hemorrhagic or ischemic, which occurred at least 3 months prior. If documentation is unavailable but physical examination suggests prior stroke, information was confirmed with a reliable caregiver to distinguish stroke from trauma and to verify the timing.
The six candidate predictors were grouped based on their association with positive CT head scan from our previous study: the first three were associated with an increased likelihood, and the last three with a decreased likelihood. The latter group was ordered based on the typical clinical workflow during data collection. As a result, the predictor order in the presentation differs from that in the original model.
All variables were accessible at the time of prediction, with no missing data. To minimize information bias, predictor variables and endpoints were collected by different individuals.
Specific time point for prediction
This occurred immediately after completion of the primary assessment, once CBG had been measured and blood samples collected for laboratory investigation, just before the decision to perform the CT head scan.
Study size estimation
The required sample size was estimated using the method for multivariable prediction models with a binary outcome, as proposed by Richard D. Riley [18]. Assuming a C-statistic of 0.8, a shrinkage factor of 0.8, seven predictor variables, and a prevalence of positive CT findings in non-traumatic seizure patients of 19.6% [5], a minimum of 268 participants was required, including at least 53 with positive CT head findings.
Statistical analysis
Model derivation
Multivariable logistic regression was used, following the approach of the SeizCT primer model, but with “GCS change from baseline” substituted as a predictor. Results were reported as multivariable odds ratios (mOR) with 95% CI and P values. Clustered robust variance correction was applied to account for patients with multiple seizure-related visits.
Model performance and internal validation
Discrimination of the model was evaluated using the C-statistic, expressed as the AuROC [19]. Calibration was assessed using calibration plots, slope of the calibration line, expected-to-observed (E:O) ratio, and calibration-in-the-large (CITL). Internal validation was performed via bootstrapping with 200 resamples to estimate potential optimism in model performance.
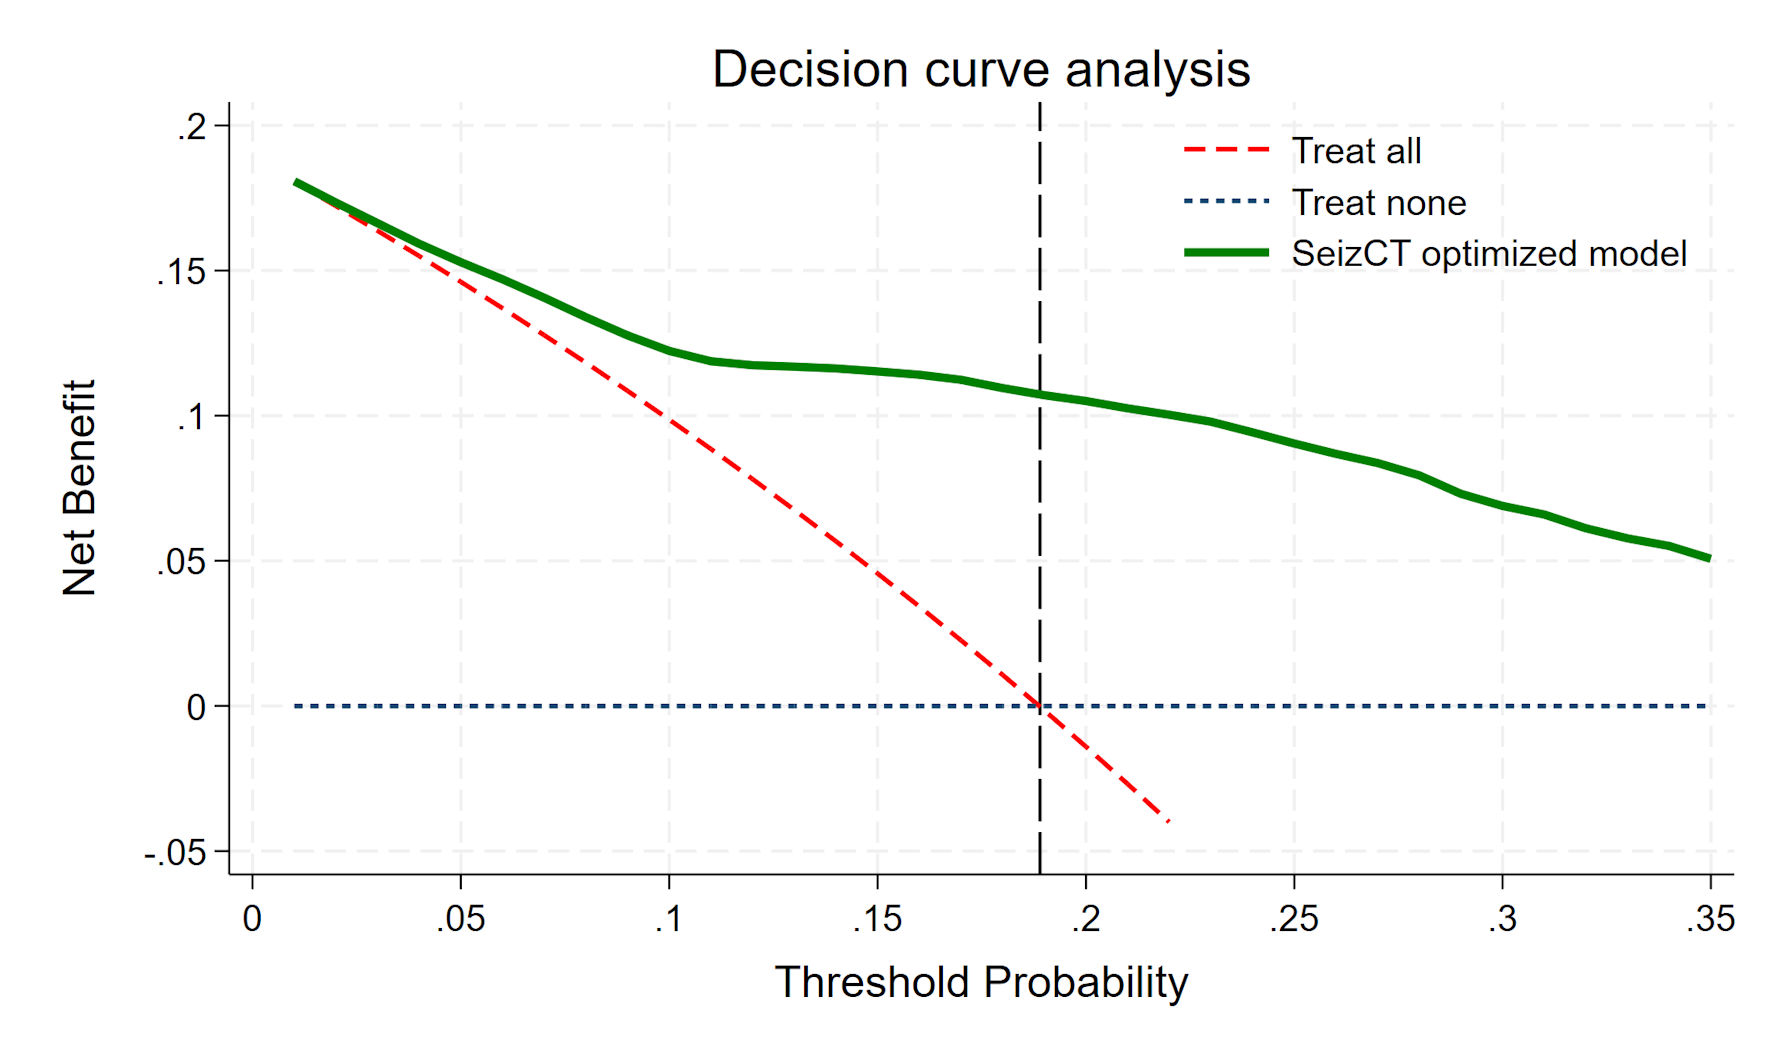
Clinical usefulness of the prediction model was examined using decision curve analysis (DCA) [20, 21], which estimates net benefit (NB) by balancing true positives against false positives. The analysis demonstrated how NB varied across different threshold probabilities in patients presenting with non-traumatic seizures.
Identifying cut point for clinical implication
Diagnostic performance measures - sensitivity, specificity, positive predictive value (PPV), and negative predictive value (NPV) - were calculated based on cut points derived from different predicted probabilities. These indices were obtained from the confusion matrix, with the goal of identifying a threshold yielding less than 5% false negatives and less than 15% false positives relative to the total population.
This study was registered with the Thai Clinical Trials Registry (TCTR) under the identifier TCTR20250512002. Ethical approval was granted by the Institutional Review Board of Lampang Hospital (CERT No. 049.1/66). Given the observational design, the requirement for informed consent was waived. The study was conducted and reported in accordance with the Transparent Reporting of a Multivariable Prediction Model for Individual Prognosis or Diagnosis (TRIPOD) guidelines [22].
| Results | ▴Top |
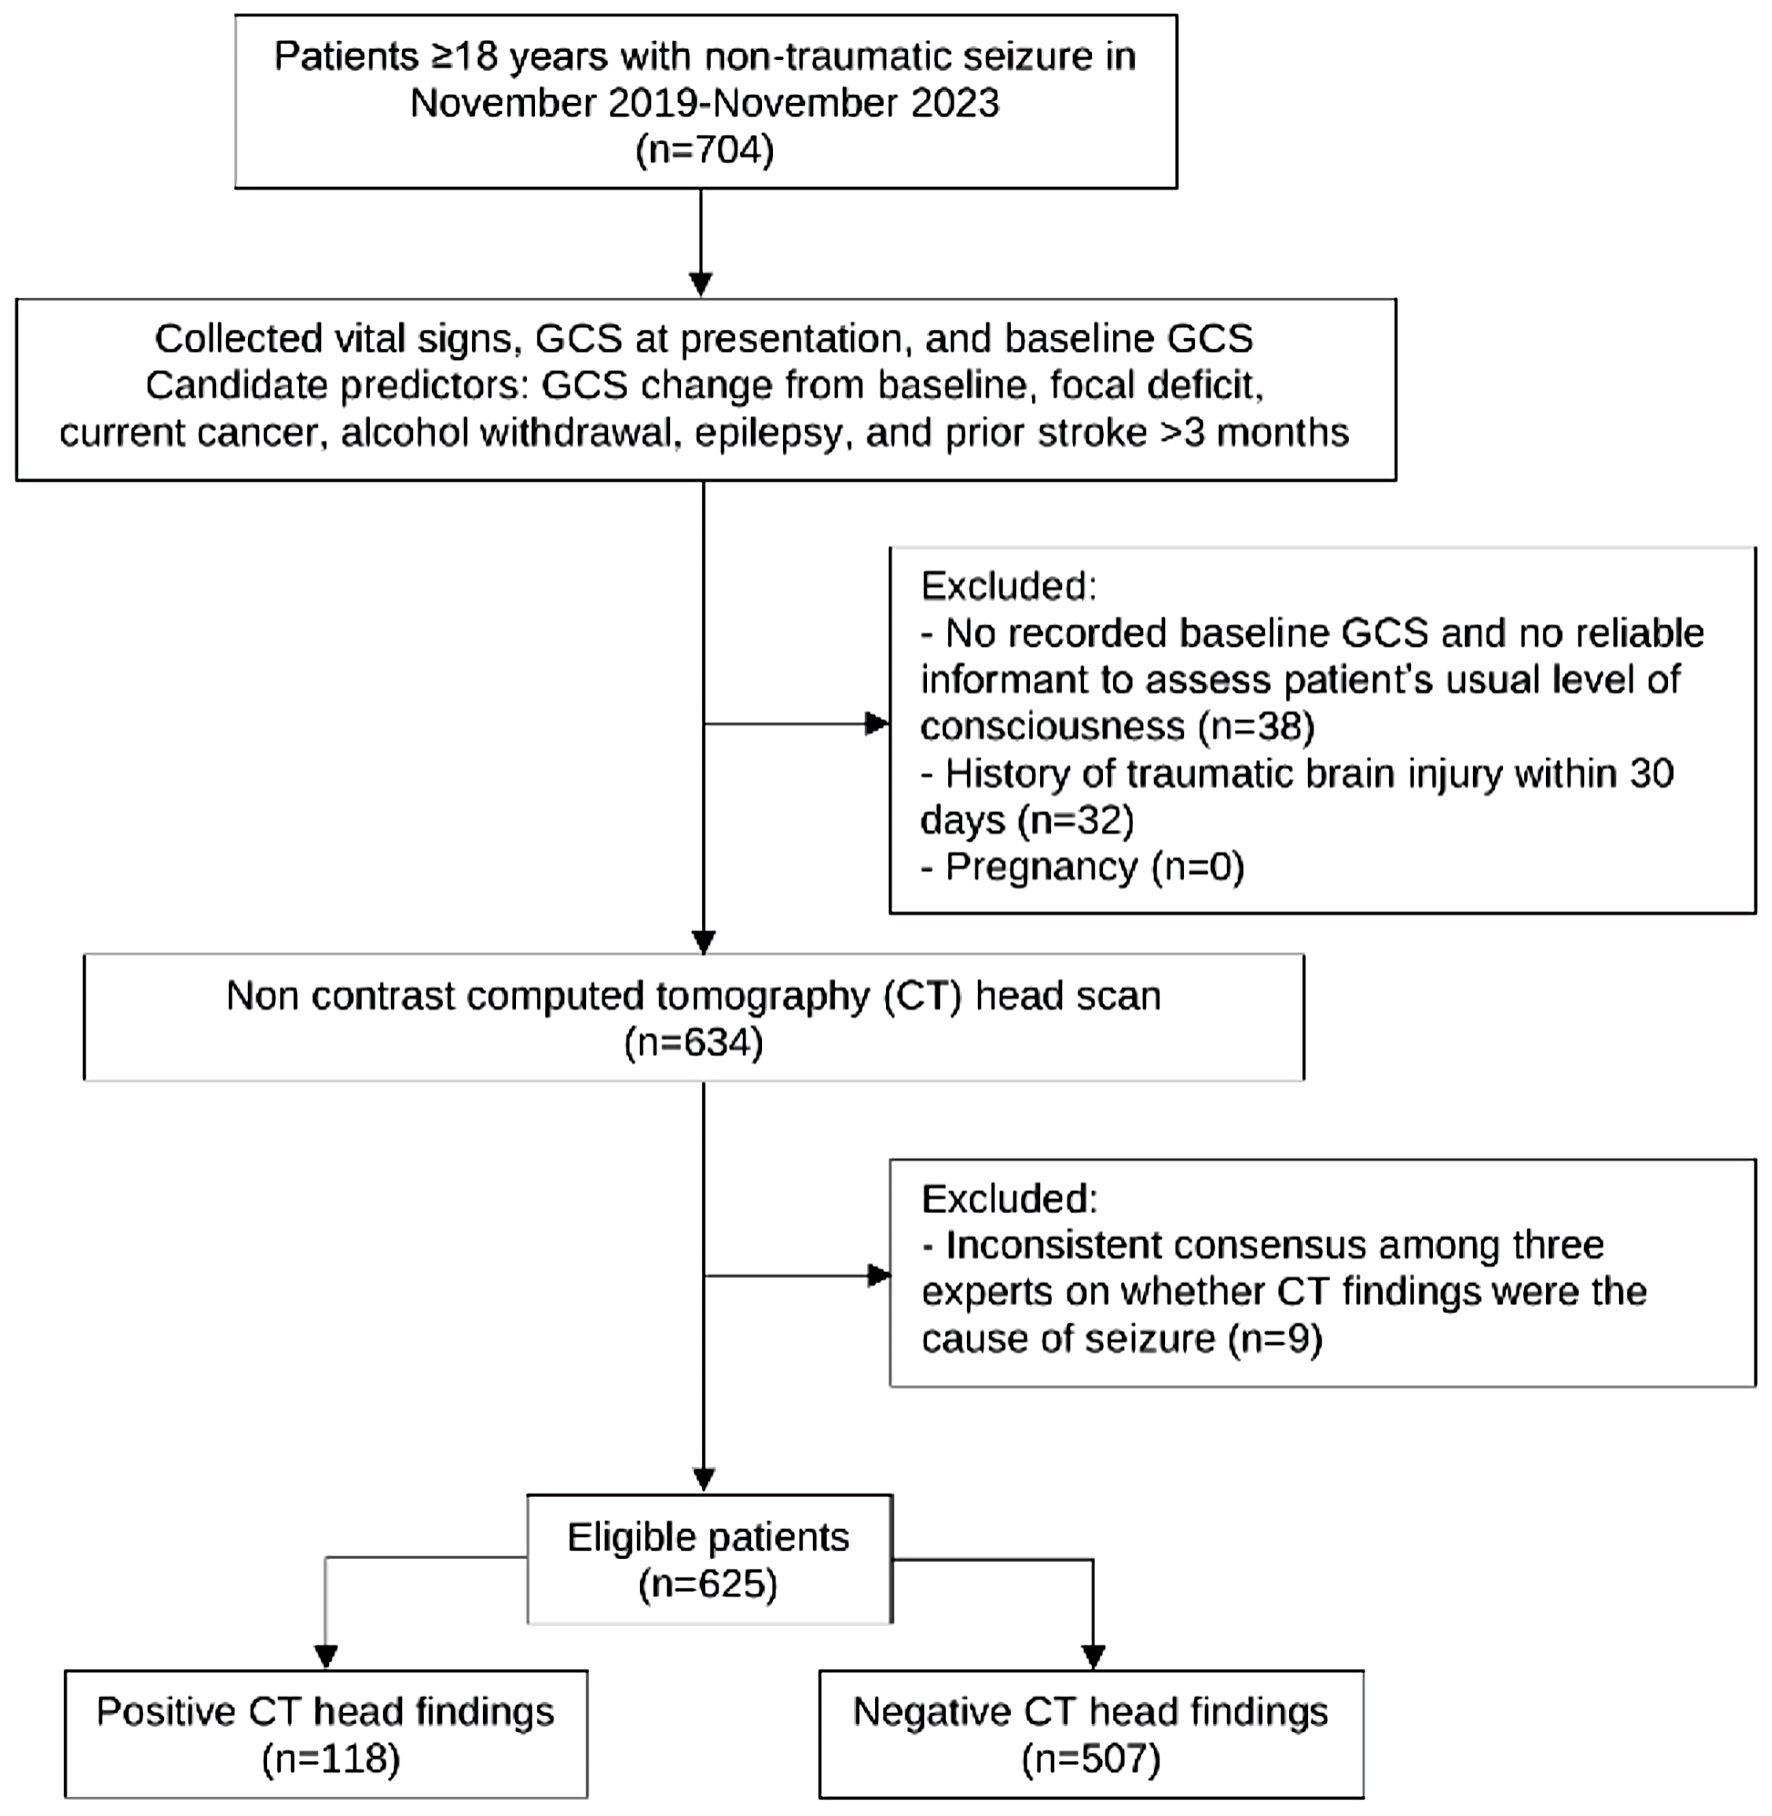
Between November 2019 and November 2023, a total of 625 patients with non-traumatic seizures were included in the study. Of these, 118 had positive CT head findings, while 507 had negative results (Fig. 1), yielding a prevalence of 18.9%. This was slightly lower than the prevalence observed in the SeizCT primer model (19.6%), though the difference was not statistically significant (P = 0.788).
 Click for large image |
Figure 1. Study flow diagram. GCS: Glasgow Coma Scale. |
In this study, most patients were male (74.9%), with a mean age of 54.8 ± 16.8 years. Those with positive CT head findings were more likely to be female, older, have higher systolic blood pressure (SBP), lower GCS at ED presentation, greater GCS change from baseline, and a higher proportion of focal neurological deficits and current cancer. In contrast, previous abnormal CT findings were equally distributed between groups. However, patients with negative CT results during this presentation had a higher proportion of normal prior CT scans, a greater history of epilepsy, and more frequent presentation with alcohol withdrawal symptoms (Table 1).
 Click to view |
Table 1. Baseline Characteristics of Patients
With Positive and Negative Findings on Computed Tomography (CT) Brain
Scans |
Significant predictors
Using multivariable logistic regression with clustered robust variance correction, six predictors were identified for predicting positive CT head scan findings in patients with non-traumatic seizures: GCS change from baseline (mOR: 1.14; 95% CI: 1.07, 1.21; P < 0.001), focal neurological deficit (mOR: 3.83; 95% CI: 2.40, 6.11; P < 0.001), current cancer (mOR: 4.11; 95% CI: 1.79, 9.43; P < 0.001), alcohol withdrawal symptoms (mOR: 0.12; 95% CI: 0.03, 0.49; P = 0.003), epilepsy (mOR: 0.36; 95% CI: 0.19, 0.68; P < 0.001), and prior stroke more than 3 months (mOR: 0.49; 95% CI: 0.26, 0.93; P = 0.030) (Table 2).
Click to view |
Table 2. Predictors of Positive CT Head Scan
Findings From Multivariable Logistic Regression |
Model performances
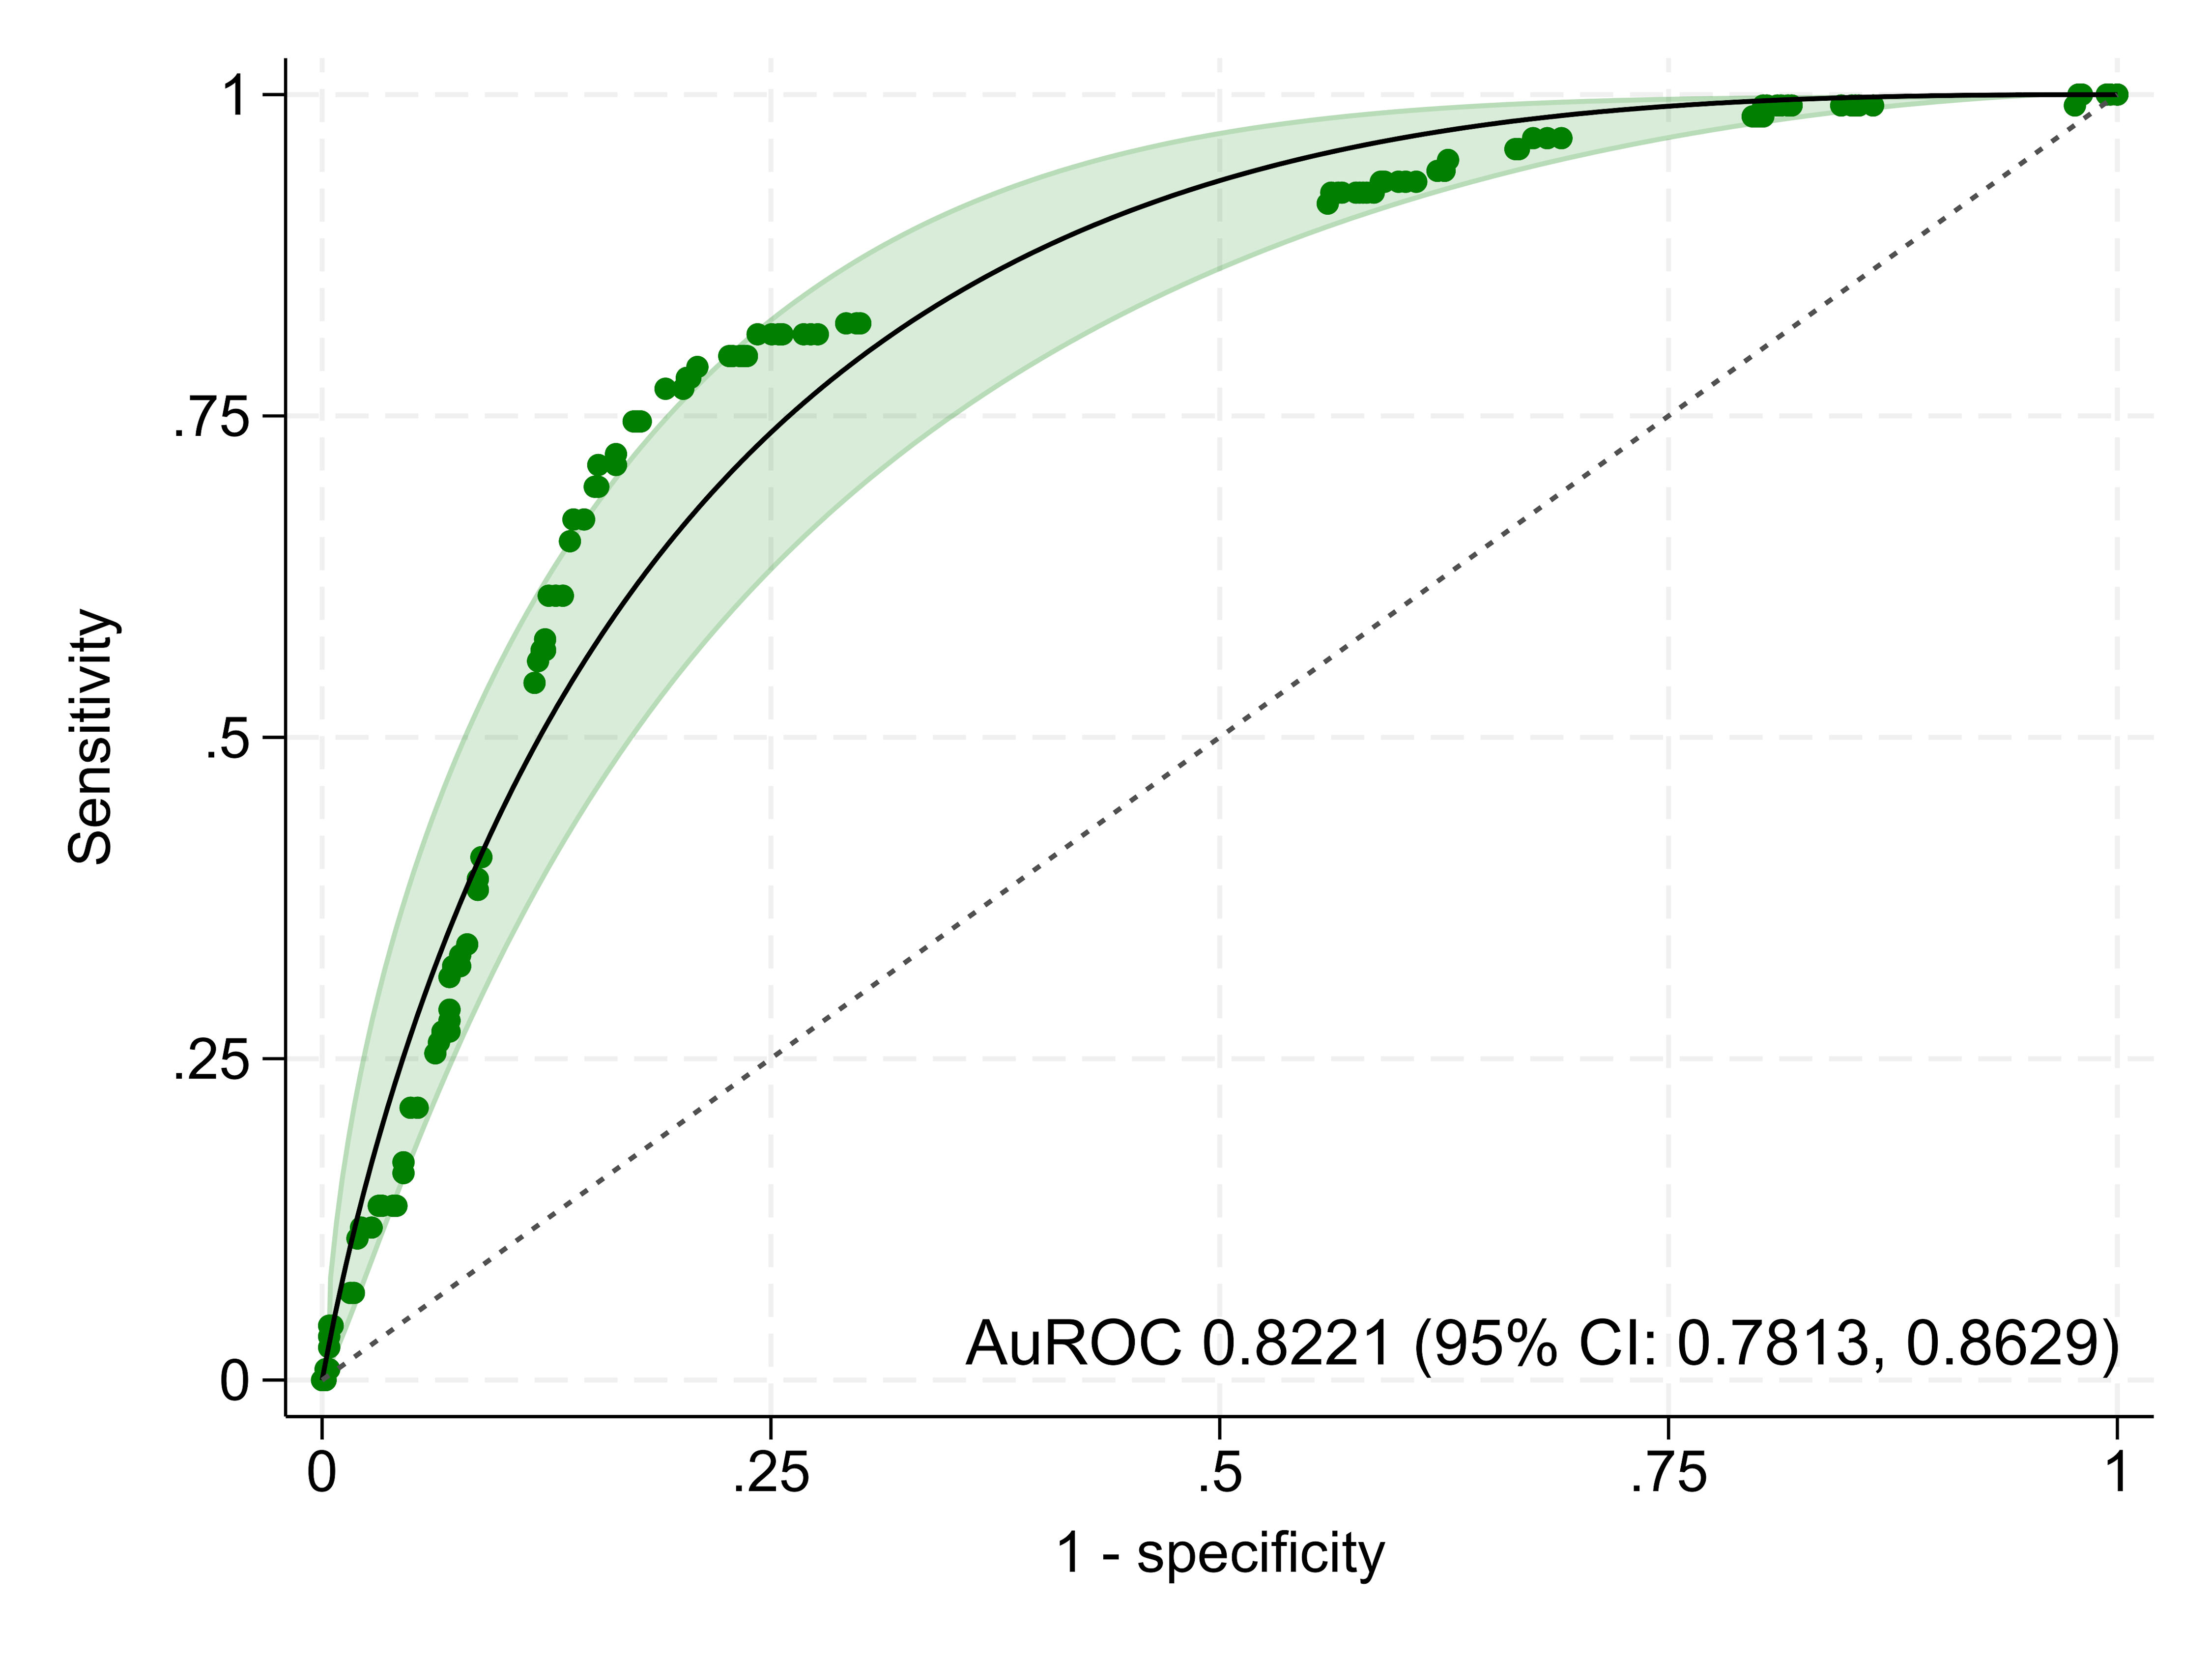
The model demonstrated excellent discriminative ability, with an AuROC of 0.8221 (95% CI: 0.7813, 0.8629) (Fig. 2). While the lower bound suggests performance may be acceptable, the overall result is robust. This was slightly higher than the SeizCT primer model’s AuROC of 0.8156 (95% CI: 0.7598, 0.8746), though the difference was not statistically significant (P = 0.856).
 Click for large image |
Figure 2. The area under the receiver operating characteristic curve (AuROC). CI: confidence interval. |
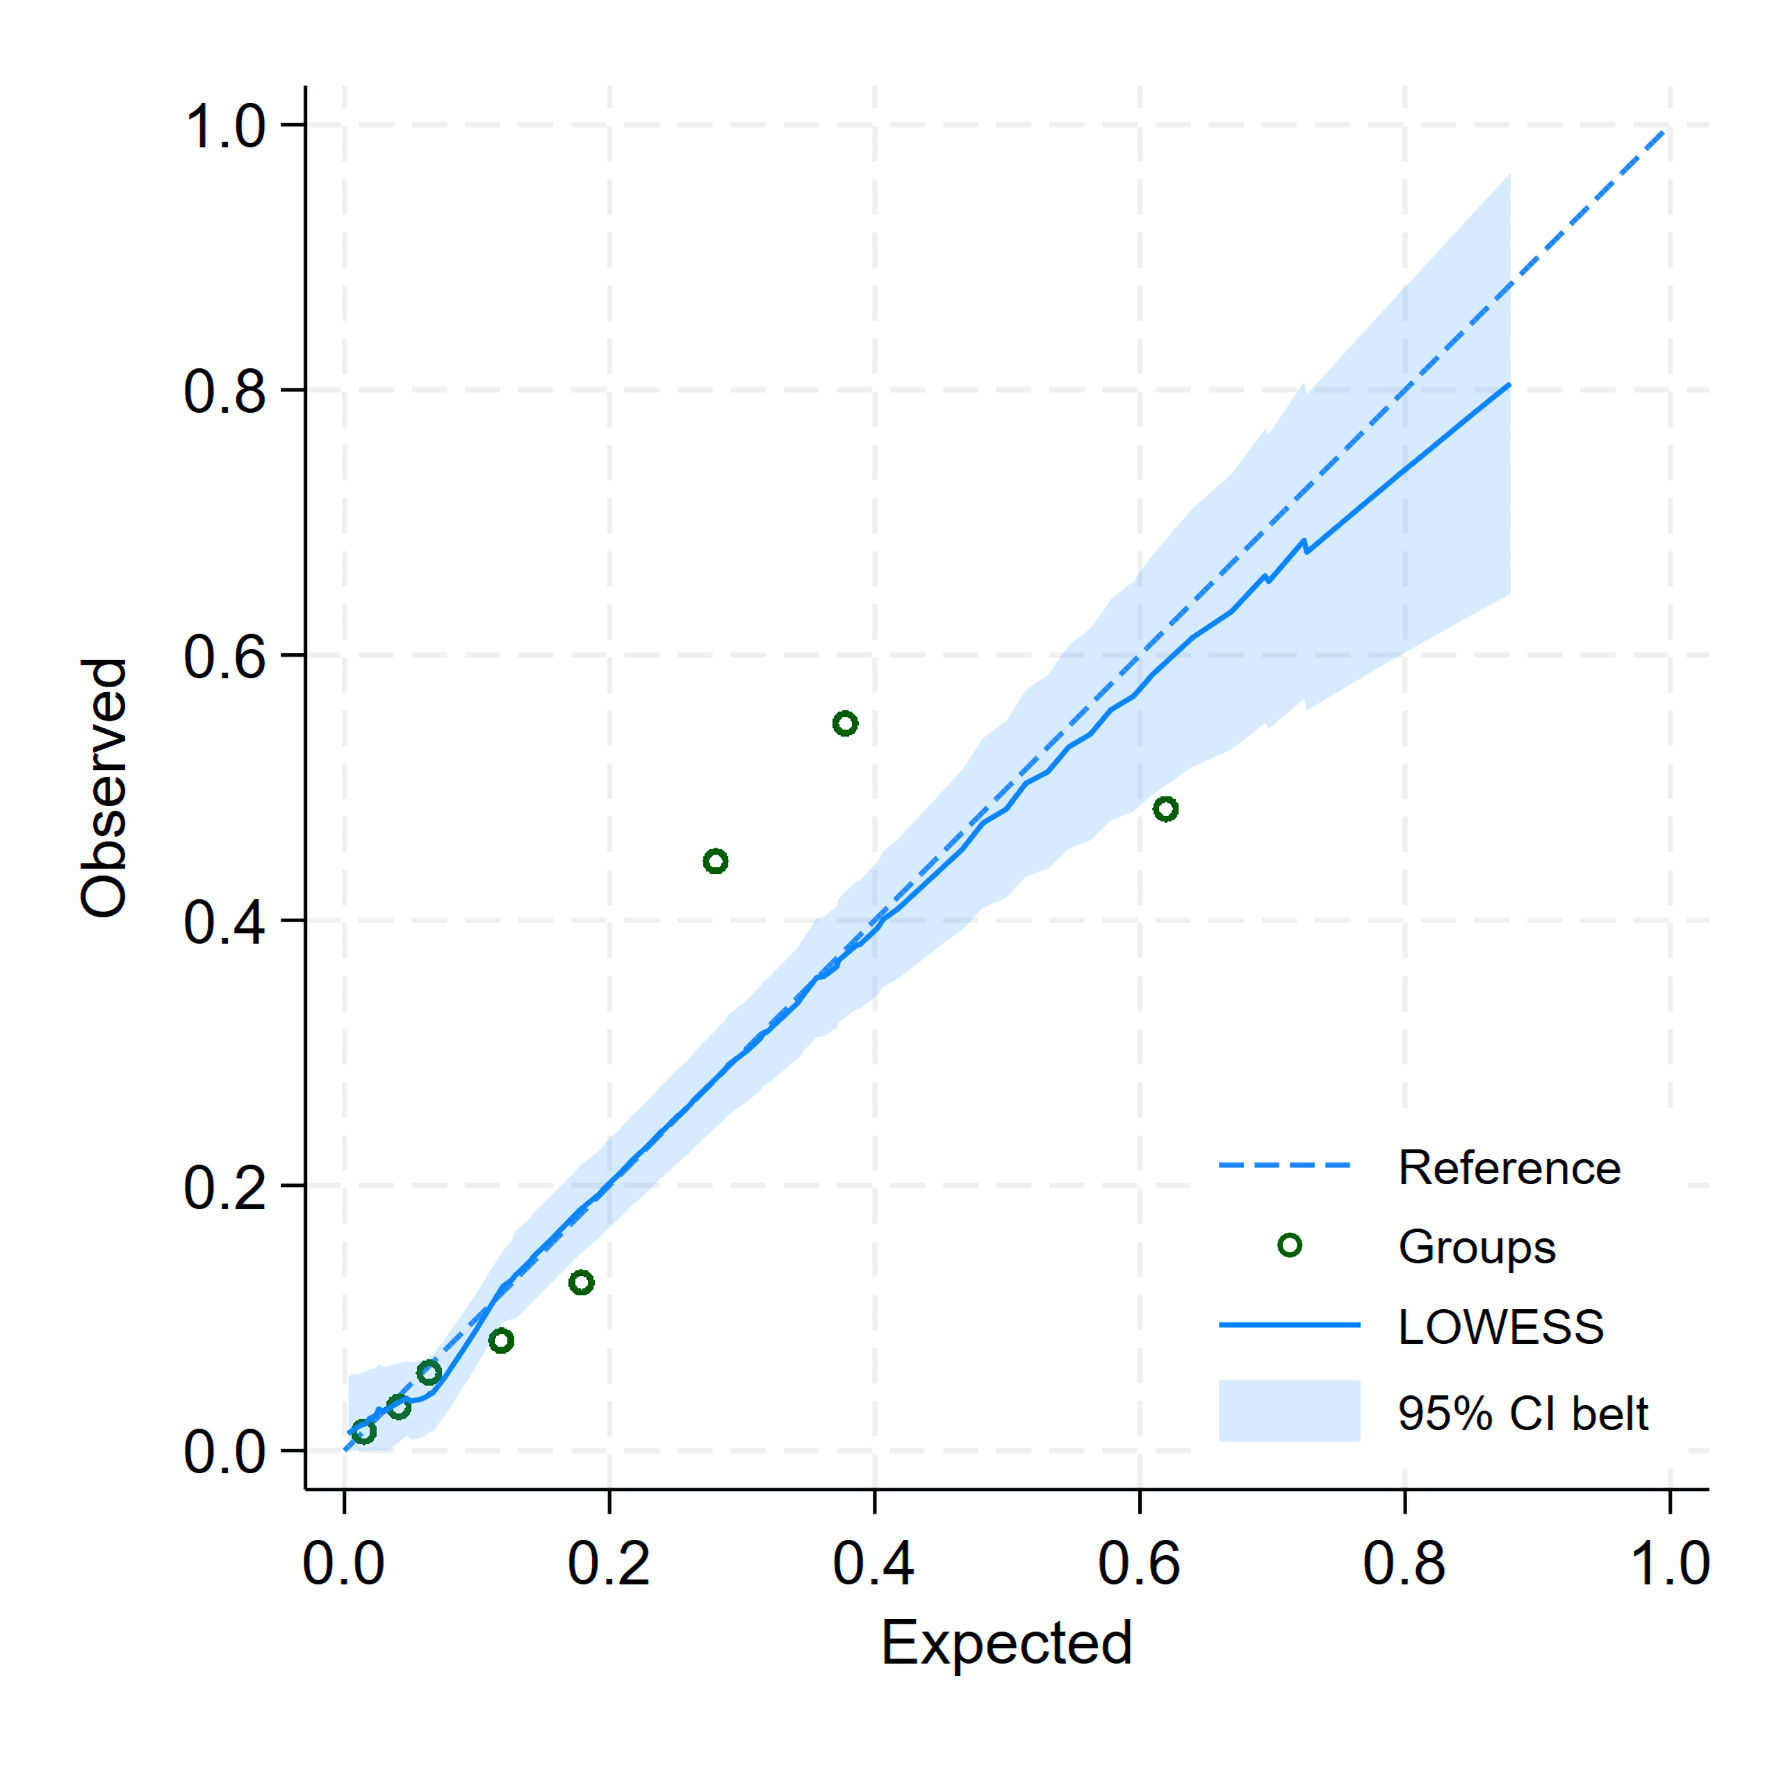
Internal validation using bootstrap resampling yielded a corrected AuROC of 0.8160 (95% CI: 0.7700, 0.8550), with a shrinkage factor of 0.9570, indicating minimal optimism. Calibration assessment showed a slope of 1.0000 (95% CI: 0.7930, 1.2070) and a CITL of -0.0000 (95% CI: -0.2260, 0.2260), suggesting good agreement between predicted and observed probabilities. After bootstrap correction, the slope was 0.9570 (95% CI: 0.7440, 1.1960), CITL -0.0020 (95% CI: -0.2300, 0.2370), and the E:O ratio increased slightly from 1.0000 to 1.0160. This updated version, referred to as the SeizCT optimized model (Fig. 3, Table 3), was developed using the following equation:
 Click for large image |
Figure 3. Calibration plot for predicted and observed probabilities of the SeizCT optimized model. |
Click to view |
Table 3. Internal Validation of the Predictive
Model Using the Bootstrap Resampling Method |
where X1 represents GCS change from baseline, X2 indicates focal neurological deficit, X3 indicates current cancer, X4 indicates alcohol withdrawal symptoms, X5 indicates epilepsy, and X6 indicates prior stroke.
The clinical usefulness of the SeizCT optimized model is demonstrated in the DCA graph (Fig. 4), showing consistently high NB compared to the absence of model use, with advantages becoming evident at a prevalence of 10% or greater.
 Click for large image |
Figure 4. Decision curve analysis. |
Cut point threshold selection
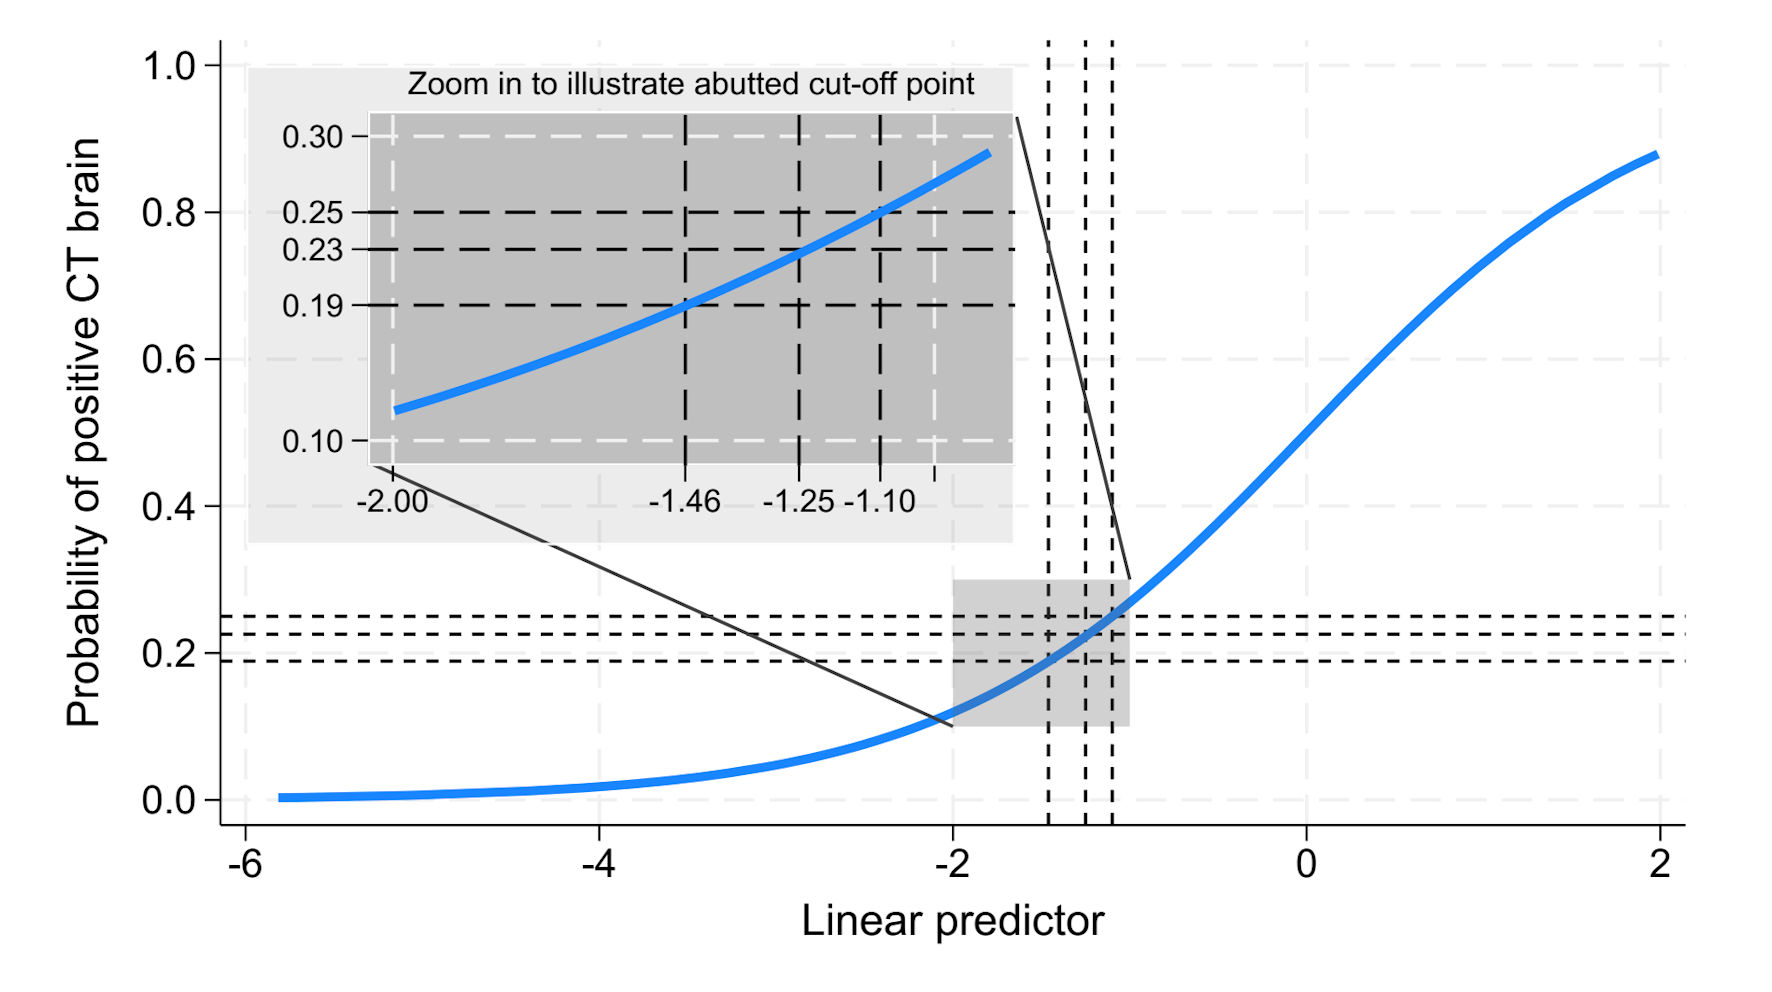
To identify an optimal cut point with a false negative below 5% and a false positive below 15% of the total, we generated a risk curve. The y-axis represented the probability of positive CT findings, while the x-axis showed the linear predictor - that is, the logit (log-odds) output from the SeizCT optimized model, derived from the weighted sum of predictor coefficients. Using this curve, we evaluated trade-offs between false negatives and false positives via the confusion matrix.
The prevalence of positive CT findings in our dataset was 18.9%, corresponding to a linear predictor of -1.46. While this threshold achieved a false negative below 5%, the false positive exceeded 15%. Raising the cut point to a 25% predicted probability (linear predictor -1.10) reduced false positives but pushed the false negative above 5%. We ultimately selected a probability threshold of 22.57% (linear predictor -1.25), which met both criteria: false negative below 5% and false positive below 15% (Table 4, Fig. 5).
Click to view |
Table 4. Confusion Matrices and Diagnostic
Performance of the SeizCT Optimized Model at Different Probability
Thresholds |
 Click for large image |
Figure 5. Predicted probability of positive CT brain findings plotted against the linear predictor. CT: computed tomography. |
| Discussion | ▴Top |
The prevalence of positive CT head scan findings in this study (18.9%) was similar to that reported in a previous study (19.6%, P = 0.788). However, broader comparisons are limited due to the lack of research specifically focused on non-traumatic seizures in the ED. Most existing studies emphasize post-traumatic seizures and their associations with CT findings [23-25], assess seizure-related factors in ED patients - where TBI often emerges as an independent factor [26], or investigate epilepsy subtypes in relation to electroencephalography (EEG) and magnetic resonance imaging (MRI), typically within neurology-focused settings [27]. Even studies conducted in EDs frequently target pediatric populations [28].
Although the updated 2025 NICE guideline [27] provides recommendations for epilepsy diagnosis and chronic care management, it does not offer a structured, probability-based tool for CT imaging decisions in acute, non-traumatic seizure presentations. The guideline is more applicable to outpatient neurologic assessment, often involving MRI and EEG - resources not readily available in ED settings. In contrast, our study proposes a real-time decision-making tool tailored for ED physicians, addressing the gap in guidance for urgent CT head imaging in resource-limited environments.
One relevant emergency-based decision rule is the LIMIT rule, developed to guide neuroimaging after seizures [26]. However, it includes trauma as a core predictor, which was intentionally excluded in our study. Moreover, the LIMIT cohort had less than 5% positive CT findings, compared to 18.9% in our non-traumatic seizure cohort. These differences emphasize the need for a domain-specific tool like the SeizCT optimized model, designed to assist CT decisions in non-traumatic seizure patients during their initial ED evaluation.
Among the limited studies addressing non-traumatic seizures, most are descriptive - either identifying seizure etiologies based on CT findings [3, 7, 8], or examining factors associated with first-episode seizures [29, 30]. Some scoring systems have been proposed, but these are primarily designed to improve yield rather than to guide CT imaging decisions in adult ED practice [30, 31]. These gaps underscore the novelty of the present study and highlight the need for more evidence in real-world adult ED populations with non-traumatic seizures.
The SeizCT optimized model demonstrated an AuROC of 0.8221 (95% CI: 0.7813, 0.8629), comparable to the SeizCT primer model’s AuROC of 0.8156 (95% CI: 0.7586, 0.8727). Although both models exhibited similar discriminative performance, the optimized model yielded a narrower confidence interval. Importantly, incorporating “GCS change from baseline” as a predictor in the optimized model offers greater clinical practicality - particularly for patients with chronic bedridden status, where baseline GCS is often below 15. In such cases, applying the primer model may lead to overprediction of positive CT findings, underscoring the potential advantage of the optimized model if externally validated in this subgroup.
Regarding diagnostic performance, the SeizCT primer model yielded a false negative of 4.4% and a false positive of 16.6% of the total population, exceeding the predefined threshold of 15%. In contrast, the SeizCT optimized model showed a slightly higher false-negative rate of 4.8% (still within the acceptable limit of 5%) and reduced the false positive to 14.4% of the total. This improvement aligns with the study’s objective to minimize unnecessary CT scans.
Among all patients (n = 625), if CT head scans were selectively performed using the SeizCT optimized model with a predicted probability threshold > 22.57%, only 88 patients would undergo imaging. This approach could potentially avoid 537 unnecessary CT scans, resulting in substantial cost savings (approximately 1,879,500 THB (537 × 3,500 THB), equivalent to around $53,700), and minimizing radiation exposure. Such a strategy may be particularly beneficial in resource-limited settings or developing countries, where healthcare costs and access to imaging are critical considerations.
Although the SeizCT optimized model was adapted from parameters established in a previous study, it currently represents only the first phase of the CPM: the derivation phase [32]. As such, its use may assist physicians in decision-making but should not be regarded as a directive instrument. External validation (phase 2) is required to assess its generalizability. A decline in performance is anticipated, including potential reductions in AuROC and changes in false-negative and false-positive proportions, as reflected in the confusion matrix. If performance deteriorates, strategies such as increasing the sample size, re-analyzing the model, or incorporating additional predictive variables may be necessary to improve accuracy. Given the high volume of non-traumatic seizure patients routinely undergoing CT head scans in our setting, the clinical and economic burden is substantial. We are committed to the ongoing refinement of the SeizCT model through iterative plan-do-check-act (PDCA) cycles to ensure its clinical applicability. If the model’s performance remains acceptable, progression to phase 3 - impact assessment - will follow.
Limitations
This study has some limitations. First, a number of patients (n = 38) were excluded due to the absence of a reliable informant to assess their usual level of consciousness, which may introduce exclusion bias. Future studies should consider data imputation methods to minimize this issue. Second, all imaging was performed using non-contrast CT, which is standard practice in the ED due to its rapid availability, lower cost, and favorable safety profile. Although contrast-enhanced CT can improve lesion detection, especially in cases of tumor, infection, or vascular abnormalities, its routine use is limited by concerns about contrast allergy, nephrotoxicity, and added time and cost. MRI offers superior soft tissue resolution and can detect subtle structural or inflammatory lesions; however, it is often less accessible, more expensive, and time-consuming, particularly in resource-limited settings like ours. These factors justify the use of non-contrast CT as the initial imaging modality and should be considered when interpreting the generalizability of the SeizCT optimized model.
Conclusions
Although the SeizCT optimized model showed a similar discriminative performance to the original model, it achieved the predefined thresholds of a false negative below 5% and a false positive under 15%. The use of “GCS change from baseline” enhances its clinical practicality. External validation is crucial to confirm its generalizability across diverse clinical settings.
Acknowledgments
This study was supported by the Lampang Medical Education Center. The authors would like to thank the Emergency Medicine residents, staff, and registered nurses at the Department of Emergency Medicine, Lampang Hospital.
Financial Disclosure
This study was financially supported by the Lampang Medical Education Center.
Conflict of Interest
None to declare.
Informed Consent
Informed consent was waived due to the observational nature of the study.
Author Contributions
Conceptualization: Kreshya Sudsanoh, Thanin Lokeskrawee, Suppachai Lawanaskol, Jayanton Patumanond. Data curation: Kreshya Sudsanoh. Formal analysis: Kreshya Sudsanoh, Natthaphon Pruksathorn, Suwapim Chanlaor, Wanwisa Bumrungpagdee, Chawalit Lakdee, Pimploy Suriyanusorn, Thanin Lokeskrawee, Suppachai Lawanaskol, and Jayanton Patumanond. Methodology and supervision: Thanin Lokeskrawee, Suppachai Lawanaskol, and Jayanton Patumanond. Writing - original draft: Kreshya Sudsanoh, Thanin Lokeskrawee.
Data Availability
Any inquiries regarding supporting data availability of this study should be directed to the corresponding author.
| References | ▴Top |
- Reinus WR, Wippold FJ, 2nd, Erickson KK. Seizure patient selection
for emergency computed tomography. Ann Emerg Med. 1993;22(8):1298-1303.
doi pubmed - Narayanan V, Keniston A, Albert RK. Utility of emergency cranial
computed tomography in patients without trauma. Acad Emerg Med. 2012;19(9):E1055-1060.
doi pubmed - Sever M, Cicek G, Ocak NY, Eyler Y, Toktas R, Toker I, et al. Non-contrast cranial computed tomography can change the emergency management of nontraumatic seizure patients. SV. 2020;16(1):105.
- Burgess M, Mitchell R, Mitra B. Diagnostic testing in nontrauma
patients presenting to the emergency department with recurrent seizures: A systematic review.
Acad Emerg Med. 2022;29(5):649-657.
doi pubmed - Suriyanusorn P, Lokeskrawee T, Patumanond J, Lawanaskol S, Wongyikul
P. Development of clinical prediction model to guide the use of CT head scans for non-traumatic
Thai patient with seizure: A cross-sectional study. PLoS One. 2024;19(7):e0305484.
doi pubmed - Garga N, Lowenstein DH. Posttraumatic epilepsy: a major problem in
desperate need of major advances. Epilepsy Curr. 2006;6(1):1-5.
doi pubmed - Acharya S, Tiwari A, Shrestha A, Sharma R, Shak RP. Computed tomography findings in patients with seizure disorder. J Lumbini Med Coll. 2016;4(1):7.
- Bapu saheb Patil N, Dashrath Wadhwani N. Analysis of CT scans findings in seizures patients: An observational study. AJMRR. 2019;7(2):4-6.
- Zarmehri B, Teimouri A, Ebrahimipour N, Foroughian M, Talebzadeh V,
Saeidi M, Alirezaei M. Brain CT findings in patients with first-onset seizure visiting the
emergency department in Mashhad, Iran. Open Access Emerg Med. 2020;12:159-162.
doi pubmed - Raciti L, Corallo F, Manuli A, Calabro RS. Nursing, caregiving and
psychological support in chronic disorders of consciousness: a scoping review. Acta Biomed.
2021;92(S2):e2021013.
doi pubmed - Wilkinson AN. Cancer diagnosis in primary care: Six steps to reducing
the diagnostic interval. Can Fam Physician. 2021;67(4):265-268.
doi pubmed - AAPC: American Academy of Professional Coders [Internet]. Salt Lake City: AAPC; 2017. Clear up confusion as to when cancer becomes “History Of” [updated Nov 1, 2017; cited Dec 11, 2024]. Available from: https://www.aapc.com/blog/40016-clear-up-confusion-as-to-when-cancer-becomes-history-of/.
- Premera Blue Cross Blue Shield of Alaska [Internet]. Washington: Premera Blue Cross; 2022. Cancer: Active vs. Historical [cited Dec 11, 2024]. Available from: https://www.premera.com/documents/047551.pdf.
- Day E, Daly C. Clinical management of the alcohol withdrawal
syndrome. Addiction. 2022;117(3):804-814.
doi pubmed - Lalitanantpong D. Alcohol withdrawal: Syndrome and treatment. Chulalongkorn Med J. 2010;54(1):67-79.
- Fisher RS, Acevedo C, Arzimanoglou A, Bogacz A, Cross JH, Elger CE,
Engel J, Jr., et al. ILAE official report: a practical clinical definition of epilepsy.
Epilepsia. 2014;55(4):475-482.
doi pubmed - Powers WJ, Rabinstein AA, Ackerson T, Adeoye OM, Bambakidis NC,
Becker K, Biller J, et al. Guidelines for the early management of patients with acute ischemic
stroke: 2019 update to the 2018 guidelines for the early management of acute ischemic stroke: a
guideline for healthcare professionals from the American Heart Association/American Stroke
Association. Stroke. 2019;50(12):e344-e418.
doi pubmed - Riley RD, Snell KI, Ensor J, Burke DL, Harrell FE, Jr., Moons KG,
Collins GS. Minimum sample size for developing a multivariable prediction model: PART II -
binary and time-to-event outcomes. Stat Med. 2019;38(7):1276-1296.
doi pubmed - Mandrekar JN. Receiver operating characteristic curve in diagnostic
test assessment. J Thorac Oncol. 2010;5(9):1315-1316.
doi pubmed - Vickers AJ, Elkin EB. Decision curve analysis: a novel method for
evaluating prediction models. Med Decis Making. 2006;26(6):565-574.
doi pubmed - Vickers AJ, van Calster B, Steyerberg EW. A simple, step-by-step
guide to interpreting decision curve analysis. Diagn Progn Res. 2019;3:18.
doi pubmed - Collins GS, Reitsma JB, Altman DG, Moons KG. Transparent reporting of
a multivariable prediction model for individual prognosis or diagnosis (TRIPOD): the TRIPOD
statement. BMJ. 2015;350:g7594.
doi pubmed - Parmontree P, Tunthanathip T, Doungngern T, Rojpitbulstit M, Kulviwat
W, Ratanalert S. Predictive risk factors for early seizures in traumatic brain injury.
J Neurosci Rural Pract. 2019;10(4):582-587.
doi pubmed - Fordington S, Manford M. A review of seizures and epilepsy following
traumatic brain injury. J Neurol. 2020;267(10):3105-3111.
doi pubmed - Zanetto L, Da Dalt L, Daverio M, Dunning J, Frigo AC, Nigrovic LE,
Bressan S. Systematic review and meta-analysis found significant risk of brain injury and
neurosurgery in alert children after a post-traumatic seizure. Acta Paediatr.
2019;108(10):1841-1849.
doi pubmed - Isenberg DL, Muller M, Rodrigues L, Reimer H, Finlaw L, Souiarov G,
Loughran S, et al. Validation of a clinical decision instrument for emergent neuroimaging after
a seizure: Let's image malignancy, intracranial hemorrhage, and trauma (LIMIT). Acad Emerg Med.
2021;28(5):562-568.
doi pubmed - NICE: National Institute for Health and Care Excellence [Internet]. London: NICE; 2022. Epilepsies in children, young people and adults [updated Jan 30, 2025]. Available from: https://www.nice.org.uk/guidance/ng217/evidence.
- Maytal J, Krauss JM, Novak G, Nagelberg J, Patel M. The role of brain
computed tomography in evaluating children with new onset of seizures in the emergency
department. Epilepsia. 2000;41(8):950-954.
doi pubmed - Kotisaari K, Virtanen P, Forss N, Strbian D, Scheperjans F. Emergency
computed tomography in patients with first seizure. Seizure. 2017;48:89-93.
doi pubmed - Mabaso SH, Bhana-Nathoo D, Lucas S. An audit of CT brain findings in
adults with new-onset seizures in a resource restricted setting in South Africa.
SA J Radiol. 2022;26(1):2294.
doi pubmed - Bent C, Lee PS, Shen PY, Bang H, Bobinski M. Clinical scoring system
may improve yield of head CT of non-trauma emergency department patients. Emerg Radiol.
2015;22(5):511-516.
doi pubmed - Binuya MAE, Engelhardt EG, Schats W, Schmidt MK, Steyerberg EW.
Methodological guidance for the evaluation and updating of clinical prediction models: a
systematic review. BMC Med Res Methodol. 2022;22(1):316.
doi pubmed
This
article is distributed under the terms of the Creative Commons Attribution Non-Commercial 4.0
International License, which permits unrestricted non-commercial use, distribution, and
reproduction in any medium, provided the original work is properly cited.
Journal
of Clinical Medicine Research is published by Elmer Press Inc.