| Journal of Clinical Medicine Research, ISSN 1918-3003 print, 1918-3011 online, Open Access |
| Article copyright, the authors; Journal compilation copyright, J Clin Med Res and Elmer Press Inc |
| Journal website https://jocmr.elmerjournals.com |
Original Article
Volume 17, Number 12, December 2025, pages 676-687

Machine Learning-Based Model to Classify Emergency Severity Index Levels 1-3 in Febrile Patients With Tachycardia: Thailand Triage Prediction System
Chanitda Wichaa ![]() , Thanin Lokeskraweea,
f
, Thanin Lokeskraweea,
f ![]() , Sagoontee
Inkateb
, Sagoontee
Inkateb ![]() , Natthaphon
Pruksathorna
, Natthaphon
Pruksathorna ![]() , Jarupa Yaowalaornga
, Jarupa Yaowalaornga ![]() , Suppachai
Lawanaskolc
, Suppachai
Lawanaskolc ![]() , Jayanton Patumanondd, Suwapim
Chanlaore
, Jayanton Patumanondd, Suwapim
Chanlaore ![]() , Wanwisa
Bumrungpagdeee
, Wanwisa
Bumrungpagdeee ![]() , Chawalit Lakdeee
, Chawalit Lakdeee ![]()
aDepartment of Emergency Medicine, Lampang Hospital, Lampang 52000,
Thailand
bDepartment of Family Medicine, Faculty of Medicine, Naresuan
University, Phitsanulok 65000, Thailand
cChaiprakarn Hospital, Chiang Mai 50320,
Thailand
dClinical Epidemiology and Clinical Statistics Unit, Faculty of
Medicine, Naresuan University, Phitsanulok 65000, Thailand
eDepartment of
Radiology, Buddhachinaraj Phitsanulok Hospital, Phitsanulok 65000,
Thailand
fCorresponding Author: Thanin Lokeskrawee, Department of Emergency
Medicine, Lampang Hospital, Lampang 52000, Thailand
Manuscript submitted August 28, 2025, accepted December 9, 2025, published online December 24,
2025
Short title: Machine Learning Triage for Febrile Patient
doi:
https://doi.org/10.14740/jocmr6371
| Abstract | ▴Top |
Background: Febrile patients with tachycardia present diverse profiles that complicate triage. Although the Emergency Severity Index (ESI) is widely used in Thailand, inter-rater variability limits consistency. Machine learning (ML) may enhance reliability using routinely collected triage data. The objectives were to develop and evaluate ML models predicting ESI levels 1-3 in febrile tachycardic adults and identify the best model for clinical use.
Methods: This diagnostic prediction study analyzed adults with fever (≥ 37.6 °C) and pulse rate > 100 beats per minute in the triage area of Lampang Hospital, Thailand, during June - August 2024. Patients with complete data were included, whereas referrals and expert-disagreement cases were excluded. Expert-assigned ESI levels were the outcome. Thirteen routinely collected triage variables were evaluated as candidate predictors. The dataset (n = 500) was randomly split 80:20 into development and testing sets. Random forest, extreme gradient boosting (XGBoost), and gradient boosting machine models were developed using five-fold cross-validation with class-weighting for imbalance correction. Performance was assessed using area under the receiver operating characteristic curve (AuROC), calibration, and confusion matrices, with attention to clinically relevant misclassification.
Results: XGBoost demonstrated the best discrimination with AuROC values of 1.00 (confidence interval (CI): 0.99 - 1.00), 0.94 (CI: 0.89 - 0.98), and 0.97 (CI: 0.93 - 1.00) for ESI levels 1-3 in the test set. Calibration showed the lowest Brier scores, and misclassification was minimal, supporting strong predictive consistency across categories.
Conclusions: XGBoost was selected for integration into the Smart ER system as the Thailand Triage Prediction System (TTPS), providing real-time prediction to enhance triage accuracy, support decision-making, and improve workflow.
Keywords: Triage; Patient acuity; Severity of Illness Index; Fever; Tachycardia; Machine learning
| Introduction | ▴Top |
The five-level Emergency Severity Index (ESI) triage system is widely utilized in the United States, with an adoption rate of approximately 70% [1]. Internationally, it has been implemented in countries such as Germany [2], Switzerland [3], Brazil [4], Iran [5], and Thailand [6]. To support national triage education, the Thailand Triage Training Kit (TTTK) was developed by the National Institute for Emergency Medicine (NIEM) in 2016 [7] as an interactive tool for ESI triage training. The kit comprises 150 patient cards representing varying severities, each with clinical details and a barcode encoding the correct triage level. Participants assign triage levels using color-coded sticky notes with barcodes, which are scanned into software for real-time accuracy scoring. Rankings prioritize higher accuracy, with ties resolved by minimizing under-triage errors and then by faster completion times, thereby reinforcing accurate and timely triage decision-making. Although multiple TTTK sessions have been conducted nationwide, inter-rater agreement in ESI classification remains low.
This variability reflects the wide spectrum of patient presentations, including differences in age, comorbidities, mobility status, chief complaints, and vital signs, resulting in an almost infinite range of triage scenarios. Triage assessment becomes particularly challenging in patients presenting with fever and tachycardia. According to the original ESI algorithm (version 5), a pulse rate (PR) exceeding 100 beats per minute (bpm) prompts up-triage to level 2 [8]. However, fever, pain, agitation, or anxiety can also elevate heart rate above this threshold, potentially leading to over-triage. This underscores the need for a more precise approach to distinguish truly high-risk patients from those with transient physiological responses.
Since 2020, rapid advances in artificial intelligence (AI) have transformed many domains, including emergency medicine. Recent studies have examined the use of AI tools such as ChatGPT for triage, showing promising sensitivity and specificity in predicting ESI levels 1 and 2 [9].
To address the limitations of current triage methods for febrile patients with tachycardia, this study aimed to develop a clinical prediction model using routinely available triage variables, apply statistical modeling, and translate the results into a practical application. This approach is expected to improve the accuracy and consistency of ESI level prediction and enhance decision-making in emergency care.
| Materials and Methods | ▴Top |
Study design
This diagnostic prediction study employed a retrospective, cross-sectional design. It was conducted in the triage area of the Emergency Department (ED) at Lampang Hospital, a tertiary regional hospital in Northern Thailand with approximately 670,000 annual visits. Data were extracted from routinely collected electronic medical records (EMRs) between 1 June and 31 August 2024, consecutively included for completeness and representativeness of the target population.
Participant and data collection
Participants
All patients aged ≥ 18 years with complete datasets were eligible. Fever was defined as a body temperature (BT) ≥ 37.6 °C measured by a non-contact infrared thermometer [10], and tachycardia as a PR > 100 bpm [8]. Exclusion criteria included referral from another hospital, expert disagreement, or low-prevalence ESI levels 4-5. Beta-blocker use was not an exclusion criterion and was analyzed as a predictor.
Data preparation
All physiological parameters were obtained at the time of triage, prior to physician assessment, using two identical non-contact infrared thermometers (Avia) and two automated vital-sign monitors that were recalibrated at manufacturer-recommended intervals. BT was measured in degrees Celsius (°C). Blood pressure (BP), including systolic BP (SBP), diastolic BP (DBP), and mean arterial pressure (MAP), was recorded in millimeters of mercury (mm Hg) following American Heart Association (AHA) recommendations for cuff size selection [11]; because body mass index (BMI) was not routinely documented, arm circumference was measured in patients with visibly obese habitus to ensure appropriate cuff sizing. Peripheral capillary oxygen saturation (SpO2) was recorded only when a stable plethysmographic waveform was present and consistent with the PR. The PR (bpm) was taken from the monitor when the palpated rhythm matched the waveform, whereas irregular rhythms were counted manually for 30 s and multiplied by 2. Respiratory rate (RR; breaths per minute) was counted for 15 s and multiplied by 4. Pain was assessed using the Numerical Rating Scale (NRS), with discrepant scores re-evaluated by a second nurse. The Glasgow Coma Scale (GCS) was assessed by trained staff with reinforcement through regular education sessions.
BT, BP, SpO2, and PR were automatically uploaded into the Smart ER system developed by SWITTEK GROUP, an EMR system used in the ED of Lampang Hospital, while manual entries such as GCS and NRS were restricted to predefined plausible ranges to reduce data-entry errors. Data preprocessing was performed in Stata version 18 (StataCorp, College Station, TX, USA; licensed). Implausible values were flagged and cross-checked against the EMR. All measurement and quality-control procedures were applied consistently across all participants.
Endpoints
The triage level was determined using ESI categories 1 to 3. Three well-trained triage nurses, each with over 5 years of experience and certified with a weighted kappa of 0.92, independently evaluated each case in a blinded manner. Scenarios were randomly assigned by the data sender, with a maximum of 10 cases reviewed per day to minimize fatigue and reduce the risk of misclassification. The final classification was determined by a two-out-of-three consensus as the reference standard. Cases without consensus after discussion were excluded from the analysis.
Candidate predictors
All predictors were measured at triage before outcome assessment, with measurement details described in the “Data preparation” section. Demographic variables included sex and age. Vital signs comprised SBP, DBP, MAP, PR, RR, SpO2, and BT. Neurological and pain assessments included GCS and the NRS pain score. Mode of mobility was categorized as ambulatory, wheelchair, or stretcher. Chief complaints were classified using criteria-based dispatch (CBD) codes 1, 4, 5, 7, 11, 12, 16, 17, and 19 [12]. Comorbidities included diabetes mellitus (DM), hypertension (HT), dyslipidemia (DLP), chronic kidney disease (CKD), cardiovascular, respiratory, neurologic, autoimmune, hematologic, and malignant conditions. Current medications included beta-blockers and immunosuppressants.
Study size estimation
The minimum required sample size was estimated using the pmsampsize method proposed by Riley et al [13] for multivariable prediction models with binary outcomes. Assumptions included 13 candidate predictors, an anticipated C-statistic of 0.80, a uniform shrinkage factor of 0.90, and an outcome prevalence of 70% for ESI levels 1-2 vs. 3 (based on a pilot study). This indicated a minimum of 311 patients with ESI levels 1-2 (444 total). To account for up to 10% of cases with inconclusive outcome evaluation, the adjusted target was 346 patients with ESI levels 1-2 and 500 total participants.
Missing data
There were no missing data in this study because all patients were required to have complete information for every parameter before being evaluated by the three experts for final ESI classification. Using cases with incomplete information would have caused uncertainty in the outcome assessment, making it unsuitable to serve as the reference standard.
Machine learning (ML) analysis plan
ML procedures were divided into two phases: phase 1 (model development) using the training set, and phase 2 (model performance evaluation) using the independent testing set.
Phase 1: model development (training set)
Data usage and partitioning
The 500 eligible patients were randomly split into a training set (80%; n = 400) and a testing set (20%; n = 100). All model development procedures, including data preprocessing, imbalance correction, and cross-validation tuning, were performed exclusively within the training set. The distribution of ESI levels in the 400 training cases is presented in the “Results” section.
Handling of predictors
All predictors were obtained from routine EMR data. Continuous variables (e.g., age, SBP, PR, BT) were analyzed in their original units to preserve interpretability, and categorical variables were converted into binary dummy variables. No non-linear transformations or interaction terms were pre-specified.
Model type, rationale, and building steps
Three tree-based ensemble algorithms, random forest (RF), extreme gradient boosting (XGBoost), and gradient boosting machine (GBM), were selected for their ability to model non-linear relationships and handle mixed predictor types. Hyperparameter tuning was performed using grid search with cross-validation within the training set. The optimal configurations were then used to retrain each model on the full training dataset, after which the final models were applied to the testing set for performance evaluation.
Class imbalance
We addressed class imbalance using class weighting, increasing the weight of less frequent ESI levels and reducing the weight of more common levels during model training.
Feature importance
Feature importance scores were generated for RF, XGBoost, and GBM to summarize the relative contribution of each predictor within the trained models. This procedure was used solely to describe model structure and was not considered a measure of model performance.
Heterogeneity in estimates
As the dataset was from a single hospital, no multi-site heterogeneity analyses were required. Performance metrics are reported for the full dataset.
Phase 2: model performance evaluation (testing set)
Model performance was evaluated using the following metrics:
1) discrimination: area under the receiver operating characteristic curve (AuROC) with 95% confidence intervals (CIs) for each ESI level (1-3) using a one-vs-rest framework; 2) overall accuracy: proportion of correctly classified cases across ESI levels; 3) recall (sensitivity), precision (positive predictive value), and F1 score (the harmonic mean of recall and precision) calculated for each ESI level; 4) calibration: agreement between predicted and observed ESI levels based on calibration plots constructed from the independent testing set; 5) confusion matrices: summarizing correct and incorrect classifications across ESI levels; and 6) misclassification penalties: frequency and severity of incorrect predictions, categorized as under-triage by two steps (most severe), under-triage by one step, over-triage by two steps, and over-triage by one step, with the mean penalty score calculated.
Model updating
No recalibration or updating was undertaken, as the study objective was to compare algorithm performance rather than to derive a final clinical tool.
Prediction generation
Predictions were generated using Python version 3.9.7 with the scikit-learn open-source library [14]. For each patient, models produced class probabilities for ESI levels 1-3, with the class of highest probability assigned as the predicted level. The best-performing model was integrated into Smart ER and launched as the Thailand Triage Prediction System (TTPS) for real-world use.
Specific time point of prediction
The model calculated the predicted ESI level immediately after completion of data entry in the triage area using Smart ER.
Fairness
No subgroup fairness analyses (e.g., by age, sex, comorbidities) were conducted; these will be considered in future research.
Model output
The models generated both class probabilities and final classifications for ESI levels 1-3. The “highest probability wins” rule determined the final ESI assignment. No probability thresholds were applied.
Training versus evaluation
The training and evaluation sets were derived from the same hospital and study period, using identical eligibility criteria, predictor definitions, and outcome assessment to ensure comparability. Model development and internal validation were performed on the training set, and final performance was assessed on the held-out test set.
Ethical approval
The Institutional Review Board of Lampang Hospital approved the study protocol (Certificate No. 157/67). The requirement for informed consent was waived because of the observational design, and all procedures adhered to the principles of the Declaration of Helsinki. The study was reported in accordance with the TRIPOD + AI guideline for reporting clinical prediction models using regression or ML methods [15].
Registration
The protocol was registered with the Thai Clinical Trials Registry (TCTR20250827007).
Patient and public involvement
No patients or members of the public were involved in the design, conduct, reporting, or dissemination plans of this research.
| Results | ▴Top |
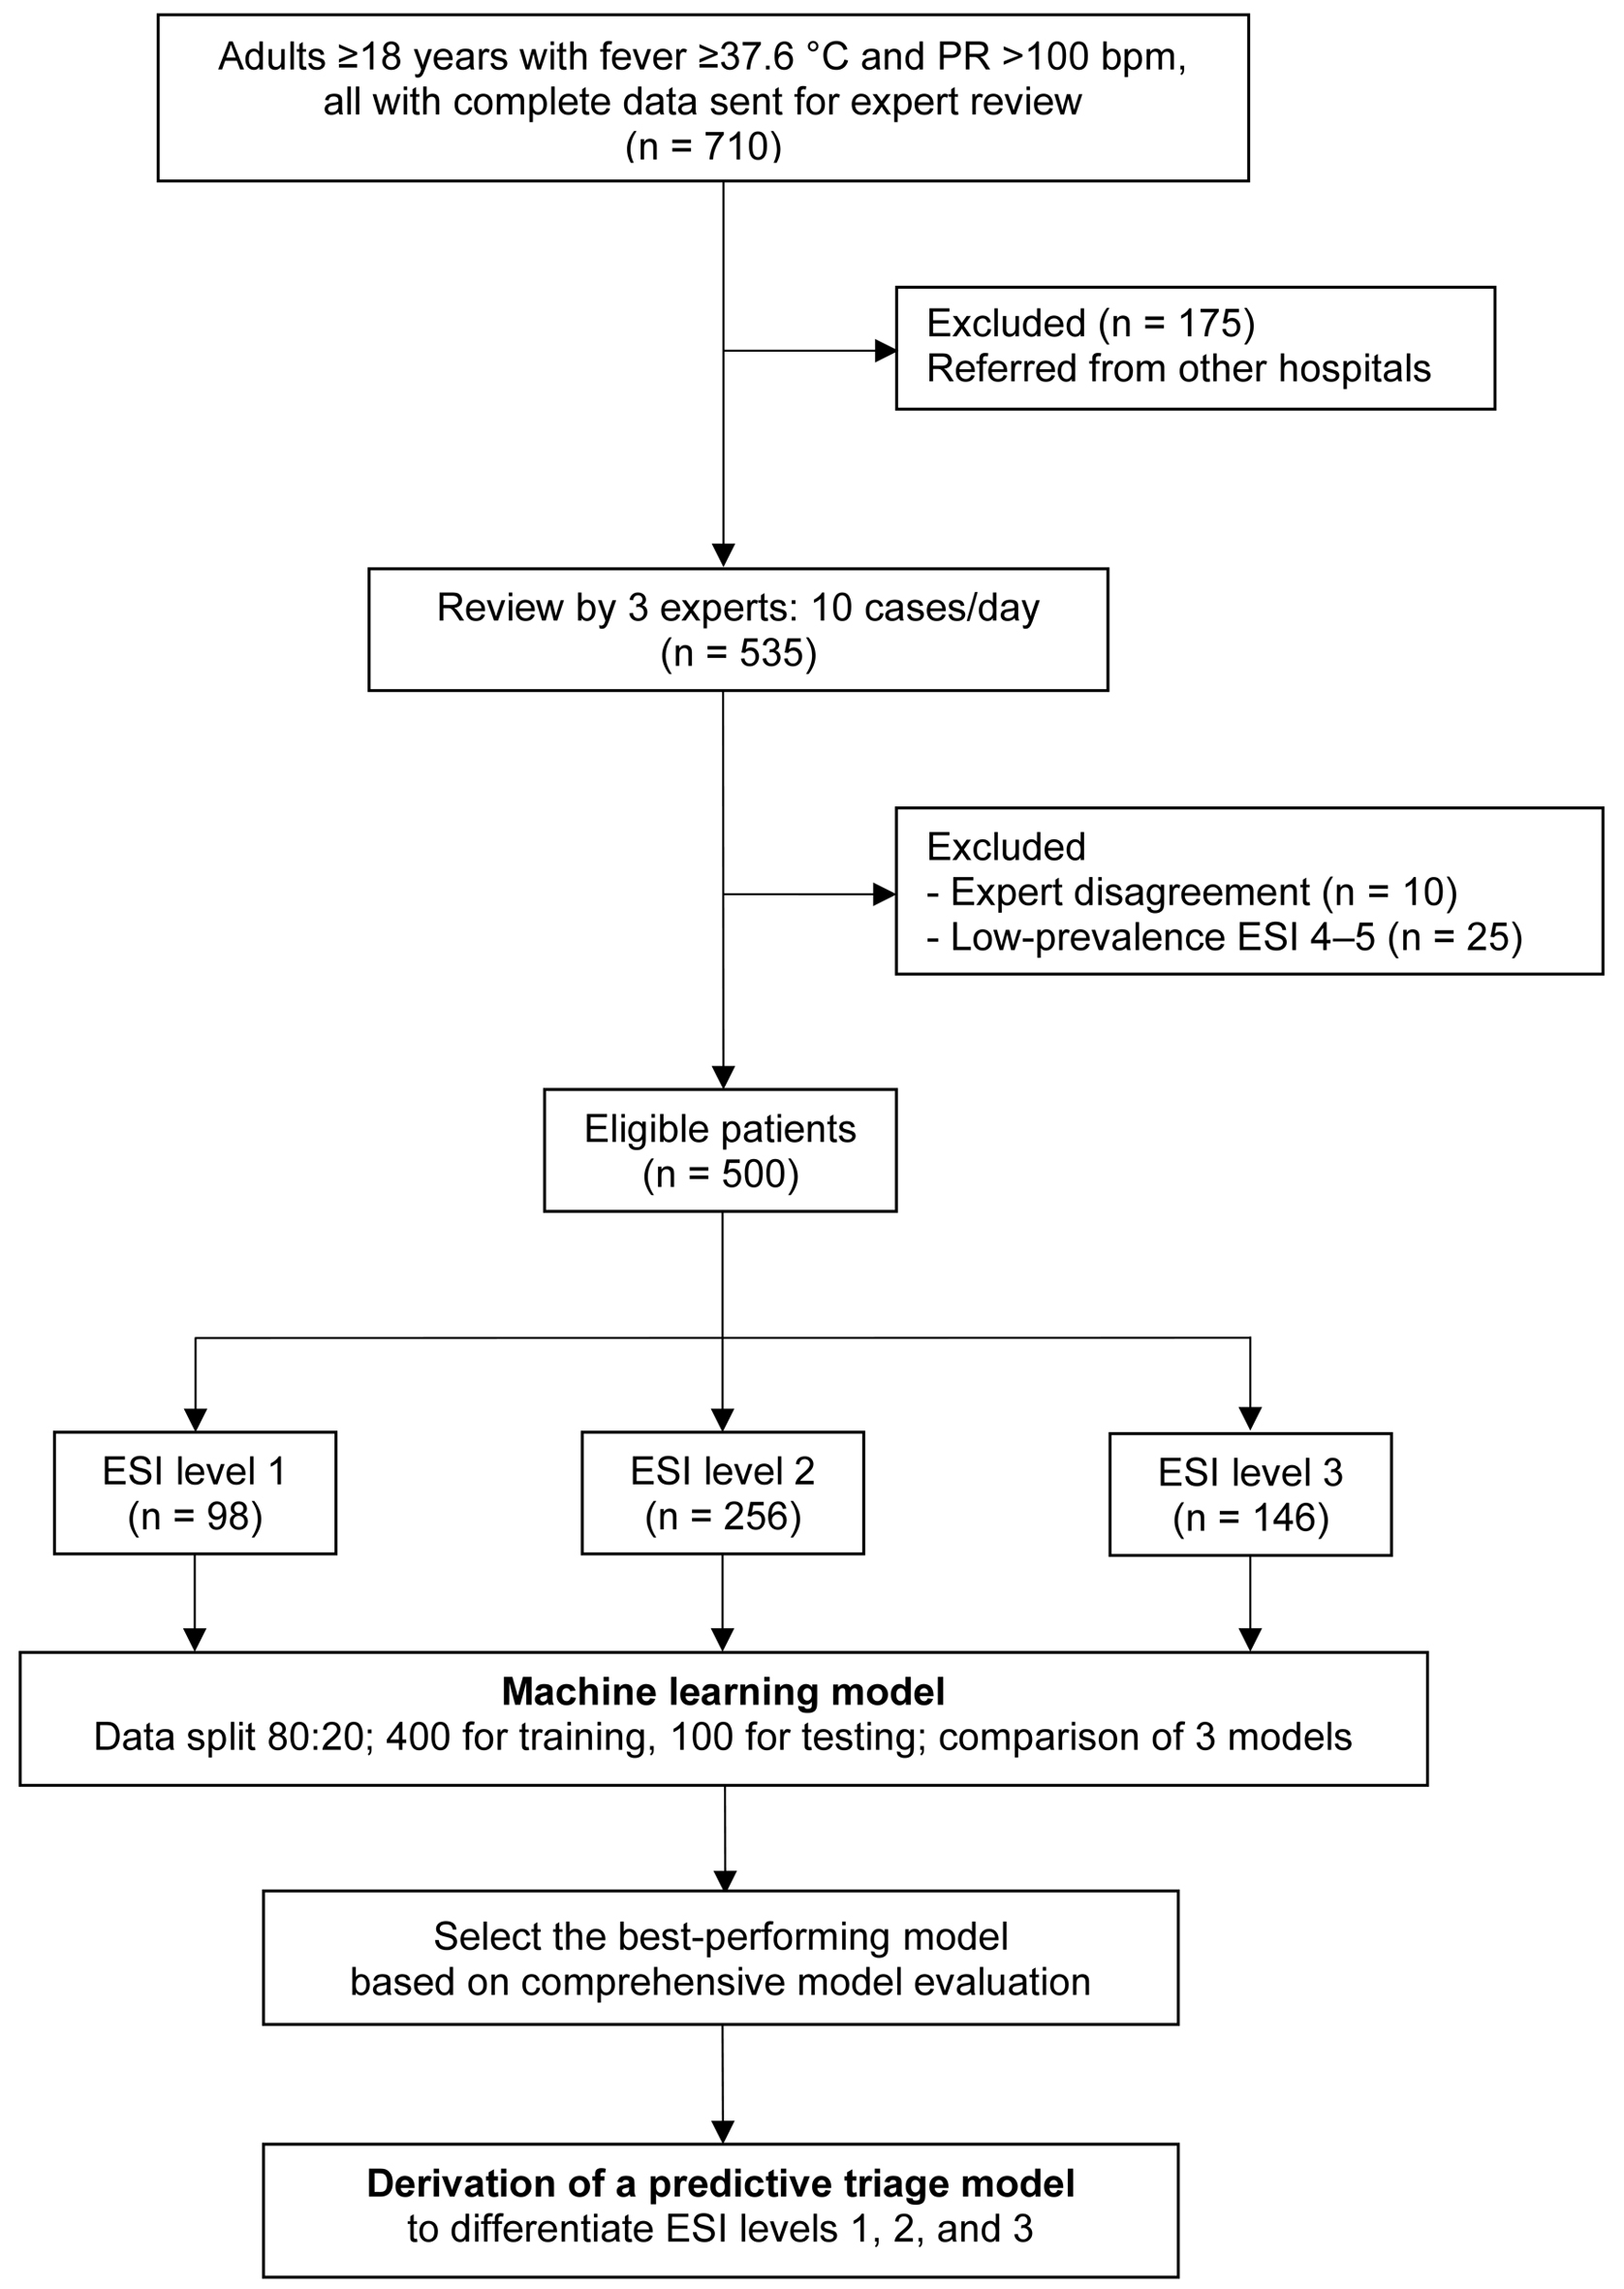
After exclusion, 500 patients were eligible for analysis. Expert consensus classified them as ESI level 1 (n = 98), level 2 (n = 256), and level 3 (n = 146). The dataset was randomly divided into a training set (n = 400) and a testing set (n = 100). Three ML algorithms were developed and compared, with the best-performing model subsequently implemented as the TTPS (Fig. 1).
 Click for large image |
Figure 1. Study flow diagram. bpm: beats per minute; ESI: Emergency Severity Index; PR: pulse rate. |
Patients with ESI level 1 were more frequently male, were the oldest, and had higher PR and RR, along with lower SBP, DBP, MAP, SpO2, and GCS. They more frequently presented with severe chief complaints, such as dyspnea and altered consciousness. Cardiovascular, respiratory, and hematologic conditions were most common in ESI level 1, whereas metabolic syndrome, CKD, neurovascular disease, malignancy, and beta-blocker or immunosuppressant use were uncommon in ESI level 3. Fatigue/poor intake was most frequent in ESI level 2. Minor symptoms, such as cough, headache, dizziness, and musculoskeletal complaints, were most frequent in ESI level 3 (Table 1).
 Click to view |
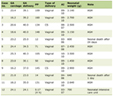
Table 1. Baseline Characteristics of Febrile
Patients With Tachycardia by ESI Levels 1 to 3 |
Model development
A total of 400 patients were included in the training set: ESI level 1 (n = 85), ESI level 2 (n = 199), and ESI level 3 (n = 116). All model development procedures were performed within this dataset. Each algorithm - RF, XGBoost, and GBM - was trained using the predefined predictor set and tuned using grid search with five-fold cross-validation. Class weighting was applied to address imbalance across the three ESI levels. All three tuned models converged without optimization issues and were retained for performance evaluation in the testing set.
Feature importance
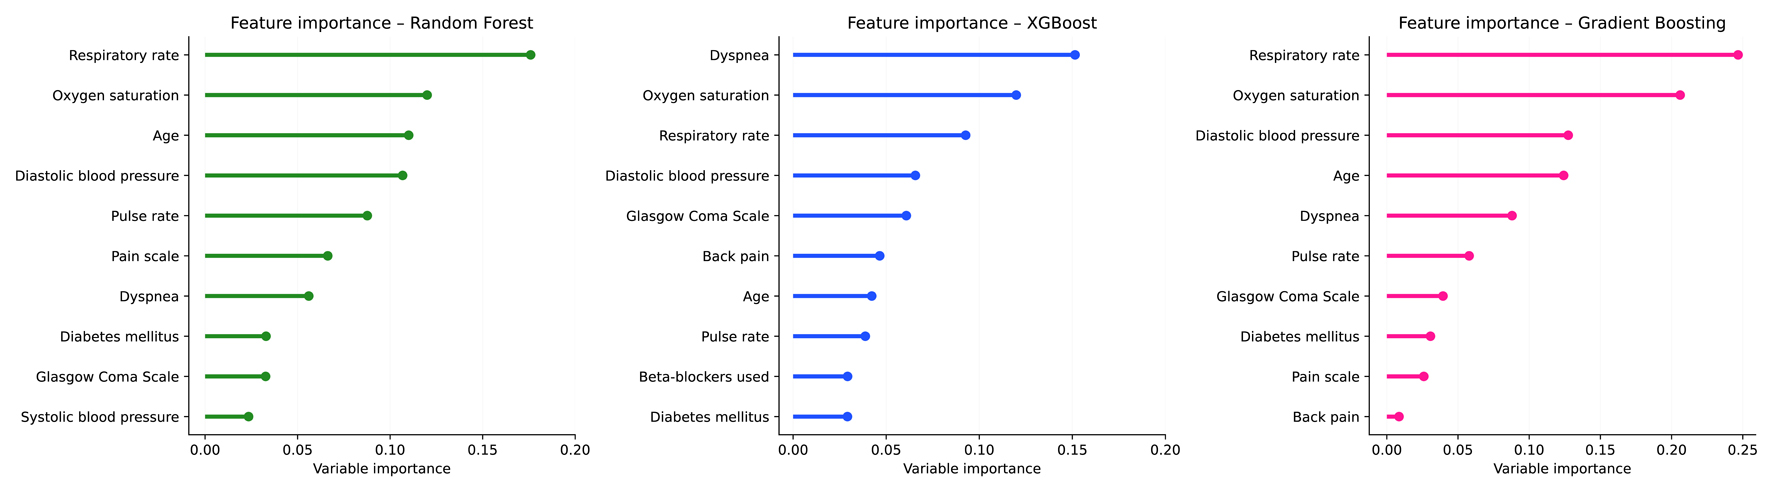
Across the three models, respiratory indicators were consistently among the most influential predictors. XGBoost placed nearly all of its highest importance on these variables - dyspnea, SpO2, and RR. RF and GBM showed a similar pattern, with RR and SpO2 ranked highest, followed by age in RF and DBP in GBM (Fig. 2).
 Click for large image |
Figure 2. Feature importance of machine learning models for predicting Emergency Severity Index (ESI) levels 1 to 3. |
Model performance
Discrimination
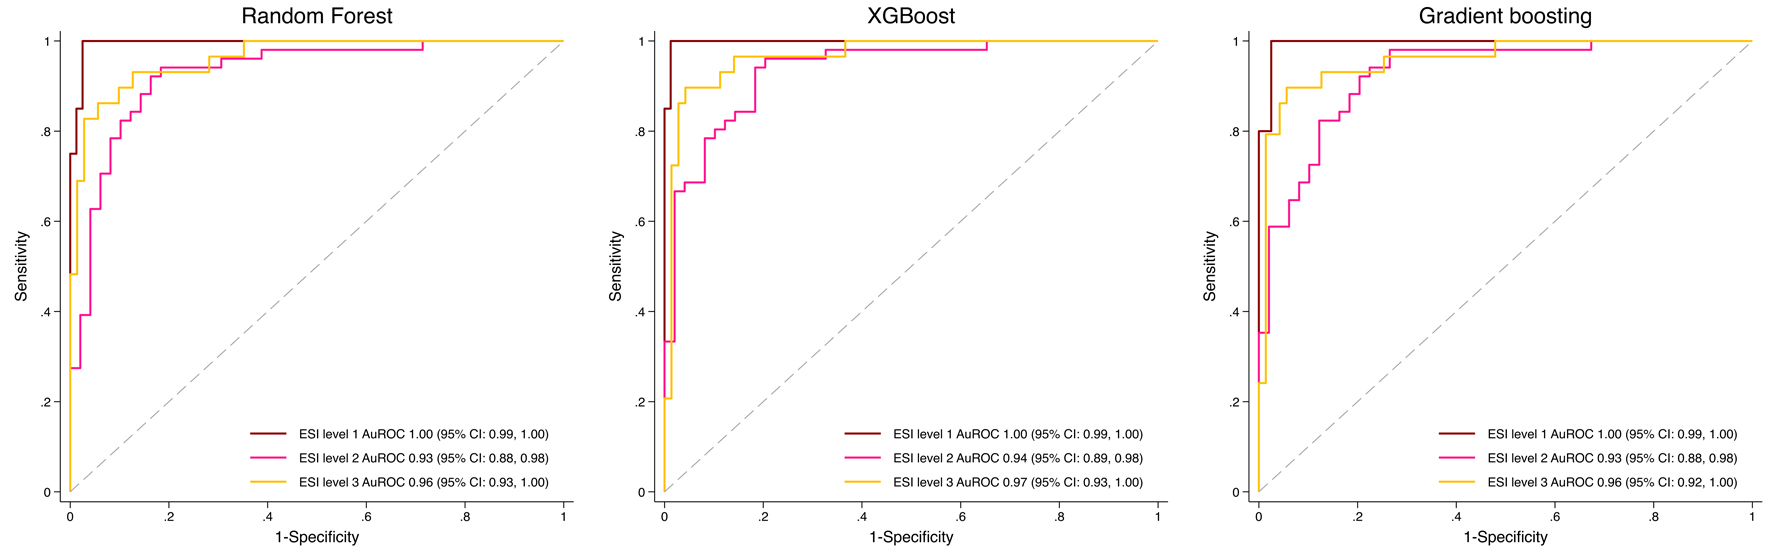
In the independent testing dataset (n = 100; ESI level 1: n = 20, level 2: n = 47, level 3: n = 33), RF achieved an AuROC of 1.00 (95% CI: 0.99 - 1.00), 0.93 (95% CI: 0.88 - 0.98), and 0.96 (95% CI: 0.93 - 1.00) for levels 1-3, respectively. XGBoost achieved 1.00 (95% CI: 0.99 - 1.00), 0.94 (95% CI: 0.89 - 0.98), and 0.97 (95% CI: 0.93 - 1.00), while GBM achieved 1.00 (95% CI: 0.99 - 1.00), 0.93 (95% CI: 0.88 - 0.98), and 0.96 (95% CI: 0.92 - 1.00). Overall, all three models demonstrated excellent and broadly comparable discriminative performance across ESI levels, with only minor numerical differences between algorithms (Fig. 3).
 Click for large image |
Figure 3. Receiver operating characteristic (ROC) curves of machine learning models for predicting Emergency Severity Index (ESI) levels 1 to 3. |
Classification performance metrics
All three ML models showed excellent and comparable performance in ESI level 1. Across ESI levels 2 and 3, each model displayed different strengths. XGBoost demonstrated higher accuracy at ESI level 2 and stronger sensitivity (recall) at ESI level 3, indicating a tendency to detect more true-positive classifications in those settings. RF showed a more balanced profile, with higher recall at ESI level 2 and consistently better F1 scores and precision at ESI level 3, reflecting more stable performance when balancing correct detection and avoidance of false positives. GBM remained close to both models but did not clearly outperform either one, presenting intermediate accuracy, recall, F1 scores, and precision (Table 2).
Click to view |
Table 2. Performance Metrics of Machine
Learning Models for Predicting ESI Levels 1 to 3 |
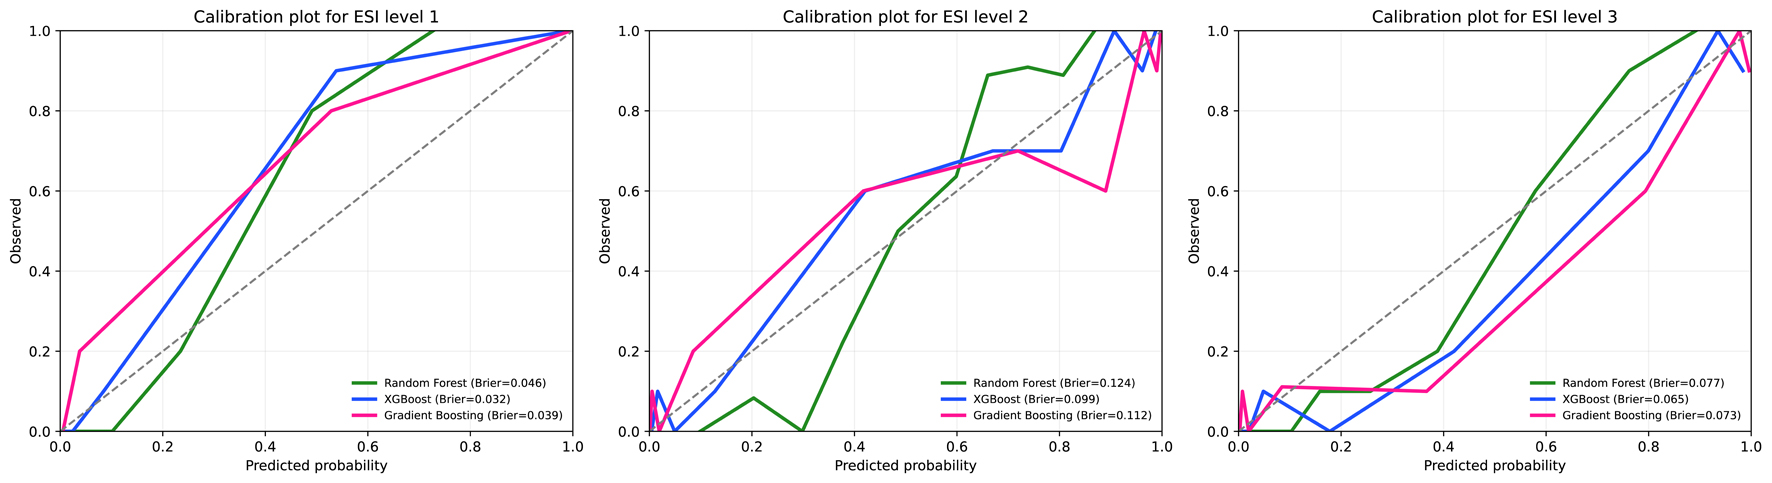
Calibration
In the independent testing set (n = 100), calibration plots for ESI levels 1-3 showed good agreement between predicted and observed probabilities across all models. XGBoost (blue line) demonstrated the most favorable calibration, with the lowest Brier scores for ESI levels 1 (0.032), 2 (0.099), and 3 (0.065). RF and GBM showed slightly higher Brier scores but remained within acceptable calibration ranges (Fig. 4).
 Click for large image |
Figure 4. Calibration plots for machine learning models predicting Emergency Severity Index (ESI) levels 1 to 3 in the test set. |
Confusion matrices
Diagonal cells indicate correct classifications, whereas off-diagonal cells represent under-triage or over-triage events. Across all three models, no under-triage occurred for ESI level 1. under-triage in ESI level 2 was low, at 4% with RF, 3% with XGBoost, and 3% with GBM. Over-triage in ESI level 2 was equal across models at 6%. Over-triage in ESI level 3 was observed at 4% with RF, 6% with XGBoost, and 7% with GBM (Tables 3-5).
Click to view |
Table 3. Confusion Matrix for the Random Forest
Model |
Click to view |
Table 4. Confusion Matrix for the Extreme
Gradient Boosting Model |
Click to view |
Table 5. Confusion Matrix for the Gradient
Boosting Machine Model |
Misclassification patterns and penalty scores
Because the outcome range was limited to ESI levels 1-3, two-step misclassifications were not possible, and all errors occurred within one step. Under-triage by one step was most frequent in RF (4%), whereas XGBoost and GBM showed lower and identical proportions (3%). Over-triage by one step occurred most commonly in GBM (13%), followed by XGBoost (12%) and RF (10%), representing the least severe category of misclassification. Based on the mean penalty scores, where lower values indicate better performance, XGBoost demonstrated the most favorable misclassification profile (Table 6).
Click to view |
Table 6. Predicted Triage Misclassification and
Penalty Scores Across Machine Learning Models |
| Discussion | ▴Top |
Interpretation
Across all ML models, XGBoost assigned the greatest importance to respiratory-related parameters, dyspnea, SpO2, and RR, reinforcing their central role in febrile tachycardic triage, as these indicators often represent early warning signs of physiologic compromise and are closely associated with higher-acuity presentations. When comparing performance profiles, XGBoost showed advantages in metrics linked to identifying true-positive classifications, reflected by its higher accuracy in ESI level 2 and stronger sensitivity in ESI level 3. RF, while also performing well, leaned toward a more balanced output with better precision and F1 stability, especially in ESI level 3, whereas GBM consistently trailed behind both. Importantly, XGBoost also demonstrated the most reliable calibration and produced the lowest misclassification penalty, indicating fewer clinically consequential errors. These combined characteristics - strong predictor focus, competitive accuracy and sensitivity, superior calibration, and a safer misclassification pattern - make XGBoost the most suitable model for advancing into the TTPS application.
Triage-related ML research can generally be divided into two broad approaches: 1) prediction of downstream, straightforward outcomes such as hospital admission, intensive care unit (ICU) admission, length of stay, or mortality; and 2) prediction of the triage level itself. These approaches differ fundamentally in their objectives, reference standards, and methodological challenges.
Most prior studies have followed the first approach. A 2024 systematic review on triage-related ML [16] reported that up to 90% of studies used such downstream outcomes - straightforward variables that are easily accessible from registry data and can be analyzed rapidly with minimal effort. This design allows the use of routinely retrieved, nurse-assigned triage levels as determinants, representing a purpose entirely different from ours.
Conversely, an in-depth review of the cited studies revealed that only six genuinely focused on triage-level modeling, whereas several others were incorrectly classified under this category in the systematic review [16]. Consequently, only about 10% of triage-related ML research truly aimed to develop such models, typically relying on large datasets in which outcomes were extracted from EMRs using routinely assigned triage levels as the reference standard. Although similar large-scale data retrieval is technically feasible in our institution, we deliberately avoided this approach because of potential inter-rater variability, subjective judgment, and uncertainty - particularly when up to 40 triage nurses contribute to case evaluations. This heterogeneity produces unreliable reference outcomes, and the high model performance reported in those studies likely reflects replication of inconsistent rather than accurate labeling. In contrast, the TTPS employed an expert consensus reference, ensuring greater reliability, validity, and trustworthy data for model training, thereby generating more precise predictions. Therefore, a larger dataset does not necessarily equate to better research quality if the reference standard lacks precision. To date, only one published study used an outcome evaluation process comparable to ours [17].
To develop a reliable prediction model for triage levels, it is essential not only to ensure high inter-rater agreement but also to establish robust reference outcomes. In addition, incorporating misclassification patterns is crucial, including two-step under-triage (most severe), one-step under-triage, two-step over-triage, one-step over-triage, and perfect classification (no misclassification). Although this rigorous design is time-consuming and demands substantial effort from the research team, before automatically retrieved routine outcomes from EMRs can streamline this process in future studies, triage nurses must be trained to achieve at least 90% performance in both inter-rater agreement and real-world accuracy - a benchmark rarely reported in previous research.
Beyond methodological rigor in reference standard development, this study also emphasized transparent and structured reporting throughout the modeling process. It closely adhered to the TRIPOD + AI checklist [15], following a step-by-step framework in which all 27 items were fulfilled. Such systematic adherence enhances reproducibility, interpretability, and comparability with future external validation studies. To our knowledge, no previous triage-related ML research has reported compliance with the TRIPOD + AI checklist as comprehensively as the present study.
Limitations
This study has several limitations. First, its single-center design may restrict generalizability to settings with different populations or triage protocols. Nevertheless, this study represents the earliest internationally published work from Thailand to develop the TTPS, and multicenter external validation is planned to confirm model generalizability.
Second, the study period was limited to June - August 2024, which coincides with the major influenza season in Thailand. National surveillance data indicate two peaks of influenza activity: a major wave during the rainy season (June - August) and a smaller one in winter (October - February) [18]. Although our data correspond to the primary epidemic period, they do not encompass the full annual variability of febrile illnesses. Future studies will therefore include data from all months to evaluate model robustness across different epidemic patterns.
Third, the sample size presented a challenging limitation. Although the study originally targeted 500 participants based on the required number of observations for model development, the dataset was later split into training and testing subsets using an 80:20 split, leaving only 400 cases for model development. Because the calculated sample size of 500 applied specifically to the development phase, a larger dataset should ideally have been collected to maintain the full planned development sample after splitting. This reduced development sample, together with the modest overall sample size, may introduce some risk of model instability. Recent methodological guidance also discourages split-sample validation due to inefficiency and potentially unstable estimates [19, 20].
Fourth, the study included 13 candidate predictors; therefore, the required sample size was back-calculated using the events-per-predictor (EPP) approach. After the inevitable 80:20 split, the development set included 400 patients. With the expected 70% proportion proposed in the study size calculation section, 400 × 0.7 = 280 events were available. Using the minimum threshold of ≥ 7 EPP [21-23], 280/7 = 40, indicating support for approximately 40 parameters. The final model contained 41 sub-parameters, slightly above this threshold. Given the minimal excess (41 vs. 40), the sample size was considered broadly adequate for model development.
Fifth, ESI levels 4 and 5 were excluded from model training due to their very low prevalence (n = 25), which could have caused extreme class imbalance and unstable parameter estimation. The analysis therefore focused on levels 1-3, representing higher-acuity cases where timely identification is most critical. However, this exclusion may limit model generalizability to lower-acuity patients. Future research with larger, more balanced datasets should aim to include all ESI levels to enhance applicability across the full triage spectrum.
In addition, although class imbalance was corrected using proportional weighting in this study, more advanced resampling methods such as the Synthetic Minority Oversampling Technique (SMOTE) [24] may offer superior performance. SMOTE generates synthetic minority instances rather than reweighting existing observations, reducing the risk of model bias and improving representation of under-represented ESI levels. Future research with larger datasets should consider SMOTE or similar methods as a more robust alternative to conventional proportional weighting.
Usability of the model in the context of current care
The algorithm was designed to integrate seamlessly into real-world ED workflows. Embedded within the Smart ER system, it requires minimal user interaction, as most variables, including demographics, vital signs, and chief complaints, are automatically retrieved from existing electronic triage records. Predictions are generated within 1 s after all parameters are entered, allowing real-time clinical application without interrupting triage flow. The interface is intuitive and can be operated by any registered nurse without specialized training. A publicly accessible demonstration version is available [25] to support transparency, reproducibility, and future external evaluation.
Conclusion
The TTPS, developed using an XGBoost algorithm, represents the first internationally published triage prediction model from Thailand. Unlike previous studies that relied on routinely retrieved, nurse-assigned triage levels as reference outcomes, often producing artificially high yet clinically unreliable performance, the TTPS was derived from expert consensus, ensuring a more trustworthy and clinically meaningful reference standard. Fully integrated into the Smart ER system, it provides real-time predictions for febrile and tachycardic patients without increasing workload. This study establishes a strong methodological foundation for multicenter validation and nationwide implementation to enhance triage accuracy, consistency, and efficiency in emergency care. Future research should conduct external validation across diverse hospital settings to confirm model generalizability and performance stability.
Acknowledgments
The authors would like to express their sincere gratitude to the NIEM, Thailand, for granting the opportunity to develop the TTTK since its inception in 2016 and for their continued support in its advancement. We are grateful to the Emergency Medicine residents, staff, and registered nurses at the Department of Emergency Medicine, Lampang Hospital, for their contributions. Finally, we acknowledge the assistance of ChatGPT (OpenAI) for its support in translating and refining the manuscript into English.
Financial Disclosure
This study was supported by Lampang Medical Education Center.
Conflict of Interest
The authors reported no contents in the article as conflict of interest.
Informed Consent
Informed consent was waived due to the observational nature of the study.
Author Contributions
Conceptualization: Chanitda Wicha, Thanin Lokeskrawee, Sagoontee Inkate, Suppachai Lawanaskol, and Jayanton Patumanond. Data curation: Chanitda Wicha. Formal analysis: Sagoontee Inkate, Chanitda Wicha, Thanin Lokeskrawee, Suppachai Lawanaskol, Jayanton Patumanond, Natthaphon Pruksathorn, Jarupa Yaowalaorng, Suwapim Chanlaor, Wanwisa Bumrungpagdee, and Chawalit Lakdee. Methodology: Sagoontee Inkate, Thanin Lokeskrawee, Suppachai Lawanaskol, and Jayanton Patumanond. Supervision: Sagoontee Inkate, Thanin Lokeskrawee, Suppachai Lawanaskol, and Jayanton Patumanond. Writing - original draft: Chanitda Wicha, Thanin Lokeskrawee, Sagoontee Inkate, Suppachai Lawanaskol, and Jayanton Patumanond.
Data Availability
Any inquiries regarding supporting data availability of this study should be directed to the corresponding author.
Abbreviations
AHA: American Heart Association; AI: artificial intelligence; AuROC: area under the receiver operating characteristic curve; BMI: body mass index; BP: blood pressure; BT: body temperature; CBD: criteria-based dispatch; CI: confidence interval; CKD: chronic kidney disease; DBP: diastolic blood pressure; DLP: dyslipidemia; DM: diabetes mellitus; ED: emergency department; EMR: electronic medical record; EPP: events per predictor; ESI: Emergency Severity Index; GBM: gradient boosting machine; GCS: Glasgow Coma Scale; HT: hypertension; IQR: interquartile range; MAP: mean arterial pressure; n (%): number (percentage); NIEM: National Institute for Emergency Medicine; NRS: Numerical Rating Scale; PR: pulse rate; RF: random forest; RR: respiratory rate; SBP: systolic blood pressure; SD: standard deviation; SpO2: peripheral capillary oxygen saturation; TCTR: Thai Clinical Trials Registry; TTTK: Thailand Triage Training Kit; TTPS: Thailand Triage Prediction System; TRIPOD-AI: Transparent Reporting of a Multivariable Prediction Model for Individual Prognosis or Diagnosis - Artificial Intelligence Extension
| References | ▴Top |
- McHugh M, Tanabe P, McClelland M, Khare RK. More patients are triaged
using the Emergency Severity Index than any other triage acuity system in the United States.
Acad Emerg Med. 2012;19(1):106-109.
doi pubmed - Volk S, Koedel U, Horster S, Bayer A, D'Haese JG, Pfister HW, Klein
M. Patient disposition using the Emergency Severity Index: a retrospective observational study
at an interdisciplinary emergency department. BMJ Open. 2022;12(5):e057684.
doi pubmed - Grosgurin O, Gayet-Ageron A, Suppan L, Simon J, Villar A, Trombert V,
Marti C, et al. Reliability and performance of the Swiss Emergency Triage Scale used by
paramedics. Eur J Emerg Med. 2019;26(3):188-193.
doi pubmed - Silva JAD, Emi AS, Leao ER, Lopes M, Okuno MFP, Batista REA.
Emergency Severity Index: accuracy in risk classification. Einstein (Sao Paulo).
2017;15(4):421-427.
doi pubmed - Ganjali R, Golmakani R, Ebrahimi M, Eslami S, Bolvardi E. Accuracy of
the emergency department triage system using the emergency severity index for predicting patient
outcome; A single center experience. Bull Emerg Trauma. 2020;8(2):115-120.
doi pubmed - Yuksen C, Sawatmongkornkul S, Suttabuth S, Sawanyawisuth K, Sittichanbuncha Y. Emergency severity index compared with 4-level triage at the emergency department of Ramathibodi University Hospital. Asian Biomed. 2017;10(2):155-161.
- National Institute for Emergency Medicine. The first Thailand Triage Training Kit (TTTK) conference [Facebook]. 2016 [cited Aug 8, 2025]. Available from: https://www.facebook.com/watch/live/?mibextid=wwXIfr&ref=watch_permalink&v=1175245342514613&rdid=9ShpX5fC8T7L6XUW.
- Emergency Nurses Association. Emergency Severity Index (ESI): a triage tool for emergency department care. 5th ed. Schaumburg (IL): Emergency Nurses Association; 2023.
- Miles J, Turner J, Jacques R, Williams J, Mason S. Using
machine-learning risk prediction models to triage the acuity of undifferentiated patients
entering the emergency care system: a systematic review. Diagn Progn Res. 2020;4:16.
doi pubmed - Van den Bruel A, Verbakel J, Wang K, Fleming S, Holtman G, Glogowska
M, Morris E, et al. Non-contact infrared thermometers compared with current approaches in
primary care for children aged 5 years and under: a method comparison study. Health Technol
Assess. 2020;24(53):1-28.
doi pubmed - American Heart Association, American Medical Association. Selecting a cuff size - Target: BP [Internet]. Dallas (TX): AHA; 2025 [cited 2025 Aug 9]. Available from: https://targetbp.org/patient-measured-bp/implementing/smbp-selecting-the-right-cuff-size/.
- National Institute for Emergency Medicine. Emergency medical triage protocol and criteria based dispatch. Nonthaburi: National Institute for Emergency Medicine; 2013.
- Riley RD, Ensor J, Snell KIE, Harrell FE, Jr., Martin GP, Reitsma JB,
Moons KGM, et al. Calculating the sample size required for developing a clinical prediction
model. BMJ. 2020;368:m441.
doi pubmed - Tanaka T. [[Fundamentals] 5. Python+scikit-learn for machine learning
in medical imaging]. Nihon Hoshasen Gijutsu Gakkai Zasshi. 2023;79(10):1189-1193.
doi pubmed - Collins GS, Moons KGM, Dhiman P, Riley RD, Beam AL, Van Calster B,
Ghassemi M, et al. TRIPOD+AI statement: updated guidance for reporting clinical prediction
models that use regression or machine learning methods. BMJ. 2024;385:e078378.
doi pubmed - Porto BM. Improving triage performance in emergency departments using
machine learning and natural language processing: a systematic review. BMC Emerg Med.
2024;24(1):219.
doi pubmed - Zmiri D, Shahar Y, Taieb-Maimon M. Classification of patients by
severity grades during triage in the emergency department using data mining methods.
J Eval Clin Pract. 2012;18(2):378-388.
doi pubmed - Prasert K, Patumanond J, Praphasiri P, Siriluk S, Ditsungnoen D,
Chittaganpich M, Dawood FS, et al. Effectiveness of trivalent inactivated influenza vaccine
among community-dwelling older adults in Thailand: A two-year prospective cohort study. Vaccine.
2019;37(6):783-791.
doi pubmed - Xu Y, Goodacre R. On Splitting Training and Validation Set: A
Comparative Study of Cross-validation, bootstrap and systematic sampling for estimating the
generalization performance of supervised learning. J Anal Test.
2018;2(3):249-262.
doi pubmed - Steyerberg EW, Harrell FE, Jr. Prediction models need appropriate
internal, internal-external, and external validation. J Clin Epidemiol.
2016;69:245-247.
doi pubmed - Peduzzi P, Concato J, Kemper E, Holford TR, Feinstein AR. A
simulation study of the number of events per variable in logistic regression analysis.
J Clin Epidemiol. 1996;49(12):1373-1379.
doi pubmed - Austin PC, Steyerberg EW. Events per variable (EPV) and the relative
performance of different strategies for estimating the out-of-sample validity of logistic
regression models. Stat Methods Med Res. 2017;26(2):796-808.
doi pubmed - Vittinghoff E, McCulloch CE. Relaxing the rule of ten events per
variable in logistic and Cox regression. Am J Epidemiol.
2007;165(6):710-718.
doi pubmed - Fernandez A, Garcia S, Herrera F, Chawla NV. SMOTE for learning from imbalanced data: progress and challenges, marking the 15-year anniversary. J Artif Intell Res. 2018;61:863-905.
- https://sagoontee-triage.hf.space/.
This
article is distributed under the terms of the Creative Commons Attribution Non-Commercial 4.0
International License, which permits unrestricted non-commercial use, distribution, and
reproduction in any medium, provided the original work is properly cited.
Journal
of Clinical Medicine Research is published by Elmer Press Inc.