| Journal of Clinical Medicine Research, ISSN 1918-3003 print, 1918-3011 online, Open Access |
| Article copyright, the authors; Journal compilation copyright, J Clin Med Res and Elmer Press Inc |
| Journal website https://jocmr.elmerjournals.com |
Original Article
Volume 18, Number 11, November 2026, pages 850-858

Usefulness of Phase Angle as an Overall Marker of Muscle Health in Older Patients With Type 2 Diabetes
Yukiyoshi Sadaa, Shutaro Uchiyamaa, b, Shohei Miharaa, b, Masakatsu Soneb, Yasushi Tanakaa, c
aDiabetes Center, Yokohama General Hospital, Kanagawa 225-0025, Japan
bMetabolism and Endocrinology, St. Marianna University School of Medicine, Kanagawa 216-8511, Japan
cCorresponding Author: Yasushi Tanaka, Diabetes Center, Yokohama General Hospital, Kanagawa 225-0025, Japan
Manuscript submitted September 3, 2026, accepted October 16, 2026, published online November 9, 2026
Short title: Usefulness of Phase Angle for Muscle Health
doi: https://doi.org/10.14740/jocmr6721
| Abstract | ▴Top |
Background: Sarcopenia is characterized by deterioration of muscle health, loss of muscle mass and strength, and decline of physical performance. Thus, measurement of these markers is needed for the assessment of muscle health. Muscle mass is easily measured by a bioelectrical impedance analysis (BIA) or dual-energy X-ray absorptiometry (DXA), but measurement of muscle strength and physical performance requires trained personnel and specialized settings. Cross-sectional analyses have demonstrated that the phase angle (PhA), which is directly obtained from a BIA, is associated with muscle mass, muscle strength, and the physical function in healthy individuals and patients with type 2 diabetes. However, longitudinal associations between the PhA and these muscle markers have not been fully investigated, and the clinical usefulness of the PhA in patients with type 2 diabetes remains unclear. Therefore, we performed a retrospective longitudinal analysis of changes in PhA, muscle mass and strength, and physical performance over 3 years.
Methods: We analyzed the associations between the PhA and muscle-related parameters in 101 patients with type 2 diabetes without sarcopenia (61 men, 40 women; age at baseline: 60–85 years). We assessed the PhA, appendicular skeletal muscle index (SMI), handgrip strength, leg extension strength, and Short Physical Performance Battery (SPPB) scores at baseline and after 3 years.
Results: We found that PhA, SMI, and muscle strength decreased over the 3-year period. The rate of decline in muscle strength exceeded that of muscle mass, and leg muscle quality (muscle strength/muscle mass) also decreased. PhA was positively correlated with SMI and muscle strength at both time points. Furthermore, in a linkage analysis, a decline in PhA was associated with declines in SMI, muscle strength, and SPPB score.
Conclusion: PhA, muscle mass, and muscle strength decreased for 3 years in older patients with type 2 diabetes. Declines in PhA were associated with declines in muscle mass, muscle strength, and physical performance. These data suggest the usefulness of PhA as an overall marker of muscle health in patients with type 2 diabetes. Larger prospective studies are needed to confirm these findings and further clarify the clinical utility of PhA in this population.
Keywords: Phase angle; Muscle mass; Muscle strength; Type 2 diabetes
| Introduction | ▴Top |
Age-related decline in muscle mass, strength, and physical performance can lead to sarcopenia and frailty, especially in older adults. Skeletal muscle mass begins to decline between 30 and 40 years of age, and approximately 10% of muscle mass may be lost by 50 years of age [1]. Thereafter, the rate of decline accelerates, with leg muscle mass decreasing by 0.7% to 0.8% per year in men and women of 70–80 years of age [2]. Leg muscle strength typically begins to decline by approximately 2% to 4% per year between 50 and 60 years of age, which is approximately threefold greater than the rate of muscle mass decline [3, 4]. In older patients with type 2 diabetes, cross-sectional studies have shown lower leg muscle strength relative to nondiabetic individuals [5, 6]. Furthermore, a 3-year longitudinal study demonstrated that leg (but not arm) muscle strength declined more in patients with type 2 diabetes than in those without diabetes, and that leg muscle quality, defined as muscle strength per unit of muscle mass, declined more rapidly in patients with diabetes than those without diabetes [7].
Although the exact mechanism underlying the accelerated loss of muscle strength and quality in older patients with type 2 diabetes remains unclear, several factors have been implicated. These include the formation of advanced glycation end products (AGEs), increased oxidative stress and inflammation, muscular insulin resistance, chronic hyperglycemia-induced angiopathy, and muscle cell damage, all of which may contribute to accelerated muscle loss and dysfunction [8, 9]. Thus, early assessment of muscle mass and strength, before the development of sarcopenia, is important for implementing preventive measures, especially in older patients with type 2 diabetes. However, longitudinal changes in muscle mass and strength have not been fully investigated in patients with type 2 diabetes.
The bioelectrical impedance analysis (BIA) method is widely used to assess body composition, including body fat and lean body mass, an index of muscle mass. A BIA does not directly measure these components but estimates them based on whole-body impedance, which is defined as the opposition of the body to an alternating current. Impedance (Z) is composed of resistance (R) and reactance (Xc) represented by the following formula: Z2 = R2 + Xc2. Body fat and lean body mass are calculated using these measures in a regression equation derived from a reference method, such as isotope dilution or dual energy X-ray absorptiometry (DXA), which is used to measure body composition in healthy people with no fluid imbalance, body shape abnormalities, or apparent disease [10, 11]. Thus, a BIA can provide reliable information on body composition in healthy people, but it may not be accurate in patients with disease because they may have disturbed intracellular water (ICW) or extracellular water (ECW) levels, abnormal body weight, or other dysfunctions. Consequently, fat index (FI) and skeletal muscle index (SMI) assessed by a BIA in patients with acute or chronic disease, systemic edema, malnutrition, or pathological obesity should be evaluated carefully. R is based on the amount of ICW and ECW, whereas Xc is dependent on cell membrane integrity, particularly in muscle cells [12]. The phase angle (PhA), which is calculated using the arctangent value of the ratio of Xc to R, is derived directly from a BIA without the use of a regression equation. PhA decreases with declining muscle mass due to a reduction in Xc (reflecting impaired muscle cell membrane integrity) and an increase in R (reflecting reduced ICW in muscle tissue) [13]. Although PhA is regarded as a useful marker of muscle mass and function in healthy adults, its relationship with muscle properties and physical performance in patients with type 2 diabetes has not been fully evaluated. In a previous cross-sectional analysis, we measured PhA and muscle mass using a BIA and assessed muscle strength and physical performance; we found that PhA was associated with muscle mass, muscle strength, and physical performance in patients with type 2 diabetes [14]. However, it remains unclear whether longitudinal changes in PhA are associated with changes in muscle mass and function. Therefore, the present study retrospectively evaluated longitudinal changes in PhA, muscle mass and strength, and physical performance over 3 years and analyzed the associations between changes in PhA and changes in these muscle-related parameters in older patients with type 2 diabetes.
| Materials and Methods | ▴Top |
Participants
This retrospective longitudinal study included 101 older Japanese patients (≥ 60 years at baseline) with type 2 diabetes who attended the outpatient clinic at Yokohama General Hospital (Yokohama, Japan). Body composition and PhA were measured using a BIA, and muscle strength and physical performance were assessed by physical therapists at baseline (between April 2021 and September 2022) and approximately 3 years later (between June 2024 and January 2026). The inclusion criteria were age ≥ 60 years and a glycated hemoglobin (HbA1c) level of 5.0% to 7.9%, with < 0.5% variation in HbA1c during 6 months prior to baseline. The exclusion criteria were as follows: (1) sarcopenia diagnosed according to the Asian Working Group for Sarcopenia 2019 criteria [15]; (2) impaired gait and movement of the upper and lower extremities due to neuropathy, neuromuscular disease, cerebrovascular disease, or peripheral arterial disease; (3) presence of metal in the body that could interfere with a BIA (e.g., cardiac pacemaker, metal plate, or metal stent); (4) malignancy, severe renal disease (estimated glomerular filtration rate (eGFR) < 45 mL/min/1.73 m2), or severe liver disease; (5) conditions affecting body water status and PhA measurement (e.g., systemic edema or dehydration); and (6) any other condition deemed unsuitable for the study by the attending physician at baseline or follow-up.
This study was approved by the Ethics Committee of Yokohama General Hospital (No. 202532) and conducted in accordance with the principles of the Declaration of Helsinki. Because this was a non-interventional study, informed consent was obtained using an opt-out approach on the study website.
Assessment of patient characteristics, muscle mass, SMI, and PhA
At outpatient visits, height and body weight were measured, and body mass index (BMI) was calculated. Blood and urine samples were collected after an overnight fast for general laboratory testing, and patient characteristics, including the use of antidiabetic medications, were recorded. BIAs were performed by physiological technologists using a body composition analyzer (MC-780MA-N; Tanita Corp., Tokyo, Japan) in an isolated examination booth. To assess muscle mass, appendicular skeletal muscle mass (ASM; bilateral arms and legs) was used to calculate the SMI as ASM divided by height squared (kg/m2). Similarly, to assess body fat, the FI was defined as total body fat mass divided by height squared (kg/m2). Right- and left-side PhA (Rt-PhA and Lt-PhA) were directly obtained from R and Xc at 50 kHz between the right arm and leg and the left arm and leg, respectively.
Assessment of muscle strength and physical performance
Bilateral handgrip strength and leg extension strength were each measured twice, and the higher value was used for analysis. Physical performance was assessed using the Short Physical Performance Battery (SPPB), which comprises three components: balance (ability to stand for up to 10 s with feet in side-by-side, semi-tandem, and tandem positions), gait speed (time to complete a 4-m walk), and chair stand test (time needed to rise from a chair five times) [14]. Each component is scored from 0 to 4, and the total score ranges from 0 to 12, with higher scores indicating better physical performance. All assessments were performed by physical therapists in the hospital rehabilitation room.
Statistical analysis
Data are expressed as the mean ± standard deviation (SD) unless otherwise noted. Differences in mean values were assessed using Student’s t-test, and changes from baseline to 3 years were assessed using the paired t-test. Differences in mean values of annual rate of changes were assessed using repeated measures analysis of variance (ANOVA) and Tukey’s multiple comparison test. Correlations were assessed using Spearman’s correlation analysis. To examine whether changes in Rt-PhA and Lt-PhA were associated with changes in SMI, ECW/total body water (TBW; ICW + ECW), muscle strength, and SPPB score, linkage analysis was performed using a modified correlation method described previously [16]. Briefly, changes from baseline to follow-up in Rt- or Lt-PhA (Yi at follow-up − Yi at baseline) and in other variables (Xi at follow-up − Xi at baseline) were used to calculate the coefficient of linkage (λ) using the following equations:
Statistical significance was defined as a P value < 0.05. All analyses were performed using SPSS (ver. 21, IBM, Tokyo, Japan).
| Results | ▴Top |
A total of 101 patients with type 2 diabetes (61 men and 40 women) aged 60–85 years at baseline were included. The study population did not include any patients with cognitive dysfunction or dementia. Regarding lifestyle habits, three patients were current smokers, 27 patients were former smokers, and 71 patients were never smokers. For alcohol consumption, 41 patients were drinkers and 60 patients were non-drinkers, respectively. However, information on the consumption of daily smoking and alcohol was not obtained. After considering each patient’s clinical condition, daily routine, physical activity, and comorbidities, the attending physician provided individualized recommendations for exercise and diet at baseline, and all patients adhered to these recommendations over the 3-year follow-up period.
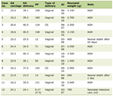
The clinical characteristics of the patients and use of antidiabetic medications at baseline and 3 years (3.15 ± 0.40 years) are shown in Table 1. BMI decreased significantly from baseline to follow-up, whereas HbA1c, eGFR, and serum albumin did not change significantly. The number of patients treated with 2 and ≥ 3 antidiabetic agents were 21 (21%) and 32 (32%), respectively, at baseline and 24 (24%) and 38 (38%), respectively, at 3 years.
 Click to view | Table 1. Clinical Characteristics of the Patients at Baseline and 3 Years |
Body composition, ECW/TBW, PhA, muscle strength, and SPPB scores at baseline and 3 years are shown in Table 2. FI, ECW/TBW, and SPPB scores did not change significantly, whereas SMI, PhA, and hand grip and leg extension strength decreased significantly. As shown in Figure 1, the annual rates of decline in leg extension strength were significantly greater than those of SMI and ipsilateral handgrip strength. The annual rate of decline in leg extension strength was approximately threefold that of handgrip strength.
Click to view | Table 2. Body Composition, Phase Angle, and Muscle Strength of the Participants at Baseline and 3 Years |
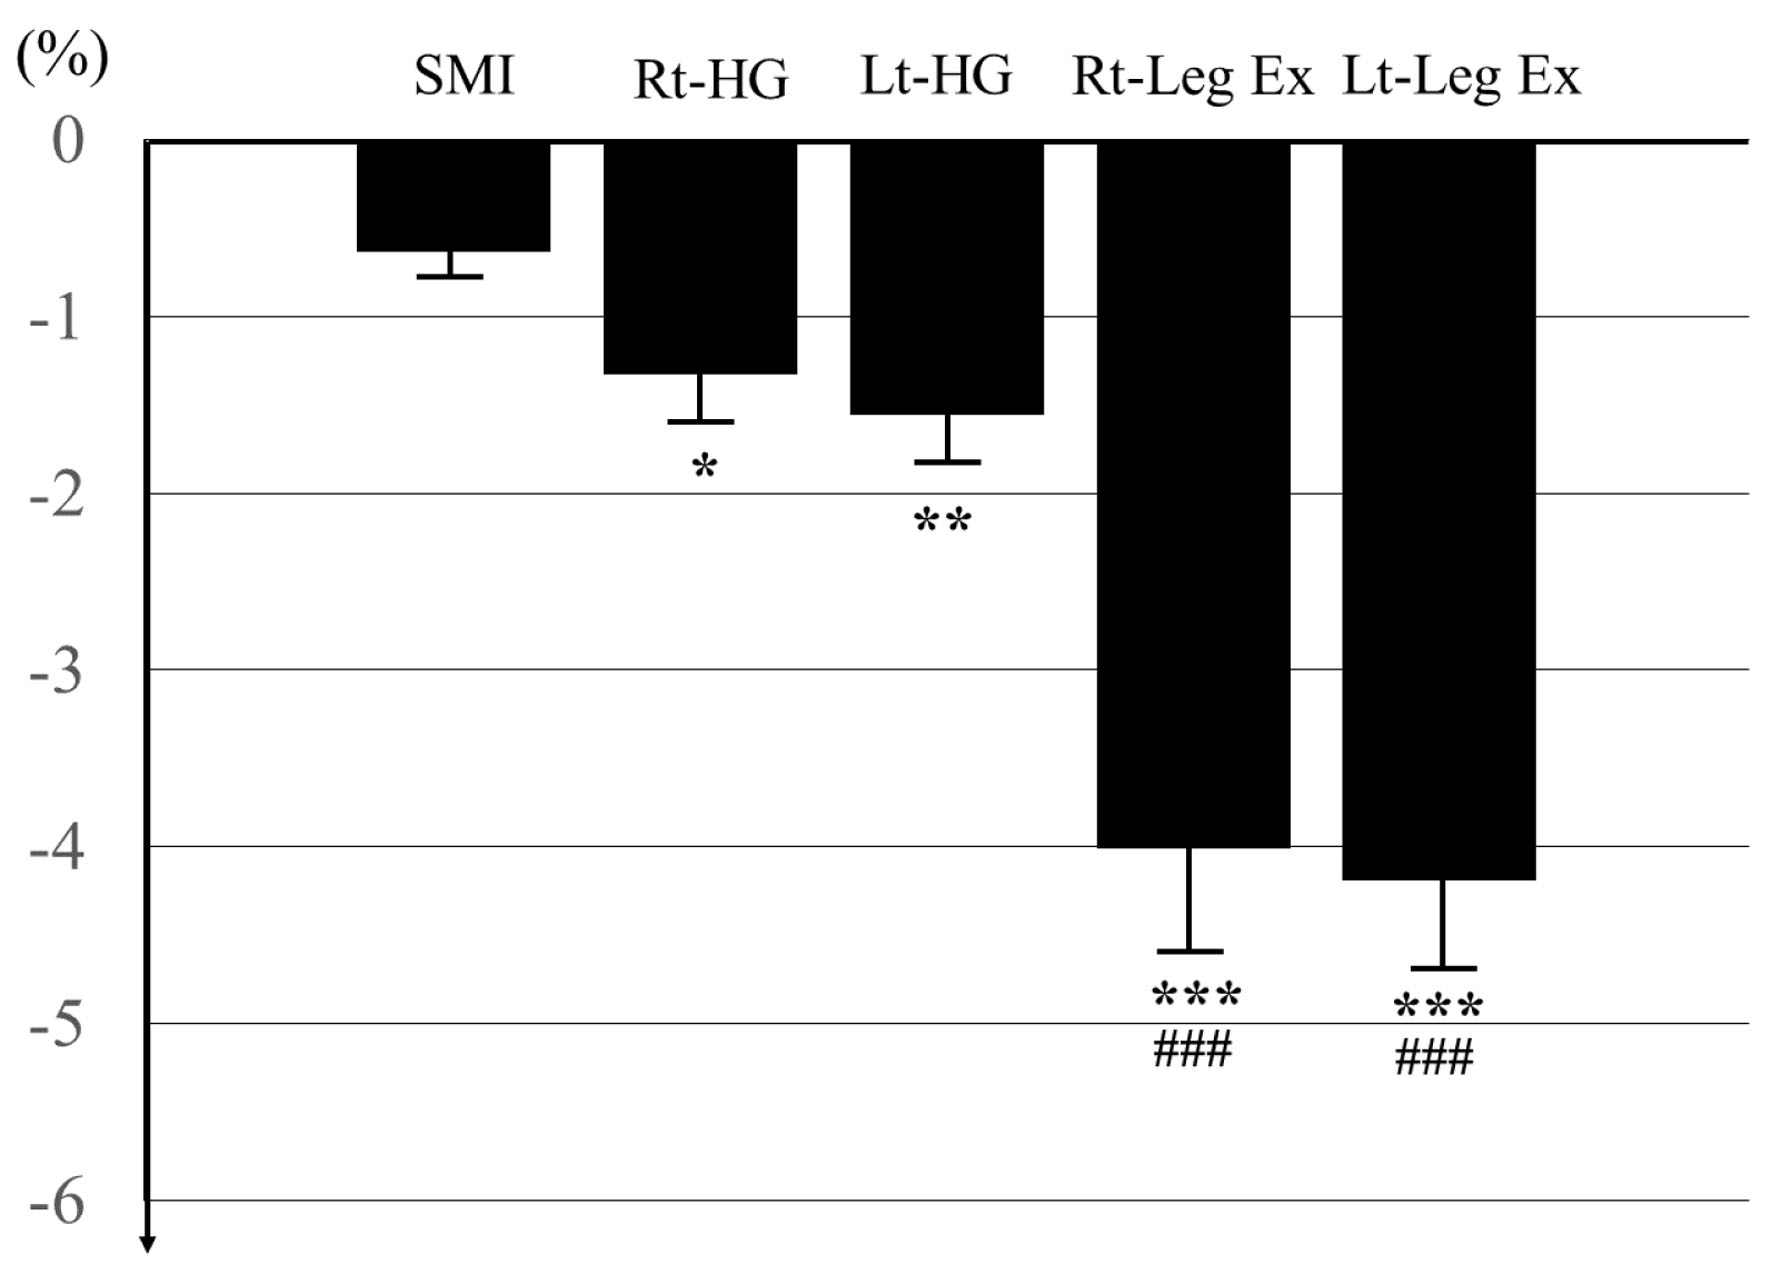 Click for large image | Figure 1. Annual rate of changes in muscle mass and strength. Data are expressed as mean ± SE. *P < 0.05, **P < 0.01, ***P < 0.001 vs. SMI. ###P < 0.001 vs. ipsilateral handgrip strength. SMI: skeletal muscle index; Rt- and Lt-HG: right and left handgrip strength, respectively; Rt- and Lt-Leg Ex: right and left leg extension strength, respectively. |
The results of simple correlation analyses evaluating the associations of Rt- and Lt-PhA with other variables at baseline and 3 years are shown in Tables 3 and 4, respectively. Rt- and Lt-PhA were negatively correlated with ECW/TBW at baseline but not at 3 years. Rt- and Lt-PhA were negatively correlated with age and positively correlated with male sex, SMI, and ipsilateral handgrip strength and leg extension strength at both time points. Rt-PhA, but not Lt-PhA, was negatively correlated with FI at baseline but not at 3 years.
Click to view | Table 3. Simple Correlation Analysis at Baseline |
Click to view | Table 4. Simple Correlation Analysis at 3 Years |
The coefficients of linkage (λ) of each variable with Rt- and Lt-PhA are shown in Table 5. Significant positive associations between 3-year changes in Rt- and Lt-PhA and changes in SMI, ipsilateral hand grip and leg extension strength, and SPPB scores were observed.
Click to view | Table 5. Association of Change in Each Variable of Body Composition and Muscle Strength With Change in Phase Angle From Baseline to 3 Years |
| Discussion | ▴Top |
We conducted a retrospective longitudinal study evaluating PhA, muscle mass and strength, and physical performance over 3 years in older patients with type 2 diabetes and identified four main findings. First, BMI, SMI, handgrip and leg extension strength, and PhA decreased over 3 years, whereas HbA1c, eGFR, serum albumin, FI, ECW/TBW, and SPPB scores did not change. Second, the annual rates of decline in handgrip and leg extension strength were greater than that of SMI, suggesting that muscle strength declines faster than muscle mass. In addition, the rate of decline in leg extension strength was greater than that of handgrip strength. Third, in simple correlation analyses at baseline and 3 years, Rt- and Lt-PhA correlated negatively with age and positively with male sex, SMI, and ipsilateral handgrip and leg extension strength. Fourth, in linkage analyses, changes in Rt- and Lt-PhA were associated with changes in SMI, ipsilateral handgrip and leg extension strength, and SPPB score, suggesting that declines in PhA may reflect not only loss of muscle mass but also declines in muscle strength and physical performance.
As shown in Table 1, HbA1c, eGFR, and serum albumin did not change, suggesting that the patients’ metabolic status remained stable during the study period. As shown in Table 2, SMI decreased, whereas FI did not, indicating that the observed decline in BMI was primarily attributable to loss of muscle mass. Although both SMI and muscle strength (handgrip and leg extension) decreased over 3 years, the rates of decline differed. As shown in Figure 1, the annual rates of decline in muscle strength (right and left handgrip: −1.330±3.563% and −1.561±3.317%, respectively; right and left leg extension: −4.014±6.571% and −4.192±6.530%, respectively) were greater than that of SMI (−0.632±1.453%), and the rate of decline in leg extension strength was greater than that of handgrip strength. These findings are consistent with those of a previous report. Wiegmann et al reported higher annual rates of decline in handgrip strength (−1.5% to −1.7 %) than in SMI (−0.4% to −0.6 %) over 6 years in German adults aged > 70 years [17]. Similarly, Asano et al reported higher annual declines in handgrip strength (−1.4% in men and women) and leg extension strength (−2.0% in men and −2.1% in women) than in SMI (−0.8% in men and −0.6% in women) in community-dwelling Japanese adults > 65 years of age [18]. The faster decline in muscle strength, especially leg extension strength, compared with SMI, suggests that muscle quality (muscle strength per unit of muscle mass) decreases with aging. Consistent with this, we calculated leg muscle quality (leg extension strength (kg)/leg lean mass (kg) in right and left leg) and found significant declines from baseline to 3 years (right leg: 3.935 ± 1.074 to 3.536 ± 1.236; left leg: 3.871 ± 1.176 to 3.450 ± 1.249; both P < 0.001). Although the present study did not include a non-diabetic control group, Park et al reported greater declines in leg lean mass (−0.29 ± 0.01 vs. −0.23 ± 0.01 kg, mean ± SE, P = 0.035), leg extension strength (−16.5 ± 1.2 vs. −12.4 ± 0.5 Nm, mean ± SE, P = 0.001), and leg muscle quality (−1.6 ± 0.2 vs. −1.2 ± 0.1 Nm/kg, mean ± SE, P = 0.034) over 3 years in older adults with diabetes than in those without diabetes [7]. These findings suggest that longitudinal assessment of both muscle mass and strength is important for evaluating the risk of sarcopenia, especially in patients with type 2 diabetes.
In our previous cross-sectional study, Rt- and Lt-PhA were negatively correlated with age and ECW/TBW and positively correlated with male sex, SMI, muscle strength, and SPPB score in Japanese patients with type 2 diabetes [14]. In the present study, similar associations were observed at baseline, although no correlation with SPPB score was observed. Consistently, Amagawa et al reported a positive correlation between PhA and SMI and handgrip strength in older patients with type 2 diabetes [19]. As shown in Table 2, Rt- and Lt-PhA decreased in parallel with SMI and muscle strength over 3 years, and these associations remained significant at follow-up. These findings suggest that longitudinal changes in PhA may be associated with changes in both muscle mass and strength. The lack of association between PhA and SPPB score at baseline may be explained by a ceiling effect, as the mean SPPB score was high (11.80 ± 0.5318; maximum score 12) and patients with sarcopenia were excluded. Consequently, SPPB scores did not significantly decrease over 3 years and were not correlated with PhA at baseline. When analyzing associations between changes in variables, conventional correlation or regression approaches may be unstable or inappropriate under certain conditions (e.g., when variability is limited). Therefore, we used a modified correlation-based linkage analysis, as described previously. Using this method, changes in Rt- and Lt-PhA over 3 years were associated with changes in SMI, ipsilateral muscle strength, and SPPB score. These findings suggest that longitudinal changes in PhA may reflect changes in muscle mass, muscle strength, and physical performance.
PhA is calculated as an arctangent using the raw data of R and Xc at a frequency of 50 kHz, expressed as (Xc/R) × 180°/π [12]. R is derived from the amount of ICW and ECW, whereas Xc is dependent on cell membrane integrity, particularly in muscle cells. The BIA method is simple to use and inexpensive and uses portable equipment, allowing PhA to be measured in patients for whom muscle function testing is difficult. Wada et al reported the association of PhA with the degree of functional disability among patients with lumbar spinal stenosis [20], and Ortega et al showed that PhA was associated with prognosis in patients with dementia [21]. Loss of muscle mass due to aging, protein degradation by metabolic acidosis in severe renal disease or diabetic ketoacidosis, malnutrition, state of hemodialysis, or sarcopenia may increase R (due to reduced ICW) and decrease Xc (due to impaired muscle cell membrane integrity), resulting in a decline in PhA. Consistent with this, Xiao et al demonstrated lower PhA in patients with hemodialysis [22], and Chen et al reported that declines in PhA were associated with declines in muscle mass in patients with sarcopenia [23]. Recently, Di Vincenzo et al revealed similar results with lower PhA in sarcopenia by meta-analysis [24], and Hou et al reported the diagnostic performance of PhA for sarcopenia among older patients [25]. Kolodziej et al showed that decrement of PhA was −0.11 ± 0.61 (M ± SD) and declines in PhA were associated with declines in muscle mass and strength in healthy adults > 50 years of age in a 1-year observation study [26]. Conversely, 12-week resistance training increased PhA by approximately 0.3 with decreasing R through an increase in ICW and increasing Xc through an improved muscle cell function [27]. The present study demonstrated greater declines in PhA, muscle mass, and muscle strength over 3 years as shown in Table 2, suggesting that decline of PhA and muscle health may progress year by year if resistance exercise is not performed. Other reports also showed that resistance exercise increased PhA and muscle mass and strength in older adults, suggesting possibility of prevention effect on development of sarcopenia [28, 29]. However, these studies evaluated changes over relatively short periods (≤ 1 year) and longer studies have not evaluated PhA change by resistance training. Because measurement of muscle strength and physical performance typically requires trained personnel and specialized settings, whereas PhA can be easily assessed using a BIA in clinical and health checkup settings, PhA may serve as a useful overall marker of these parameters. However, we should keep in mind that PhA changes along with not only muscular markers but also with changes of body fluid, nutrition, or metabolic state. Thus, it should be carefully to evaluate longitudinal changes of muscle mass, strength, and physical performance by assessment of change in PhA.
Previous cross-sectional studies have reported negative correlations between ECW/TBW and PhA and positive correlation between age and ECW/TBW, suggesting that ECW/TBW increases and PhA decreases with age [30–32]. Similar findings were obtained in our previous study [14] and at baseline in the present study. However, ECW/TBW did not increase over 3 years and was not correlated with PhA at follow-up. In addition, changes in PhA were not associated with changes in ECW/TBW. These findings suggest that long-term longitudinal studies are needed to clarify the relationship between ECW/TBW and PhA.
Regarding the effects of glucose-lowering drugs such as metformin, sodium-glucose co-transporter 2 inhibitors (SGLT2is), glucagon-like peptide-1 receptor agonists (GLP-1RAs), or GLP-1/glucose-dependent insulinotropic polypeptide receptor agonists (GLP-1/GIP RAs) on muscle-related parameters in patients with type 2 diabetes, previous studies have been limited to short-term observations (3–12 months) [33, 34]. In the present study, we additionally compared changes in PhA, muscle markers, and SPPB scores between patients with and without metformin use (n = 31 and 57, respectively), excluding those who initiated or discontinued treatment during the study period, and found no significant differences. Similar results were observed for SGLT2is (n = 15 and 71, respectively) and GLP-1RAs or GLP-1/GIP RAs (n = 9 and 88, respectively). However, many patients were treated with multiple agents and the dosage was adjusted appropriately, and 19 patients discontinued or added drugs during the study period. Therefore, larger studies are needed to clarify the potential effects of these therapies on PhA and muscle-related outcomes.
This study has several limitations. First, it was a retrospective, single-center, and non-interventional study without a non-diabetic control group. Second, the sample size was relatively small, with fewer female patients than male patients (see Table 1), which may limit the evaluation of sex-related differences. Third, data were obtained only at baseline and 3 years, and intermediate changes were not assessed. Fourth, adherence to diet and exercise was not systematically assessed. Thus, this point should be considered for the assessment of the obtained results. Fifth, patients with sarcopenia were not included in the present study. Osteoporosis, characterized by increased bone turnover and reduced bone mineral density (BMD), may lead to fragility and fractures, and recent large-scale analyses showed that SMI is positively correlated with BMD [35]. The co-existence of osteoporosis and sarcopenia, called osteosarcopenia, may worsen the risk of falls and fractures, and low SMI may be a significant risk factor for osteosarcopenia [36]. Thus, patients diagnosed with sarcopenia may have a possibility of complications of osteoporosis, and it may be difficult to accurately and safely measure muscle strength and physical performance in such patients. Taken together, we excluded these patients from the study. Sixth, SMI was measured using a BIA rather than DXA, which is considered a more accurate method.
In conclusion, PhA, muscle mass, and muscle strength decreased for 3 years in older Japanese patients with type 2 diabetes. The rate of decline in muscle strength exceeded that of muscle mass, and leg muscle quality also decreased. Declines in PhA were associated with declines in muscle mass, muscle strength, and physical performance. However, this study was retrospective, conducted in a single-center, and excluded patients with sarcopenia, which limits how broadly the findings can be applied. Thus, larger prospective studies are needed to confirm these findings and further clarify the clinical utility of PhA in patients with type 2 diabetes.
Acknowledgments
We wish to thank the patients and hospital staff who participated in this study.
Financial Disclosure
This study was conducted without any grant funding.
Conflict of Interest
The authors declare no conflict of interest in associated with the present study.
Informed Consent
Informed consent was obtained through an opt-out procedure on our website.
Author Contributions
YS designed the study, participated in data collection, performed the statistical analysis, and wrote the manuscript. SU, SM, and YT participated in data collection and statistical analysis. MS and YT organized the study and edited the manuscript. All authors approved the final version for publication.
Data Availability
The authors declare that the data supporting the findings of this study are available within the article.
| References | ▴Top |
- Lexell J, Taylor CC, Sjostrom M. What is the cause of the ageing atrophy? Total number, size and proportion of different fiber types studied in whole vastus lateralis muscle from 15- to 83-year-old men. J Neurol Sci. 1988;84(2-3):275-294.
doi pubmed - Koster A, Ding J, Stenholm S, Caserotti P, Houston DK, Nicklas BJ, You T, et al. Does the amount of fat mass predict age-related loss of lean mass, muscle strength, and muscle quality in older adults? J Gerontol A Biol Sci Med Sci. 2011;66(8):888-895.
doi pubmed - Delmonico MJ, Harris TB, Visser M, Park SW, Conroy MB, Velasquez-Mieyer P, Boudreau R, et al. Longitudinal study of muscle strength, quality, and adipose tissue infiltration. Am J Clin Nutr. 2009;90(6):1579-1585.
doi pubmed - Goodpaster BH, Park SW, Harris TB, Kritchevsky SB, Nevitt M, Schwartz AV, Simonsick EM, et al. The loss of skeletal muscle strength, mass, and quality in older adults: the health, aging and body composition study. J Gerontol A Biol Sci Med Sci. 2006;61(10):1059-1064.
doi pubmed - Park SW, Goodpaster BH, Strotmeyer ES, de Rekeneire N, Harris TB, Schwartz AV, Tylavsky FA, et al. Decreased muscle strength and quality in older adults with type 2 diabetes: the health, aging, and body composition study. Diabetes. 2006;55(6):1813-1818.
doi pubmed - Nomura T, Ishiguro T, Ohira M, Oka H, Ikeda Y. Isometric knee extension force in Japanese type 2 diabetic patients without apparent diabetic polyneuropathy: Data from the Multicenter Survey of the Isometric Lower Extremity Strength in Type 2 Diabetes study. SAGE Open Med. 2019;7:2050312118823412.
doi pubmed - Park SW, Goodpaster BH, Strotmeyer ES, Kuller LH, Broudeau R, Kammerer C, de Rekeneire N, et al. Accelerated loss of skeletal muscle strength in older adults with type 2 diabetes: the health, aging, and body composition study. Diabetes Care. 2007;30(6):1507-1512.
doi pubmed - Kalyani RR, Corriere M, Ferrucci L. Age-related and disease-related muscle loss: the effect of diabetes, obesity, and other diseases. Lancet Diabetes Endocrinol. 2014;2(10):819-829.
doi pubmed - Purnamasari D, Tetrasiwi EN, Kartiko GJ, Astrella C, Husam K, Laksmi PW. Sarcopenia and chronic complications of type 2 diabetes mellitus. Rev Diabet Stud. 2022;18(3):157-165.
doi pubmed - Dey DK, Bosaeus I. Comparison of bioelectrical impedance prediction equations for fat-free mass in a population-based sample of 75 y olds: the NORA study. Nutrition. 2003;19(10):858-864.
doi pubmed - Genton L, Karsegard VL, Kyle UG, Hans DB, Michel JP, Pichard C. Comparison of four bioelectrical impedance analysis formulas in healthy elderly subjects. Gerontology. 2001;47(6):315-323.
doi pubmed - Norman K, Stobaus N, Pirlich M, Bosy-Westphal A. Bioelectrical phase angle and impedance vector analysis—clinical relevance and applicability of impedance parameters. Clin Nutr. 2012;31(6):854-861.
doi pubmed - Custodio Martins P, de Lima TR, Silva AM, Santos Silva DA. Association of phase angle with muscle strength and aerobic fitness in different populations: a systematic review. Nutrition. 2022;93:111489.
doi pubmed - Oyanagi T, Sada Y, Sasaki Y, Sone M, Tanaka Y. Associations of phase angle obtained by bioelectrical impedance analysis with muscle mass and strength in Japanese patients with type 2 diabetes. Endocr J. 2023;70(9):925-932.
doi pubmed - Chen LK, Woo J, Assantachai P, Auyeung TW, Chou MY, Iijima K, Jang HC, et al. Asian Working Group for Sarcopenia: 2019 consensus update on sarcopenia diagnosis and treatment. J Am Med Dir Assoc. 2020;21(3):300-307.e302.
doi pubmed - Takemoto A, Sada Y, Oyanagi T, Sasaki Y, Sone M, Tanaka Y. Alanine aminotransferase, body mass index, hemoglobin A1c may be useful markers for monitoring changes in intrahepatic lipid content in Japanese patients with overweight or obesity and type 2 diabetes. J Endocrinol Metab. 2022;12:73-78.
- Wiegmann S, Felsenberg D, Armbrecht G, Dietzel R. Longitudinal changes in muscle power compared to muscle strength and mass. J Musculoskelet Neuronal Interact. 2021;21(1):13-25.
pubmed - Asano Y, Yoshida T, Tsunoda K, Yokoyama K, Watanabe Y, Yoshinaka Y, Okura T, et al. Sex- and age-related declines in muscle mass, strength, physical performance, and muscle quality among community-dwelling older adults: A cross-sectional study. Exp Gerontol. 2025;210:112862.
doi pubmed - Amagawa T, Yokoyama H, Teramoto Y, Fujimaki Y, Ohno A, Takamura H. Phase angle, extracellular to intracellular water ratio, and advanced glycation end products according to four sarcopenia categories and in relation to muscle strength/mass in elderly out-patients with diabetes. Diabetol Int. 2026;17(3):58.
doi pubmed - Wada O, Yamada M, Kamitani T, Mizuno K, Tadokoro K, Kurita N. Association between phase angle and functional disability among patients with lumbar spinal stenosis: The SPSS-OK study. J Back Musculoskelet Rehabil. 2023;36(2):399-405.
doi pubmed - Barrera Ortega S, Redondo Del Rio P, Carreno Enciso L, de la Cruz Marcos S, Massia MN, de Mateo Silleras B. Phase Angle as a Prognostic Indicator of Survival in Institutionalized Psychogeriatric Patients. Nutrients. 2023;15(9):2139.
doi pubmed - Xiao Q, Xie N, Xiang X, Cao T, Xie Y, Liang X, Su X. The value of the phase angle of bioelectrical impedance analysis to predict malnutrition in hemodialysis patients. Front Nephrol. 2025;5:1478367.
doi pubmed - Chen R, Xu Z, Shi H, Ma T, Li P, Yuan R, Liu C. Longitudinal study on the relationship between extracellular water distribution changes and muscle mass in severe sarcopenia patients using multi-frequency bioelectrical impedance analysis combined with phase angle measurements. Eur Geriatr Med. 2026;17(1):53-62.
doi pubmed - Di Vincenzo O, Marra M, Di Gregorio A, Pasanisi F, Scalfi L. Bioelectrical impedance analysis (BIA) -derived phase angle in sarcopenia: a systematic review. Clin Nutr. 2021;40(5):3052-3061.
doi pubmed - Hou S, Zhao X, Wei J, Wang G. The diagnostic performance of phase angle for sarcopenia among older adults: a systematic review and diagnostic meta-analysis. Arch Gerontol Geriatr. 2025;131:105754.
doi pubmed - Kolodziej M, Ignasiak Z, Ignasiak T. Annual changes in appendicular skeletal muscle mass and quality in adults over 50 y of age, assessed using bioelectrical impedance analysis. Nutrition. 2021;90:111342.
doi pubmed - Campa F, Colognesi LA, Moro T, Paoli A, Casolo A, Santos L, Correia RR, et al. Effect of resistance training on bioelectrical phase angle in older adults: a systematic review with Meta-analysis of randomized controlled trials. Rev Endocr Metab Disord. 2023;24(3):439-449.
doi pubmed - Ribeiro AS, Oliveira AV, Kassiano W, Nascimento MA, Mayhew JL, Cyrino ES. Effects of resistance training on body recomposition, muscular strength, and phase angle in older women with different fat mass levels. Aging Clin Exp Res. 2023;35(2):303-310.
doi pubmed - Campa F, Silva AM, Toselli S. Changes in phase angle and handgrip strength induced by suspension training in older women. Int J Sports Med. 2018;39(6):442-449.
doi pubmed - Sales WB, Costa LBA, Pereira MSR, Macedo S, Vieira ER, Maciel ACC. Relationship between body water distribution and sarcopenia in older adults: a systematic review. Eur Rev Aging Phys Act. 2026;23(1):12.
doi pubmed - Hioka A, Akazawa N, Okawa N, Nagahiro S. Influence of aging on extracellular water-to-total body water ratio in community-dwelling females. Clin Nutr ESPEN. 2024;60:73-78.
doi pubmed - Muramae N, Matsuda T, Inagaki S, Takahashi H, Abe K, Nakatani S, Takahashi M, et al. Determinants of phase angle in Japanese patients with diabetes. Diabetol Int. 2023;14(4):339-343.
doi pubmed - Zhao J, Lv SS, Lu Q, Cong XX, Zhang XF. Effects of hypoglycemic agents on the musculoskeletal system: a comprehensive review. Drug Des Devel Ther. 2025;19:6235-6253.
doi pubmed - Mechanick JI, Butsch WS, Christensen SM, Hamdy O, Li Z, Prado CM, Heymsfield SB. Strategies for minimizing muscle loss during use of incretin-mimetic drugs for treatment of obesity. Obes Rev. 2025;26(1):e13841.
doi pubmed - Inoue T, Maeda K, Nagano A, Shimizu A, Ueshima J, Murotani K, Sato K, et al. Related factors and clinical outcomes of osteosarcopenia: a narrative review. Nutrients. 2021;13(2):291.
doi pubmed - Li Y, Huang Z, Gong Y, Zheng Y, Zeng Q. Retrospective analysis of the relationship between bone mineral density and body composition in a health check-up Chinese population. Front Endocrinol (Lausanne). 2022;13:965758.
doi pubmed
This article is distributed under the terms of the Creative Commons Attribution 4.0 International License (CC BY 4.0), which permits unrestricted use, distribution, and reproduction in any medium, including commercial use, provided the original work is properly cited.
Journal of Clinical Medicine Research is published by Elmer Press Inc.