| Journal of Clinical Medicine Research, ISSN 1918-3003 print, 1918-3011 online, Open Access |
| Article copyright, the authors; Journal compilation copyright, J Clin Med Res and Elmer Press Inc |
| Journal website https://jocmr.elmerjournals.com |
Original Article
Volume 18, Number 11, November 2026, pages 859-879

When Stress Biology Meets Coronary Atherosclerosis: Diurnal Cortisol Patterns and Coronary Artery Disease Burden in Patients With Diabetes and Chronic Depression
Yasmin Mahmouda, p, Mohamed A. Hegabb, p, Abdulrahman Ahmed Eidc, Mohammed Mohammed Abdelkhalik Eldeebd, Yasser Abdelgaleel Omar Ramadane, Nermin Mohamed Naguib Mahmoudf, Mahmoud Alig, Esraa Abdelrahmanh, i, Al Hussein Mustafa Zahran Ahmede, q, Reham Abdelmaksoudj, Esmat Mohamed M. Fawzyk, Nagwa Roshdy Mohamedl, m, M.A. Ghazyn, Ahmed Ali Faheem Abdoe, Mona H. Hamadtoo
aOkasha Institute of Psychiatry, Neuropsychiatry Department, Faculty of Medicine, Ain Shams University, Cairo, Egypt
bCommunity Medicine, Whaddon Health Care, England, UK
cFaculty of Medicine, Alexandria University, Alexandria, Egypt
dDepartment of Psychiatry, Faculty of Medicine, Al-Azhar University, Cairo, Egypt
eDepartment of Cardiology, Faculty of Medicine, Al-Azhar University, Cairo, Egypt
fDepartment of Radiology, Faculty of Medicine, Ain Shams University, Cairo, Egypt
gDepartment of Cardiology, Faculty of Medicine, Cairo University, Cairo, Egypt
hFaculty of Medicine, Al-Azhar University, Cairo, Egypt
iEast London NHS Foundation Trust, London, UK
jDepartment of Psychiatry, Faculty of Medicine, Cairo University, Cairo, Egypt
kDepartment of Clinical and Chemical Pathology, Faculty of Medicine, Zagazig University, Zagazig, Egypt
lDepartment of Internal Medicine, Faculty of Medicine, Ain Shams University, Cairo, Egypt
mInternal Medicine and Endocrinology, Mouwasat Hospital, Jubail, Saudi Arabia
nDepartment of Cardiology, Faculty of Medicine, Ain Shams University, Cairo, Egypt
oDepartment of Cardiology, Faculty of Medicine, Benha University, Benha, Egypt
pThese authors contributed equally to this work and share first authorship.
qCorresponding Author: Al Hussein Mustafa Zahran Ahmed, Department of Cardiology, Faculty of Medicine, Al-Azhar University, Cairo, Egypt
Manuscript submitted September 30, 2026, accepted October 12, 2026, published online November 9, 2026
Short title: Diurnal Cortisol and CAD Burden in Diabetes
doi: https://doi.org/10.14740/jocmr6749
| Abstract | ▴Top |
Background: Type 2 diabetes mellitus and chronic depression frequently co-occur and jointly accelerate coronary artery disease (CAD), and dysregulation of the hypothalamic–pituitary–adrenal axis has been proposed as a biological link. This study aimed to determine whether diurnal serum cortisol metrics are associated with the angiographic burden of CAD in patients with both conditions.
Methods: In this retrospective observational study with a case–control component, 100 participants were analyzed: 50 patients with type 2 diabetes and clinician-documented chronic depression (cases) and 50 healthy controls. Morning (06:00–10:00) and evening (16:00–20:00) serum cortisol was measured with the Roche Elecsys Cortisol II immunoassay, and the AM–PM difference and AM/PM ratio were derived. In cases, coronary burden was classified from catheter angiography reports as multivessel CAD (≥ 70% stenosis in two or more major epicardial arteries) and obstructive CAD (≥ 70% stenosis in any epicardial vessel or ≥ 50% in the left main). Group comparisons, exploratory multivariable logistic regression adjusted for age, sex, body mass index, hypertension, dyslipidemia and smoking, and receiver operating characteristic (ROC) analyses were performed; because of the small number of events, the adjusted and ROC analyses are reported as exploratory and hypothesis-generating.
Results: Compared with controls, cases had higher morning cortisol (17.00 ± 3.00 vs. 15.02 ± 2.63 µg/dL; mean difference 1.98 µg/dL, 95% confidence interval (CI): 0.86–3.10, P = 0.0007), higher evening cortisol (median 4.72 vs. 3.21 µg/dL, P < 0.001), and a lower AM/PM ratio (median 3.56 vs. 4.28, P = 0.0087), whereas the absolute AM–PM difference did not differ (P = 0.25). Among cases, 37 had multivessel CAD and 19 had obstructive CAD. No cortisol parameter differed according to multivessel (all P ≥ 0.29) or obstructive status (all P ≥ 0.52), and, in exploratory adjusted models, none was independently associated with either endpoint (e.g., adjusted odds ratio (aOR) for evening cortisol 0.61, 95% CI 0.33–1.11 for multivessel CAD and 0.74, 95% CI 0.41–1.33 for obstructive CAD). In exploratory ROC analyses, cortisol metrics showed poor discrimination, with areas under the curve ranging from 0.39 (95% CI 0.22–0.59) to 0.59 (95% CI 0.43–0.74); every 95% CI included 0.50. In the exploratory adjusted model, older age was inversely associated with obstructive CAD (aOR 0.91, 95% CI 0.84–0.99, P = 0.030), a finding that requires confirmation given only 19 obstructive CAD events.
Conclusions: Patients with comorbid type 2 diabetes and chronic depression show elevated cortisol with a blunted diurnal ratio, but single-day spot serum cortisol metrics are not associated with the angiographic extent or severity of CAD in this sample; the adjusted and ROC analyses were exploratory and require confirmation. Measures of cumulative cortisol exposure, such as repeated multi-day salivary sampling and hair cortisol, combined with comprehensive coronary computed tomography angiography, merit evaluation in larger prospective cohorts.
Keywords: Coronary artery disease; Diurnal cortisol; Type 2 diabetes mellitus; Chronic depression; Hypothalamic–pituitary–adrenal axis; Coronary angiography; Stress biomarkers
| Introduction | ▴Top |
Type 2 diabetes mellitus and chronic depression represent a particularly hostile clinical intersection, with each condition independently and synergistically accelerating the progression of coronary artery disease (CAD) [1, 2]. Depression affects roughly one-third of individuals with diabetes mellitus, and shared hypothalamic–pituitary–adrenal (HPA) axis dysregulation driven by chronic hyperglycemia is thought to underlie much of this comorbidity [3, 4]. While the macrovascular and microvascular consequences of chronic hyperglycemia and dyslipidemia are well-established, the specific biological pathways translating chronic psychiatric distress into physical arterial plaque accumulation remain less clear. A primary candidate in this complex pathophysiological cascade is the HPA axis and its principal glucocorticoid endpoint, cortisol [5].
Under healthy physiological conditions, cortisol secretion follows a strict 24-h circadian rhythm characterized by a sharp morning peak and a late-evening nadir, which plays a vital role in coordinating autonomic, vascular, and metabolic homeostasis [6, 7]. However, the chronic psychological and physiological strain inherent to both diabetes and persistent depressive states frequently deranges this delicate neuroendocrine rhythm [8], consistent with large cohort evidence linking major depressive disorder to modest but significant HPA axis alterations independent of comorbid metabolic disease [9]. Disrupted HPA axis activity, whether presenting as subclinical evening hypercortisolism or a flattened diurnal curve, has been linked to insulin resistance, endothelial injury, and systemic inflammation [10, 11], and prospective cohort studies have further linked flatter diurnal cortisol slopes and dysregulated diurnal patterns to increased coronary artery calcification, adverse post-surgical cardiac events, and cardiovascular mortality [12–14], and Mendelian randomization data support a potentially causal role for morning cortisol in cardiovascular risk [15]. Over time, this systemic glucocorticoid disharmony can accelerate coronary atherogenesis and elevate long-term cardiovascular risk [16]. Investigating the relationship between these diurnal cortisol patterns and the actual anatomical severity of CAD in this highly vulnerable comorbid population is essential to refine risk-stratification models and guide targeted, chronobiologically aligned therapies.
Despite clear evidence linking HPA axis dysregulation to both metabolic dysfunction and psychiatric distress [1, 8], a major diagnostic and therapeutic gap remains in clinical cardiology. Current literature heavily relies on isolated, single-point cortisol measurements, which fail to capture the complex 24-h diurnal secretory dynamics crucial to vascular homeostasis. While systemic glucocorticoid alterations are known to drive the endothelial and inflammatory pathways of atherogenesis, we still do not understand how specific diurnal metrics, namely morning and evening levels, the AM–PM difference, and the AM/PM ratio, correlate with the actual anatomical burden of CAD.
In fact, in those with comorbid type 2 diabetes and chronic depression, the relationship between a blunted diurnal cortisol pattern and the presence of multivessel versus hemodynamically obstructive disease is not known. In this high-risk patient population, clinicians cannot apply the dynamics of the HPA axis to cardiovascular risk stratification, and thus a crucial window for early chronobiologically targeted intervention remains untouched.
This study was designed to determine whether diurnal fluctuations in stress hormone levels are associated with the anatomical severity of CAD in patients with comorbid type 2 diabetes and chronic depression.
Our primary aim is to investigate the relationship between diurnal cortisol patterns and CAD burden in patients with diabetes and chronic depression.
To address this, the study was organized around the following secondary aims:
- To characterize AM and PM serum cortisol concentrations.
- To assess the degree of flattening of the AM/PM cortisol relationship.
- To compare cortisol characteristics between patients and controls to assess differences in stress biology between the comorbid group and healthy individuals.
- To examine cortisol characteristics in relation to multivessel CAD, to assess whether abnormal cortisol patterns are associated with plaque distribution across multiple vessels.
- To examine cortisol characteristics in relation to obstructive CAD, to assess whether these hormonal changes are associated with severe, flow-limiting arterial blockages.
Much of the existing literature relies on single-point cortisol measurements or subjective, self-reported depression questionnaires. The present study adopted a more rigorous approach: every chronic depression case was verified through a formal clinician diagnosis rather than a symptom checklist.
The study then correlated accurate, automated measurements of hormones obtained with the Roche Cobas e 411 analyzer with actual data from coronary angiograms. This approach allows an assessment of whether irregular cortisol rhythms correspond to physical plaque formation in the coronary arteries, including plaque extent and distribution across multiple vessels.
In essence, this study aims to link chronic stress biology to measurable coronary pathology, contributing to the understanding of stress effects on the cardiovascular system. Demonstrating that a flatter diurnal cortisol pattern is associated with more severe and diffuse arterial disease would support diurnal cortisol as a candidate biomarker for identifying high-risk patients before clinical presentation.
| Materials and Methods | ▴Top |
Study design
The study adopted an observational, analytical design with a built-in case–control component, reported in accordance with the STROBE guidelines for observational research [17]. This design was selected to directly examine how daily cortisol curves relate to physical plaque buildup in the coronary vessels. The study itself was set up and carried out with all the clinical, laboratory, and imaging data pulled from patient records over a specific study period. The aim was to determine whether structural coronary damage is mirrored by disruption of the normal cortisol rhythm. To do that, the study split the total cohort of 100 people into two clear groups. Group I includes 50 cases who have both type 2 diabetes and a solid, clinician-documented history of chronic depression. This group was compared against group II, comprising 50 controls without diabetes or depression (Table 1). This two-group design formed the basis for the subsequent analysis of two-point diurnal cortisol measures and CAD burden.
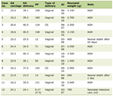 Click to view | Table 1. Overview of Study Design and Participant Group Allocation |
Study population and eligibility criteria
For adults aged 18 years and older, screening was done, and they were selected for retrospective review within the window of clinical inclusion. Group I (cases, n = 50) consisted of those patients who had a clearly documented diagnosis of type 2 diabetes mellitus and who had a history of chronic depression, which was formally documented by a clinician, but not through a retrospective symptom checklist. These patients also had to have both morning and evening blood draws for complete cortisol data and a completed coronary angiographic assessment. Group II (controls, n = 50), on the other hand, formed a healthy reference group and were selected to ensure that no individuals in the group had any clinical history of diabetes, no depressive symptoms or psychiatric diagnoses, and none had any evidence of CAD on record.
During chart selection, several clinical exclusion criteria were closely followed to ensure the results were not contaminated by metabolic or stress-induced outliers. Patients were excluded for drug-induced adrenal suppression if they had received systemic steroids, oral glucocorticoids, or other drugs known to alter HPA axis activity within the 3 months preceding blood sampling. Moreover, those who had acute systemic illness, active infection, or critical trauma within the sampling period were excluded to avoid transient (stress-induced) hypercortisolism. To ensure the overall integrity of the study dataset, any incomplete candidate chart, lacking lab assays, or not interpretable from the angiographic images was excluded.
Chronic depression ascertainment
To ensure a rigorous case definition, a positive history of chronic depression was determined strictly by an explicit, formal clinician diagnosis documented within the official medical or psychiatric health records, such as psychiatric consultation reports or longitudinal progress files. It was not enough to just find a patient taking antidepressants, since these drugs are frequently prescribed for other indications, including anxiety, neuropathy, or chronic insomnia. Similarly, just having classic depressive symptoms noted down in a chart progress note was not allowed to count as a formal confirmation; subjective, transient complaints do not equal a rigorous, formal diagnostic workup by a clinical professional, and standardized self-report severity instruments such as the PHQ-9 were not used as a substitute for clinician diagnosis in this retrospective cohort [18].
Most importantly, cortisol levels or any other biochemical test metrics were never used to retroactively guess, infer, or diagnose psychiatric status, which kept the hormone exposure data and the clinical depression definitions completely independent of one another. By sticking strictly to established clinician diagnoses in the medical charts, retrospective diagnostic bias was kept out of the selection process entirely, making sure that every single patient categorized in group I had a real, verified history of chronic depression.
Clinical and demographic variables
To gain robust information on the individuals in the study cohort, baseline demographic and health characteristics were systematically collected from all the participants. The collected variables included age, gender, body mass index (BMI), diabetes, hypertension, hyperlipidemia, tobacco use, and history of major depression. All these variables were extracted from the medical records of the patients who took part in the study as well as from their medical histories. This made it easier to consider the usual cardiovascular risk factors for use in the final regression models.
For conditions such as hypertension and dyslipidemia, active clinician diagnoses, or ongoing prescriptions for antihypertensive or lipid-lowering drugs in the charts were used as confirmation. Smoking status was recorded simply as positive if there was any active tobacco use documented in the social history files at the time of the study. Sticking strictly to documented clinical records kept the baseline variables reliable and uniform across the entire cohort of 100 participants.
Table 2 lists the specific clinical and demographic variables recorded for all participants.
Click to view | Table 2. Definitions and Sources of Abstracted Clinical and Demographic Variables |
Serum cortisol measurement
Blood was drawn from the veins to determine the levels of cortisol in the plasma, and then the plasma cortisol level was measured by the automated Roche Elecsys Cortisol II assay on the Cobas e 411 immunoassay analyzer (Roche Diagnostics). The principle of the laboratory protocol is a competitive immunoassay, where cortisol present in the patient’s sample competes with a labelled cortisol derivative for a limited number of antibody binding sites, and the final signal is detected by electrochemiluminescence. All final concentrations are given in µg/dL. The reference ranges as provided by the manufacturer were used as the primary reference to compare these with the normal ranges. Morning samples were drawn within the 06:00–10:00 window and evening samples within the 16:00–20:00 window, consistent with the manufacturer-specified sampling intervals for the reference ranges applied in this study. Fasting status, exact timing relative to waking, and control of concomitant medication administration (e.g., morning insulin or antihypertensive dosing) relative to the blood draw were not specified in the study protocol and could not be determined from the retrospective clinical records. Sample processing and storage prior to assay followed standard clinical laboratory procedure at the study site; the exact processing interval and storage temperature were not separately documented for research purposes. The interval between cortisol sampling and coronary angiographic assessment was not systematically recorded. These gaps are acknowledged as limitations below.
The manufacturer’s 5th to 95th percentile range for morning draws is 6.02–18.4 µg/dL and the wider 2.5th to 97.5th percentile range for morning draws is 4.82–19.5 µg/dL. The 5th–95th percentile of evening samples (16:00–20:00) is 2.68–10.5 µg/dL and the 2.5th–97.5th percentile is 2.47–11.9 µg/dL. The consistency of hormone profiling, with no manual errors, was an advantage of adhering to these automated laboratory setups and manufacturer-defined ranges throughout the entire patient population.
Cortisol-derived parameters
To get a complete picture of how the adrenal gland is behaving throughout the day, four specific cortisol parameters were analyzed for every participant in the dataset. These included the raw baseline morning concentration, recorded as Cortisol AM, and the late-afternoon-to-evening level, recorded as Cortisol PM. Beyond these two basic measurements, two separate mathematical variables were calculated to better capture the actual daily rhythm of hormone release. The first, the AM–PM difference, was calculated simply by subtracting the evening concentration from the morning concentration (Cortisol AM – Cortisol PM).
The second calculated variable, the AM/PM ratio, was established by dividing the morning value by the evening value (Cortisol AM/Cortisol PM). Together, both derived parameters, the difference and the ratio, were analyzed to serve as direct clinical indices of diurnal cortisol pattern. These derived measures indicate whether the normal, physiological daily decline in cortisol was preserved or had begun to flatten, which is a key consideration when evaluating whether a blunted hormone curve corresponds to more severe arterial disease.
Coronary imaging assessment (angiography and computed tomography (CT) angiography)
CAD burden was evaluated using the retrospective coronary angiographic records already available in the patient medical files. All these clinical catheterization reports indicated the presence or absence of disease, the exact location of any lesions, the number of coronary vessels involved, and the overall distribution of atherosclerotic plaques. In addition, the imaging information recorded the exact severity of the luminal narrowing (stenosis), which enabled classification of patients as having single vessel disease or multivessel disease, and confirmed the presence of hemodynamically obstructive coronary disease. All angiographic findings and anatomical classifications were read independently in accordance with the original clinical protocols and expert radiological interpretations that were filed, with the retrospective baseline based on standard cardiac diagnostic procedures in clinical practice.
For some participants, coronary CT angiography was also available in the clinical files and was initially planned to further characterize the physical properties of the coronary atherosclerosis. This secondary imaging modality was designed to evaluate plaque presence, detailed plaque characteristics, the exact number of affected coronary segments, total calcium burden, Agatston calcium scores, and overall calcium volume. However, it is necessary to mention that, to ensure absolute transparency about the final statistical outcomes, this CT-derived set of variables—to be precise, Agatston scores, calcium volume, and plaque phenotypes—did not occur in the analyzed dataset. Due to the complete absence of any raw CT data in the clinical archive, these variables were excluded from the statistical modeling process. The actual coronary burden assessment was kept strictly focused on the catheter-based angiographic endpoints of multivessel and obstructive CAD.
Definition of CAD burden and study endpoints
To make sense of the clinical angiography data, the overall CAD burden was broken down into two distinct categories. Multivessel CAD was defined as ≥ 70% diameter stenosis in two or more major epicardial coronary arteries (left anterior descending, left circumflex, or right coronary artery, or a major branch of these vessels), as documented in the original catheterization report. Obstructive CAD was defined as ≥ 70% diameter stenosis in any epicardial vessel (≥ 50% for the left main coronary artery), consistent with angiographic stenosis thresholds used in prior studies linking endothelial dysfunction to anatomical CAD burden [19, 20]. Both classifications were assigned exactly as recorded in the original clinical angiographic report at the time of the procedure; no images were re-read or re-adjudicated for this study, and the original reporting cardiologist was not blinded to and had no knowledge of the participant’s cortisol results, since cortisol was not measured as part of routine clinical care. This secondary categorization is key because it isolates patients who have severe luminal narrowing that gets in the way of normal blood flow to the heart muscle. Both classifications were defined retrospectively using the original cardiac catheterization reports, ensuring that the anatomic definitions are completely standardized.
Using these clinical groupings, two specific study endpoints were established for the final statistical models. The primary coronary endpoint was defined as the presence of multivessel CAD, and the secondary coronary endpoint was set as the presence of obstructive CAD. For both endpoints, the diurnal cortisol profile incorporating the morning and evening concentrations, the daily difference, and the calculated ratio acts as the principal exposure of interest. The whole analytical approach is built around mapping these specific stress hormone metrics directly against the two binary heart outcomes. Doing this makes it possible to see if a flattened daily cortisol curve or a high evening level directly matches up with more extensive coronary blockages, which is the main puzzle this research is trying to solve.
Statistical analysis
Continuous variables were first assessed for normality using a Shapiro–Wilk test to find the appropriate statistics that would be used. The data that were normally distributed were presented as mean ± standard deviation (SD), and the data that were skewed as median with interquartile range (IQR). Independent-samples t-tests or Mann–Whitney U tests were used for baseline group comparisons of continuous variables, depending on whether they were normally distributed or not, respectively, and chi-square tests or Fisher’s exact tests were used for categorical variables if the expected cell counts were ≥ 5 and < 5, respectively. To compare the cortisol levels in the morning and evening, the two levels of cortisol in each group of studies were compared directly, using a paired t-test or Wilcoxon signed-rank test within each group of studies to test the diurnal rhythm within each group. Pearson or Spearman correlation coefficient was used to determine the associations between the continuous variables (age and BMI) and the various parameters of cortisol.
A comparison was made between patients with multivessel and obstructive CAD, and those without CAD in terms of morning, evening, and AM–PM difference of cortisol, and AM/PM ratio, respectively, by independent t-test or Mann–Whitney U test as appropriate. These comparisons were followed by development of binary logistic regression models for both univariate and multivariate analysis to determine any independent predictors for both types of CAD (multivessel and obstructive). All models were adjusted for age, sex, BMI, hypertension, dyslipidemia, and smoking status, and results were reported as adjusted odds ratio (aOR) (95% confidence interval (CI)). Receiver operating characteristic (ROC) curves were calculated for each cortisol parameter to evaluate the ability of each parameter to discriminate between various disease states. From this analysis, the area under the curve (AUC) with a 95% CI (calculated using 2,000 resamples) was obtained along with exploratory Youden-derived thresholds, identified from the corresponding sensitivity and specificity values within this sample only. The ROC analyses were exploratory. For between-group comparisons analyzed with the independent-samples t-test, mean differences with 95% CIs were additionally calculated, and 95% CIs for the sensitivity and specificity at each exploratory threshold were calculated with the Wilson score method.
Given the limited number of outcome events relative to the number of covariates (19 obstructive-CAD-positive and 13 multivessel-CAD-negative cases against eight model covariates, corresponding to an events-per-variable ratio well below the conventional minimum of 10), the multivariable models are likely overfit and are reported as exploratory and hypothesis-generating rather than confirmatory. The aORs and their wide CIs should be interpreted with this constraint in mind. For all statistical procedures, two-tailed P-values less than 0.05 were considered significant. Data were prepared, and the mathematical calculations of diurnal parameters and regression modeling were performed using IBM SPSS Statistics software.
Ethical approval
This retrospective study was approved by the Ethics Committee of the Faculty of Medicine, Al-Azhar University, Cairo, Egypt (Approval Code: CliniPath-R-2026/07/0095), and was conducted in compliance with the ethical standards of the responsible institution on human subjects as well as with the Helsinki Declaration [21]. Because of the retrospective design and the use of fully de-identified data extracted from existing medical records, the requirement for individual informed consent was waived by the Ethics Committee. The information abstracted from the patient files, which included clinical baseline data, laboratory records, psychiatric history, and coronary angiography reports, was de-identified immediately after collection and stored in an encrypted, password-protected database that was not connected to the internet and was accessible only to the research personnel. No personal patient identifiers were used at any stage, and the recorded data were used for research purposes only.
| Results | ▴Top |
Baseline demographic and clinical characteristics
A total of 100 participants were ultimately included in the final analysis, split evenly into 50 cases (group I, characterized by comorbid type 2 diabetes mellitus and chronic depression) and 50 healthy controls (group II) (Table 3). When looking at the demographic baseline, the matching process was highly successful. There was no statistically significant difference between the cases (62.00 years, IQR: 55.50–66.00) and controls (62.50 years, IQR: 58.25–66.00) (P = 0.62). Likewise, biological sex was equally distributed between the study group and the control group of 33 males (66.0%) and 32 males (64.0%) respectively (P = 1.00). The case group had a slightly higher BMI (median 30.00 kg/m2) than the control group (median 29.00 kg/m2), but the difference was not statistically significant (P = 0.054).
Click to view | Table 3. Baseline Demographic and Clinical Characteristics of Cases (Group I, Diabetes + Chronic Depression) and Controls (Group II) |
The results were as predicted in accordance with the design criteria of the study, which showed that 100% of the cases had a history of type 2 diabetes (P < 0.01) and there was no history of diabetes among the control cases (P < 0.01). Likewise, 100% of the cases were depressed (P < 0.01), while there was no depression among the control cases (P < 0.01). The case group had considerably more typical cardiovascular risk factors compared to the healthy reference group. Hypertension was present in 68.0% (n = 34) of cases, but in only one control participant (2.0%, P < 0.01). The trend for dyslipidemia was very similar: 56.0% (n = 28) of the diabetic and depressed cases versus and 8.0% (n = 4) of the controls (P < 0.01). There was also a significant difference between the cases and controls in active smoking at enrolment (36.0% (n = 18) active smokers vs. 10.0% (n = 5) (P = 0.0044)). These baseline differences reflect a concentration of classical metabolic and behavioral risk factors in the comorbid group, and these differences were further controlled in subsequent regression analyses.
Diurnal cortisol characteristics: cases vs. controls
Analysis of the raw endocrine results showed significant between-group differences in cortisol levels (Table 4, Fig. 1). The difference between the two groups was statistically significant with a P value of 0.0007, with the case group having a higher cortisol level in the morning (17.00 ± 3.00 µg/dL) compared to the control group (15.02 ± 2.63 µg/dL) (mean difference 1.98 µg/dL, 95% CI 0.86–3.10). This trend of elevated glucocorticoid levels continued right into the evening. The median PM cortisol level in cases was 4.72 µg/dL (IQR 3.92–5.73 µg/dL) which was significantly higher than the median in healthy controls, which was 3.21 µg/dL (IQR 2.56–4.46 µg/dL) with a P value of less than 0.001. These results indicated that people suffering from both diabetes and chronic depression experienced a day-long exposure to high levels of systemic cortisol.
Click to view | Table 4. Comparison of Diurnal Serum Cortisol Parameters Between Cases and Controls (N = 100) |
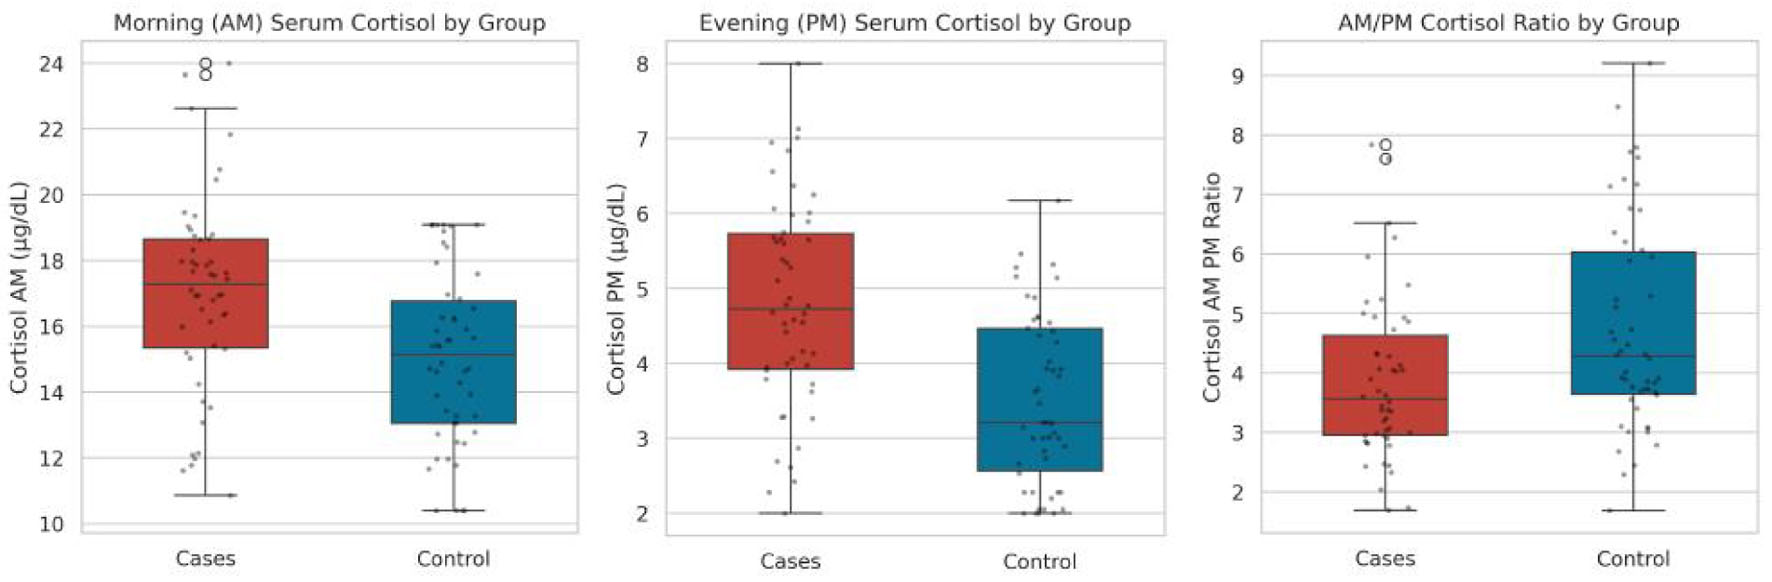 Click for large image | Figure 1. Morning (AM) serum cortisol, evening (PM) serum cortisol, and AM/PM cortisol ratio by group. |
The measurement of the decline in cortisol levels from the morning until the evening can be used to indicate if the body has an appropriate diurnal pattern. The ratio of AM/PM cortisol was significantly decreased in the cases (median 3.56, IQR 2.95–4.63) versus the controls (median 4.28, IQR 3.64–6.03). This significant decrease (P = 0.0087) directly referred to the flattening of the blunting of the diurnal cortisol pattern in the comorbid group. Interestingly, there was no significant difference between the groups in absolute AM to PM difference in cases (12.20 ± 3.15 µg/dL) and in controls (11.51 ± 2.83 µg/dL) (mean difference 0.69 µg/dL, 95% CI −0.50 to 1.88) (P = 0.2523). This is because both groups had a decrease in cortisol levels from morning to evening, but the relative decrease was significantly lower in cases, due to the abnormally elevated evening baseline level.
AM–PM diurnal cortisol relationship
Looking at the actual morning and evening pairs for each person, cortisol levels declined from morning to evening as expected (Table 5). In both groups, as well as when examining the complete cohort of the 100 participants, morning cortisol levels were significantly greater than evening levels. The results of the paired t-test regarding this phenomenon of the daily decline were very consistent, with a P-value of less than 0.001 for all the cases analyzed. Specifically, the average amount of cortisol in the blood samples of the cases dropped from 17.00 to 4.80 µg/dL, while that of the healthy participants fell from its average initial figure of 15.02 to 3.51 µg/dL at later points. In general, the results for the entire sample had an average amount of cortisol equal to 16.01 and 4.15 µg/dL, respectively. In summary, although the cortisol diurnal cycle had been significantly affected in the diabetic and depressive patients, the overall pattern remained intact.
Click to view | Table 5. Paired Comparison of AM vs. PM Serum Cortisol Within Each Study Group |
To see if morning and evening levels track together on an individual level, a correlation analysis was run between the AM and PM values. Across the entire sample of 100 participants, there was a weak but statistically significant positive correlation, with a Spearman r of 0.246 and a P-value of 0.014 (Fig. 2). Interestingly, this relationship seems to be driven almost entirely by grouping everyone together rather than by any strong pattern within the individual groups themselves. When looking at each group separately, the correlation completely falls apart. Within the cases alone, the Spearman r was just 0.165 with a highly non-significant P-value of 0.254. For the controls, it was even weaker, showing a Spearman r of only 0.048 and a P-value of 0.742. This lack of a strong within-group correlation indicates that a person’s morning peak is a poor predictor of their evening trough, highlighting the degree of individual variation in daily HPA axis activity.
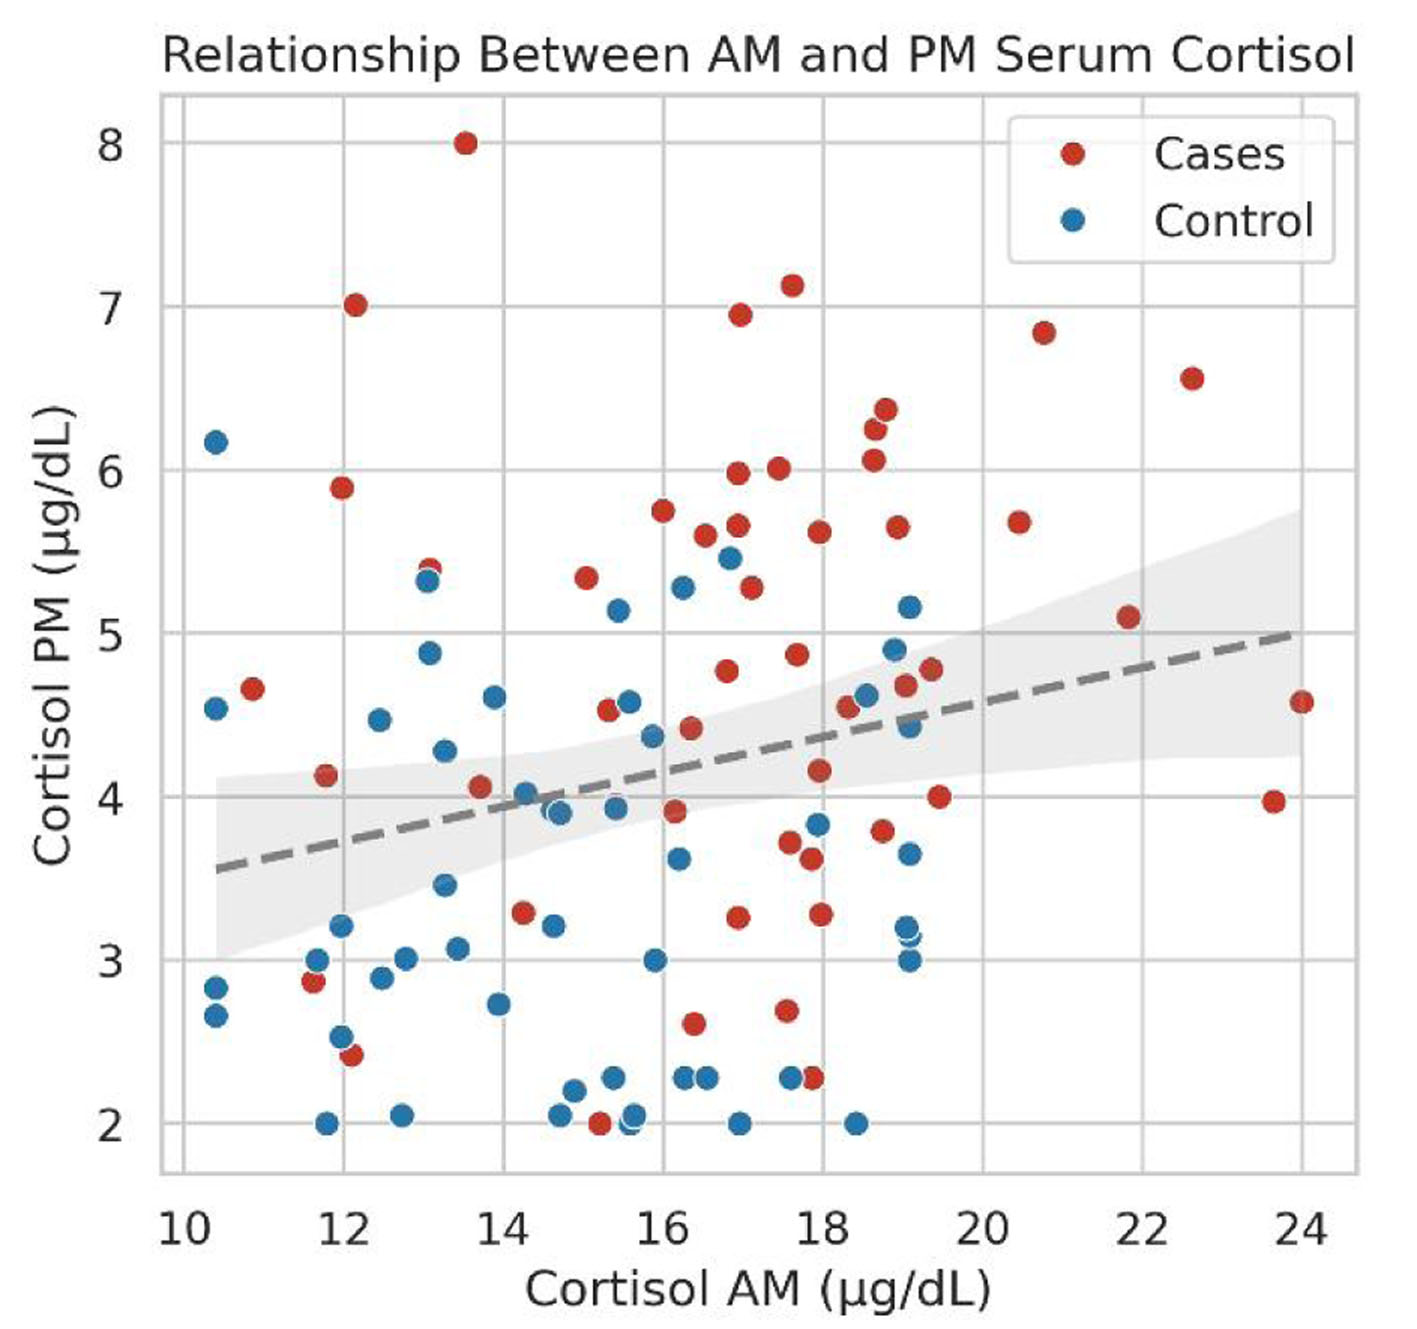 Click for large image | Figure 2. Scatter plot of AM vs. PM cortisol, colored by group, with overall regression line. |
Correlation of cortisol parameters with age and BMI
To make sure that demographic factors like age and BMI were not secretly driving the differences in cortisol patterns, correlation analyses were run across the entire sample and then within each group separately (Table 6). Age showed essentially no relationship with any of the diurnal cortisol parameters. For the overall cohort of 100 people, the Spearman correlation coefficients for age with morning cortisol, evening cortisol, the daily difference, and the diurnal ratio were all extremely close to zero and completely non-significant, with P-values ranging from 0.2189 to as high as 0.6860. This absolute lack of a connection held up even when splitting the files. In the case group alone, the strongest coefficient was a weak positive relationship with the morning-to-evening ratio, but even that sat at a non-significant Spearman r of 0.202 with a P-value of 0.1605. For the controls, the numbers were even closer to flat, with the correlation between age and evening cortisol coming in at an almost non-existent Spearman r of 0.011 and a P-value of 0.9398. These near-zero coefficients show that age simply does not play a role in how these cortisol levels fluctuate throughout the day.
Click to view | Table 6. Correlation of Age and BMI With Cortisol Parameters, Overall and By Study Group |
A very similar story came up when checking the relationship between BMI and the cortisol metrics, with absolutely nothing reaching statistical significance. Looking at the overall sample, the Spearman r values for BMI were all incredibly weak, ranging from −0.097 to 0.093, with the lowest P-value being 0.3392 for the morning-to-evening ratio. No consistent trends have surfaced even in niche study groups, where factors of metabolism like obesity are expected to impact the level of hormones. The only thing like a detected trend was an insignificantly weak negative correlation between BMIs of the participants and the cortisol difference between morning and evening in the case group, with the Spearman coefficient being equal to −0.255 and the P-value equal to 0.0745. Among the healthy subjects, the relation between BMI and the daytime difference was weakly positive, with the coefficient being equal to 0.198 and the P-value of 0.1671. Since every single one of these tests produced P-values well above the standard 0.05 threshold, it is safe to say that BMI and age are not confounding the endocrine results, meaning that these variables do not need to be over-interpreted.
Cortisol characteristics and multivessel CAD
Looking strictly within the case group of 50 patients, there was a clear split with 37 patients testing positive for multivessel CAD and 13 testing negative (Table 7, Figs. 3 and 4). According to the data collected regarding the raw levels of cortisol in the morning and in the evening, no statistically significant differences were detected. In terms of morning cortisol levels, the average of multivessel-positive patients was measured to be 16.79 ± 3.14 µg/dL, and of those patients without multivessel disease, 17.61 ± 2.58 µg/dL (mean difference −0.82 µg/dL, 95% CI −2.77 to 1.13), which does not show any meaningful results, with a P-value of 0.40. Similarly, the same tendency was found in the evening cortisol levels, where multivessel-positive and multivessel-negative cases had averages of 4.68 ± 1.51 and 5.15 ± 0.97 µg/dL, respectively (mean difference −0.47 µg/dL, 95% CI −1.37 to 0.43), leading to a P-value equal to 0.29. These findings suggest that unadjusted AM and PM cortisol values alone do not distinguish patients with multivessel disease from those without it.
Click to view | Table 7. Diurnal Serum Cortisol Parameters Stratified by Multivessel Coronary Artery Disease Status Within the Case Cohort (n = 50) |
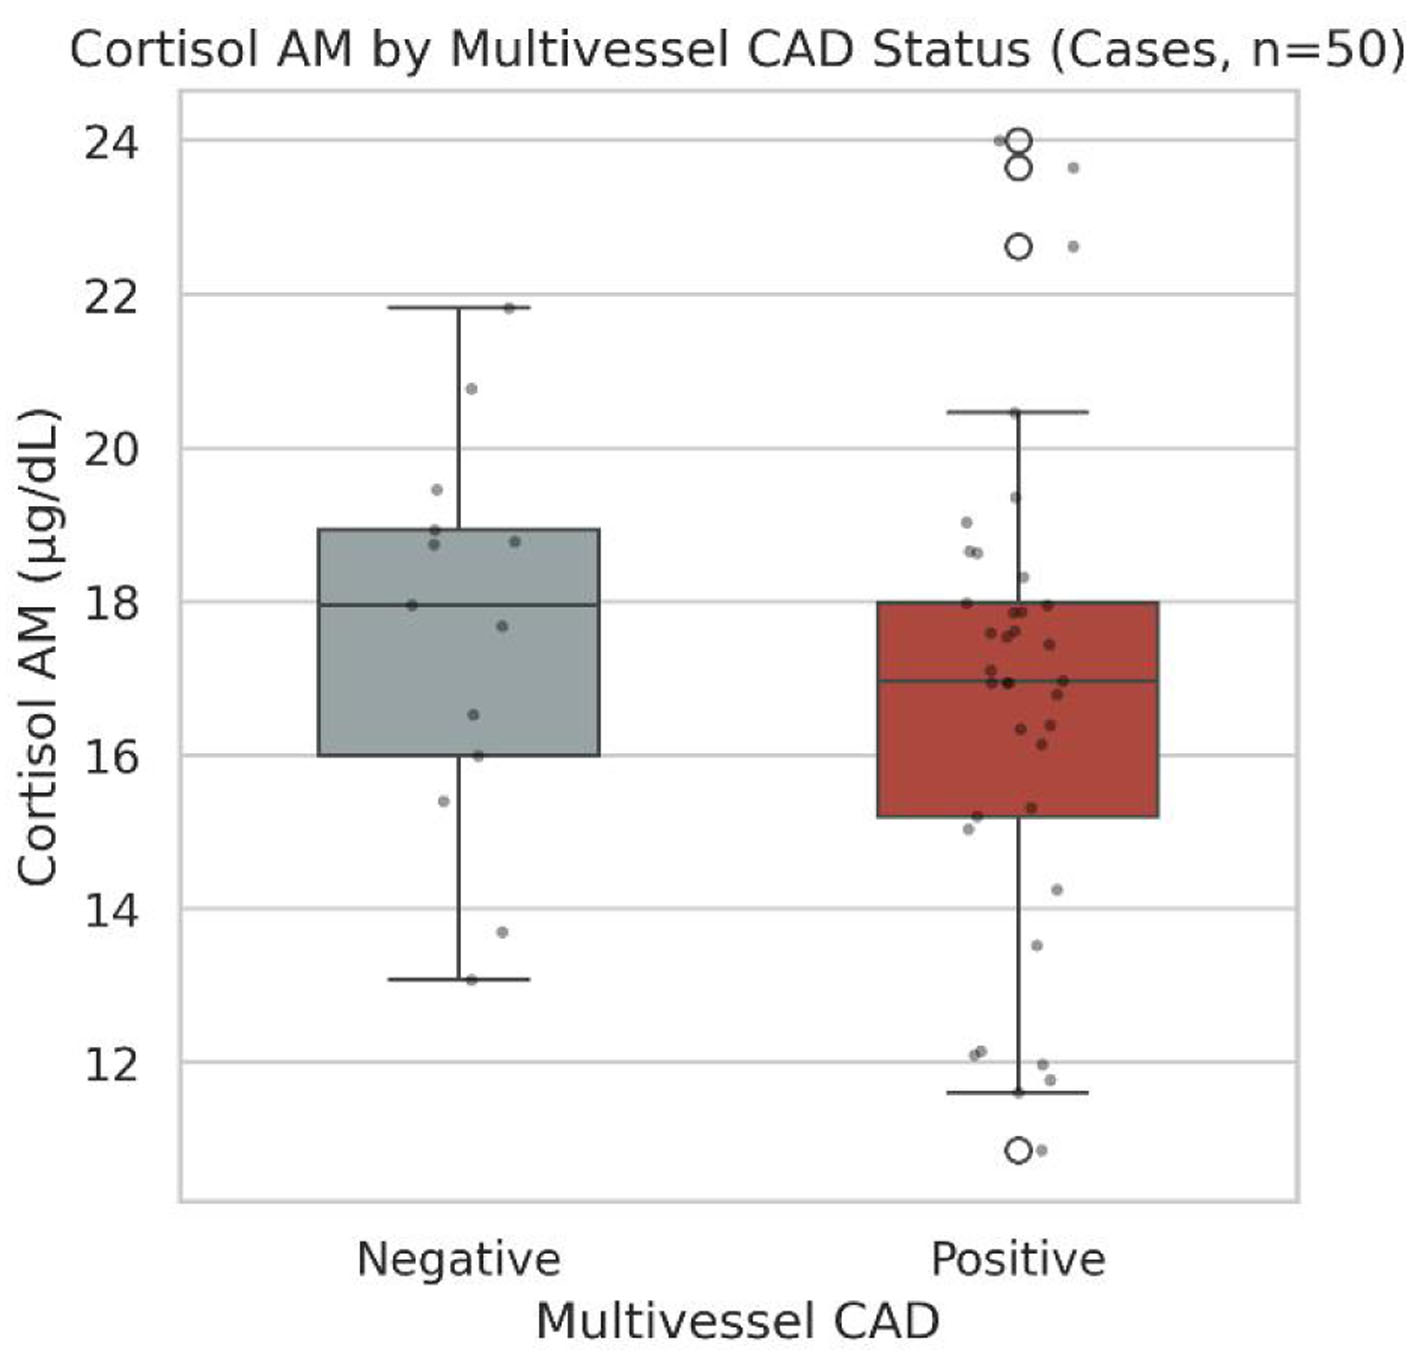 Click for large image | Figure 3. Cortisol AM by multivessel CAD status. AM: morning; CAD: coronary artery disease. |
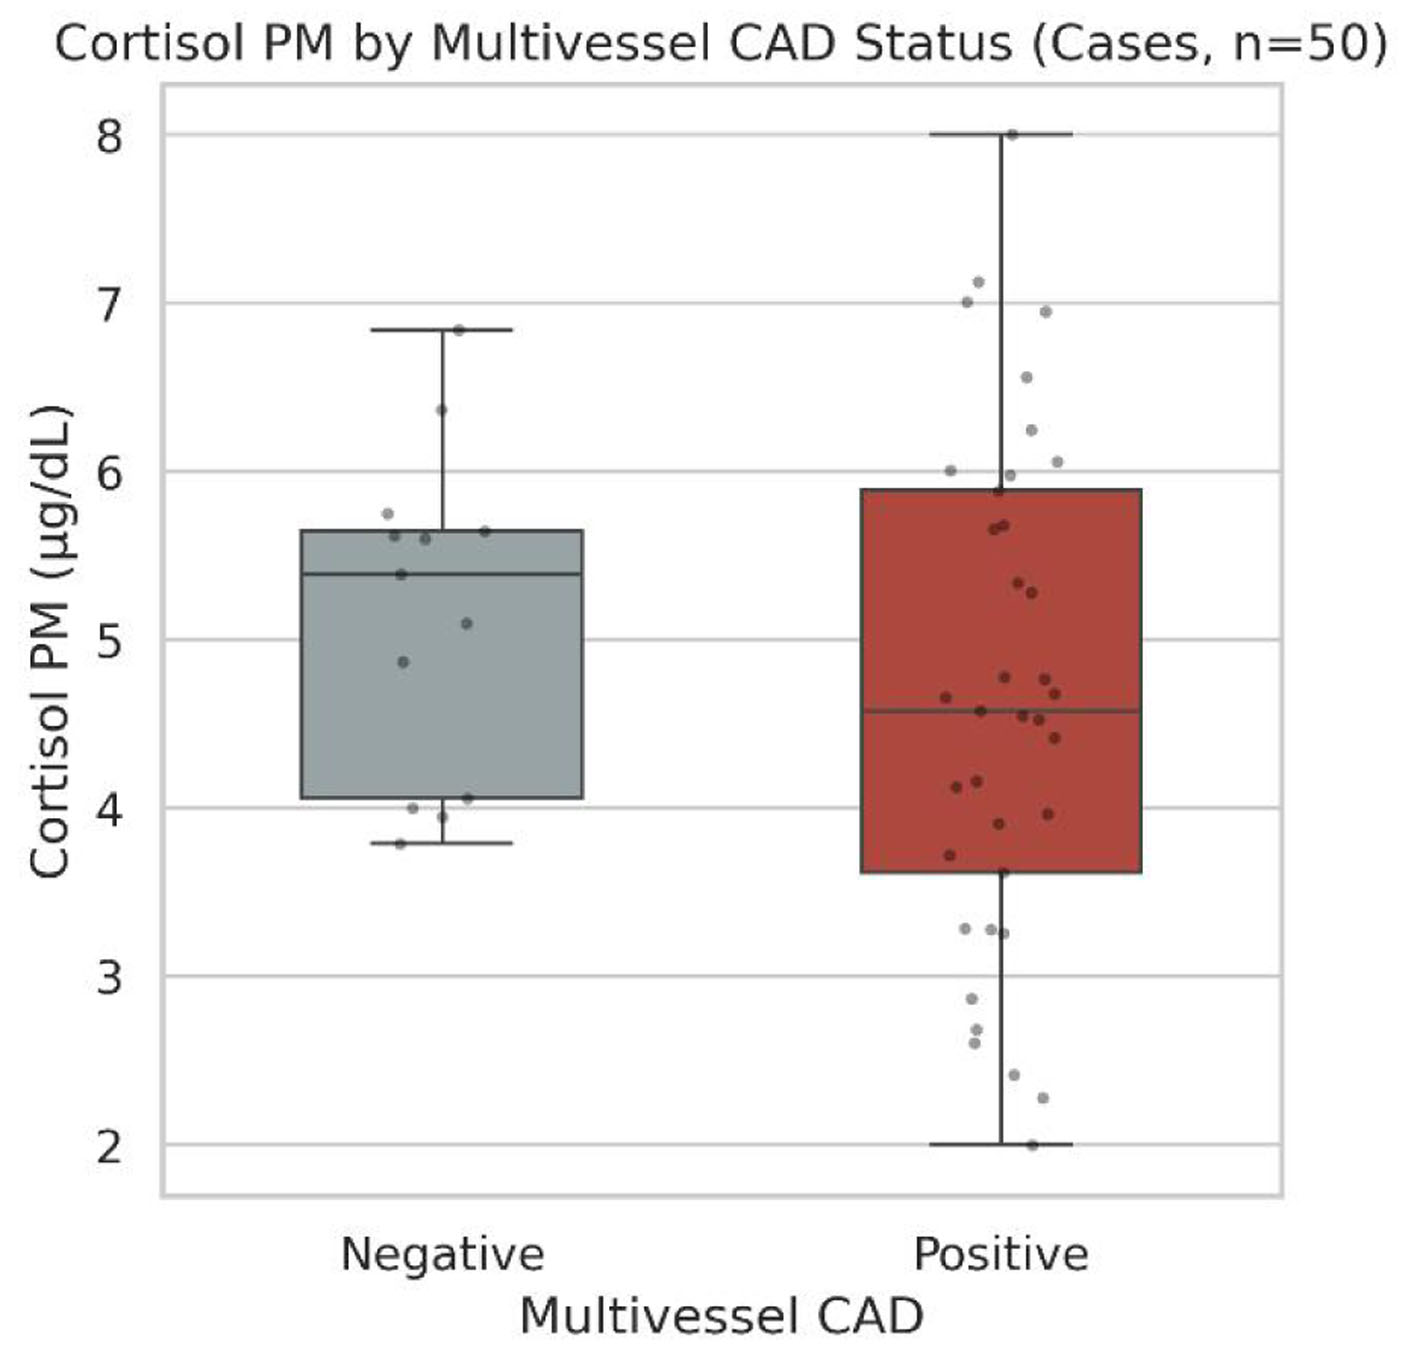 Click for large image | Figure 4. Cortisol PM by multivessel CAD status. CAD: coronary artery disease; PM: evening. |
The calculated rhythm parameters did not do any better at separating the groups in these unadjusted, raw comparisons. Between the groups, the absolute difference in cortisol levels from morning to evening was almost the same, as multivessel-positive individuals dropped their levels by 12.11 ± 3.37 µg/dL and multivessel-negative individuals by 12.46 ± 2.51 µg/dL (mean difference −0.35 µg/dL, 95% CI −2.41 to 1.71), with a resulting P-value of 0.74. Looking at the relative AM-to-PM cortisol ratios, the positive group had a median ratio of 3.70, and the negative group had a ratio of 3.35. This slight difference also completely failed to reach statistical significance, with a P-value of 0.36. Overall, these raw, univariable tests suggested that although diurnal cortisol was markedly disrupted in this combined diabetic and depressed cohort compared with controls, no statistically significant association was detected between the individual cortisol metrics and the extent of coronary atherosclerosis in these baseline comparisons.
Cortisol characteristics and obstructive CAD
Moving on to the secondary endpoint, the case cohort of 50 patients was split into 19 patients with hemodynamically obstructive CAD and 31 patients without it (Table 8, Figs. 5 and 6). Just like the multivessel analysis, none of the raw cortisol concentrations showed any statistically significant differences when compared by obstructive status. There were no significant differences in the amounts of morning cortisol between the groups: 17.21 ± 2.55 µg/dL for the obstructive-positive group; 16.87 ± 3.28 µg/dL for the obstructive-negative group (P = 0.6978; mean difference 0.34 µg/dL, 95% CI −1.43 to 2.11). There was not much of a difference among evening values either. The mean PM cortisol level in the obstructive-positive group was 4.64 ± 1.34 µg/dL, while the obstructive-negative group was 4.90 ± 1.45 µg/dL, obtained a P-value of 0.5246 (mean difference −0.26 µg/dL, 95% CI −1.09 to 0.57). In stark contrast to other highly significant findings, the results of these simple, isolated blood draws clearly show they are not any more likely to distinguish between severe, flow-limiting arterial blockages and milder, non-obstructive plaques in the arteries.
Click to view | Table 8. Diurnal Serum Cortisol Parameters Stratified by Obstructive Coronary Artery Disease Status Within the Case Cohort (n = 50) |
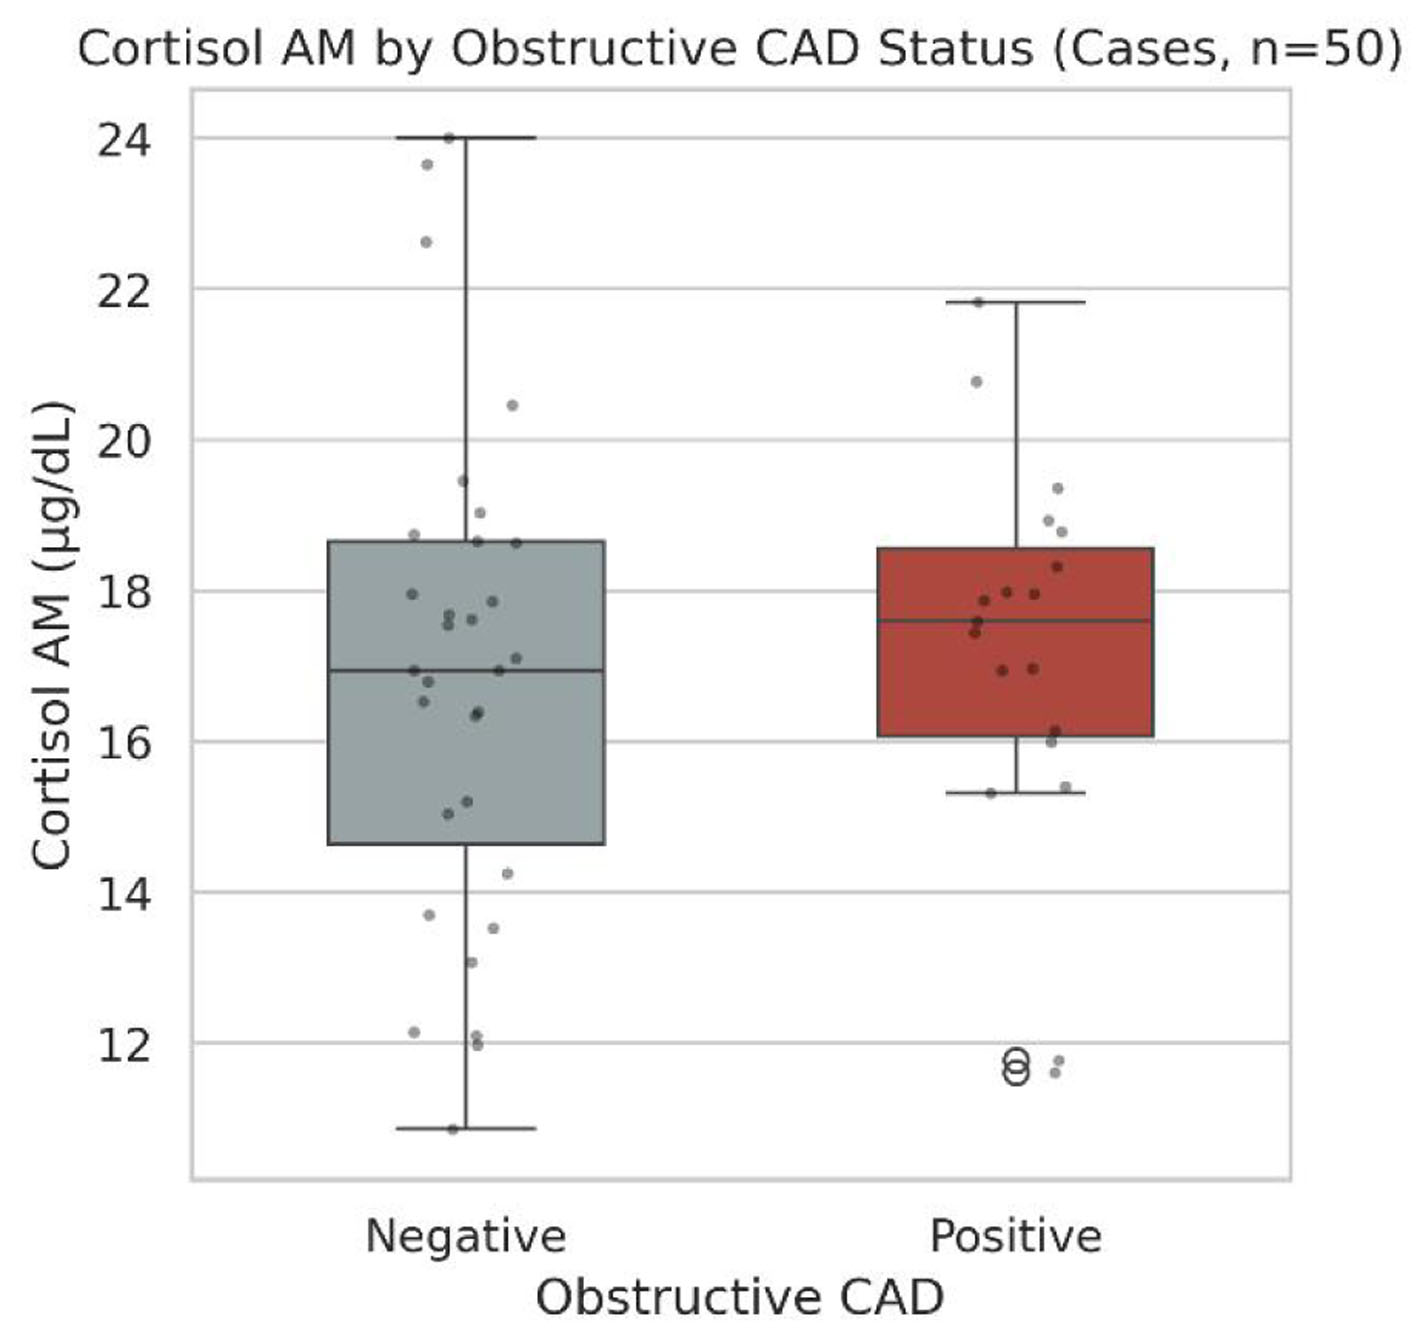 Click for large image | Figure 5. Cortisol AM by obstructive CAD status. AM: morning; CAD: coronary artery disease. |
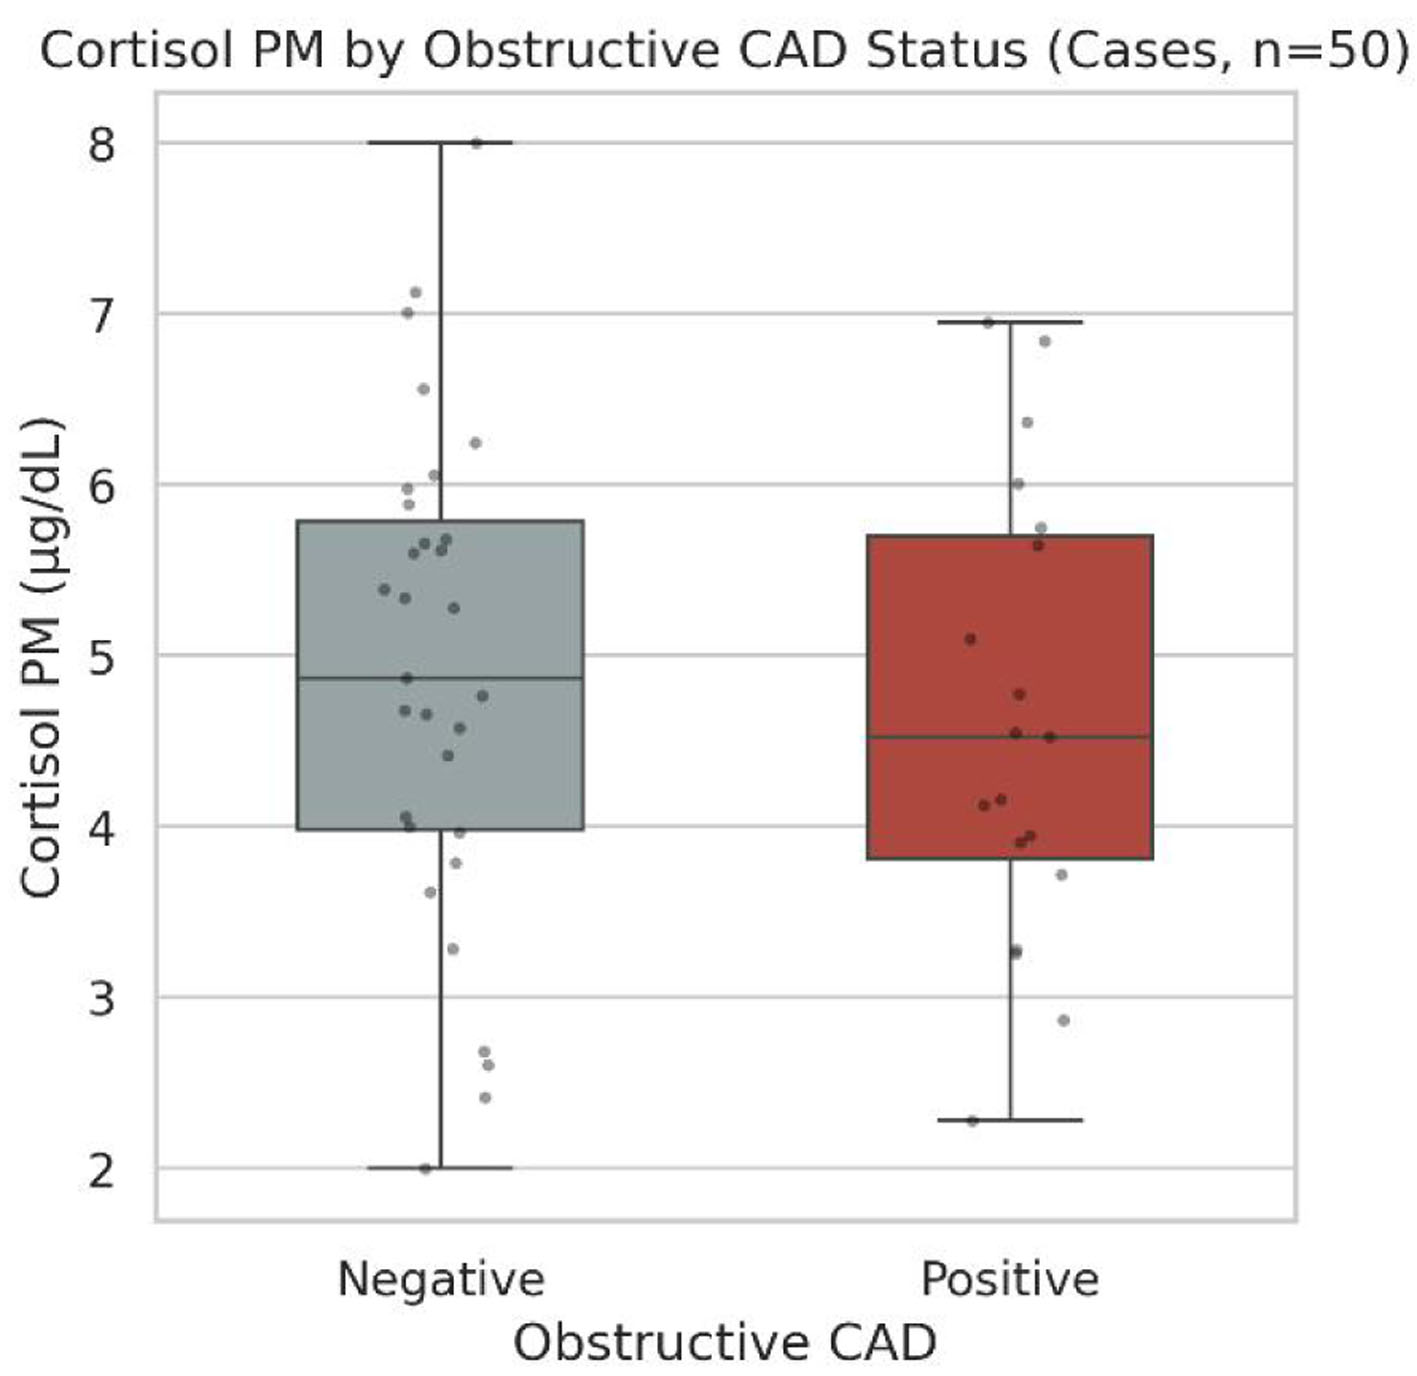 Click for large image | Figure 6. Cortisol PM by obstructive CAD status. CAD: coronary artery disease; PM: evening. |
There were also no statistically significant differences between the obstructive and non-obstructive groups for the parameters calculated for diurnal periods. The mean AM–PM cortisol difference was 12.58 ± 2.35 µg/dL in patients with obstructive disease and 11.97 ± 3.57 µg/dL in patients without obstructive disease (P = 0.5136; mean difference 0.61 µg/dL, 95% CI −1.25 to 2.47). The same was true for the relative AM/PM cortisol ratio.
Median AM/PM ratios for the patients in the obstructive-positive and obstructive-negative groups were 4.03 (IQR: 2.99–4.30) and 3.45 (IQR: 2.89–4.90), respectively, with a Mann–Whitney U P-value of 0.5622.
Overall, these raw comparisons confirm that stress biology differs markedly between the comorbid case group and controls, but in unadjusted, univariable testing, no statistically significant association was detected between any of these cortisol metrics and the presence of hemodynamically obstructive coronary disease.
Predictors of multivessel CAD: exploratory logistic regression analysis
Because only 13 multivessel-CAD-negative cases were available for eight covariates (events per variable < 2), all regression results in this section are exploratory and hypothesis-generating, and the width of the CIs should be weighed more heavily than the P-values. To see if any of these cortisol parameters do anything in terms of predicting multivessel disease, binary logistic regression models were built (Table 9, Fig. 7). In the unadjusted, univariate analyses, absolutely none of the individual cortisol parameters showed a statistically significant association with the presence of multivessel CAD. For example, the morning cortisol levels resulted in an OR of 0.910 (95% CI 0.732–1.131, P = 0.394), while the same was true for the evening levels, with an OR of 0.776 (95% CI 0.484–1.242, P = 0.290). Moreover, the comparison between the morning and evening levels, as well as the ratio of the two measurements, is similar. The ORs were 0.965 (95% CI 0.787–1.184, P = 0.732) for the AM–PM difference and 1.342 (95% CI 0.786–2.289, P = 0.281) for the AM/PM ratio. Thus, by itself, the acute level of any endocrine factor does not provide a definite relationship to the atherogenesis process in several vessels of this cohort.
Click to view | Table 9. Univariate and Multivariate Logistic Regression for Multivessel CAD, Exploratory Model |
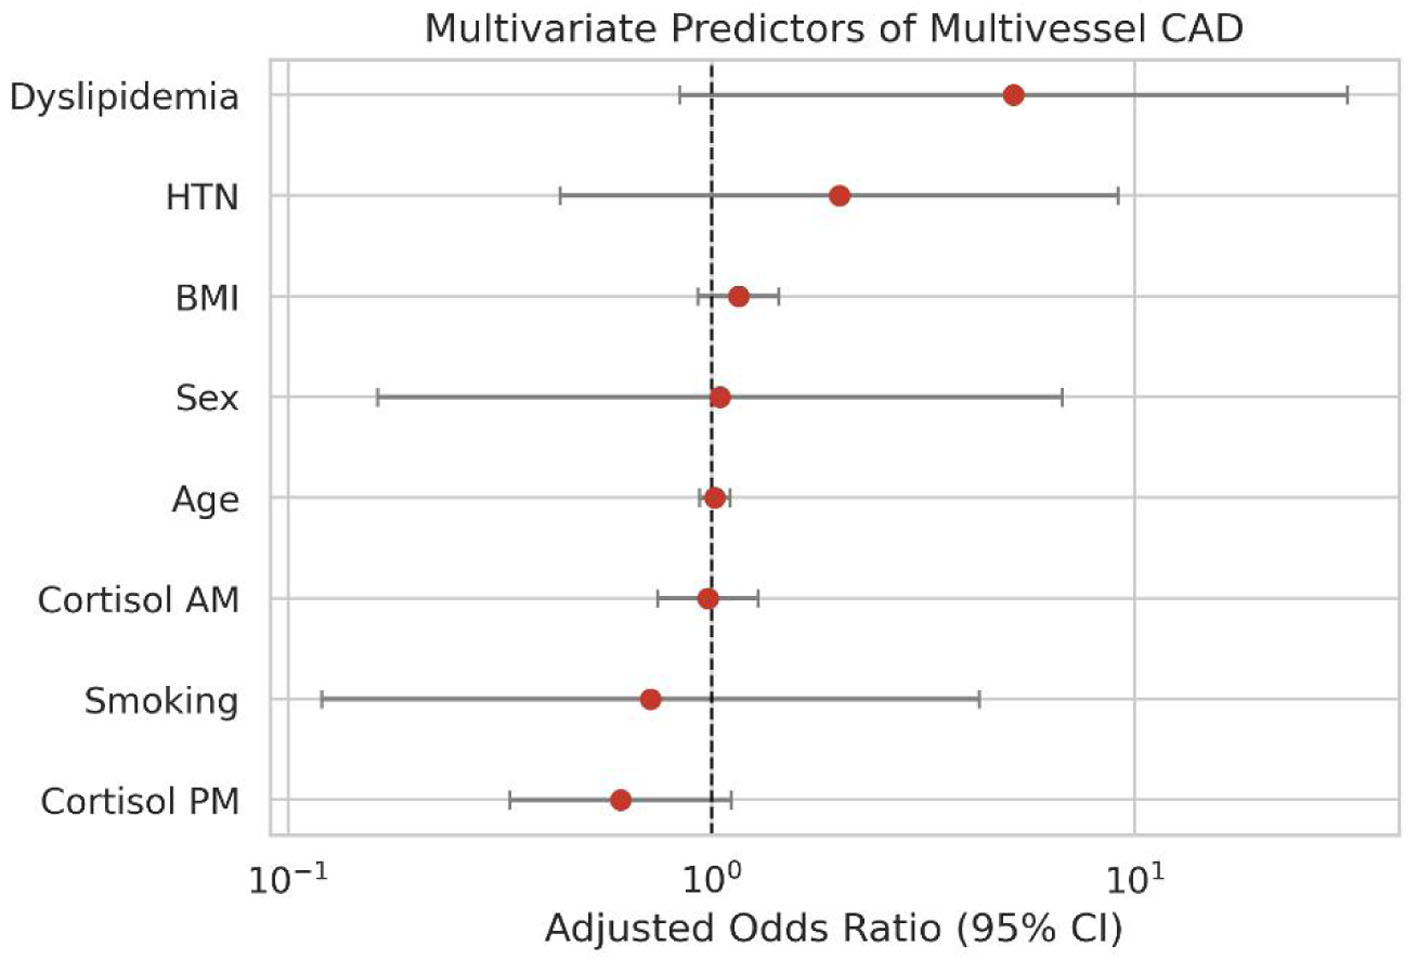 Click for large image | Figure 7. Forest plot of adjusted odds ratios for multivessel CAD. CAD: coronary artery disease. |
After this, an exploratory multivariable logistic regression model was created to adjust for clinical variables, such as age, sex, BMI, hypertension, dyslipidemia, smoking, morning cortisol, and evening cortisol. When these large clinical cardiovascular risk factors were adjusted for, none of the variables met the criteria for statistical significance. The aORs for both morning and evening cortisol were not significant: 0.981 (95% CI 0.747–1.289, P = 0.892) and 0.610 (95% CI 0.334–1.113, P = 0.107), respectively. The only variable in the whole model that had a somewhat significant association was dyslipidemia (adjusted OR 5.18, 95% CI 0.84–31.8, P = 0.076). The very wide CI here is testimony to the fact that there was low statistical power in the 50-patient case cohort, but this borderline trend should be regarded only as a hypothesis-generating signal for future, larger studies.
Predictors of obstructive CAD: exploratory logistic regression analysis
Like the multivessel findings, evaluating predictors for obstructive CAD did not turn up any significant cortisol-related predictors (Table 10, Fig. 8). In the univariate models, none of the individual endocrine parameters showed a statistically significant link to hemodynamically obstructive blockages. Morning cortisol came in with an OR of 1.04 (95% CI 0.857–1.262, P = 0.6911), and evening cortisol was also highly non-significant with an OR of 0.871 (95% CI 0.574–1.321, P = 0.5162). Even the calculated diurnal parameters, like the AM to PM absolute difference (OR 1.065, 95% CI 0.884–1.284, P = 0.5058) and the diurnal ratio (OR 1.104, 95% CI 0.727–1.675, P = 0.6433), failed to show any predictive value in these raw comparisons. In the exploratory adjusted model controlling for the standard cardiovascular risk factors, both morning and evening cortisols were statistically insignificant: adjusted OR 1.188 (95% CI 0.920–1.533, P = 0.1872) and 0.740 (95% CI 0.413–1.327, P = 0.3123), respectively. These results suggest that isolated cortisol levels and diurnal ratio indices do not, on their own, reliably identify flow-limiting coronary blockages in this cohort.
Click to view | Table 10. Univariate and Multivariate Logistic Regression Analysis for Predicting Obstructive Coronary Artery Disease Presence Within the Case Cohort (n = 50), Exploratory Model |
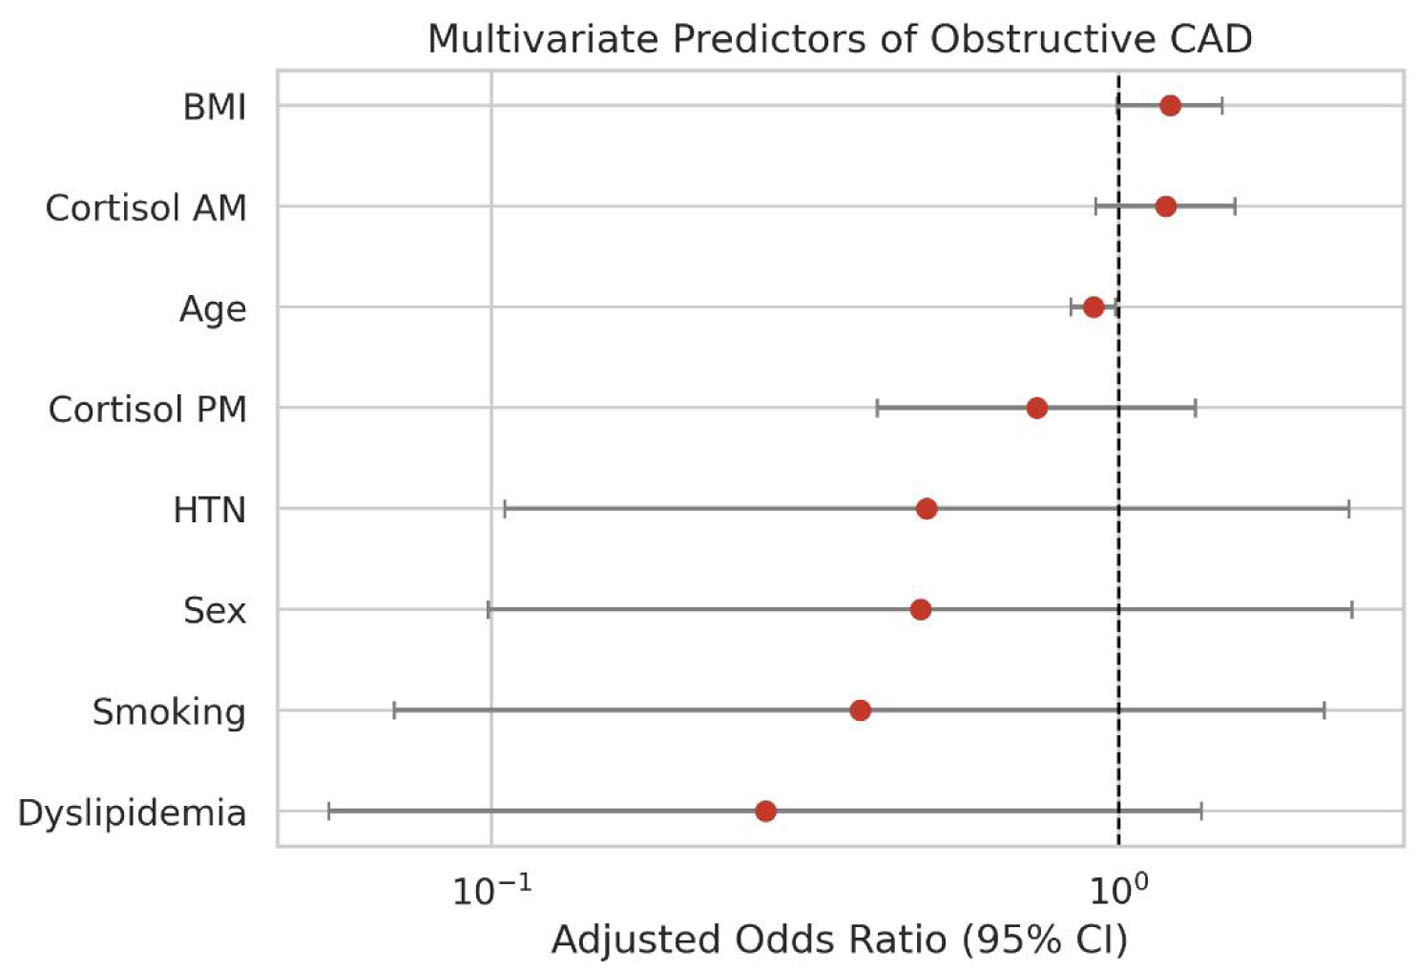 Click for large image | Figure 8. Forest plot of adjusted odds ratios for obstructive CAD. CAD: coronary artery disease. |
Only one variable (patient age) in the adjusted model remained statistically significant. Interestingly, there was a small but significant inverse association with obstructive disease, which was observed with older age, with an adjusted OR of 0.91 (95% CI 0.84–0.99, P = 0.030). This study’s conclusions should be taken with extreme caution, as the 50-patient case cohort was a retrospective study and was not very powerful, and it should not be interpreted as a protective effect of age: with only 19 events for eight covariates, the estimate is unstable and may reflect chance or model overfitting. This inverse association likely reflects a clinical selection bias, where younger patients with severe diabetes and chronic depression might have had a faster, more aggressive onset of vasculopathy to be referred for angiography in the first place, or it could simply be a confounding byproduct of other unmeasured variables. BMI exhibited a borderline, almost significant positive correlation, with the aOR being 1.208 (95% CI 0.995–1.466, P = 0.0557), which is a valid cardiometabolic element that needs further analysis in bigger studies in the future.
Diagnostic performance of cortisol parameters (exploratory ROC analysis)
To evaluate how well these diurnal cortisol parameters can screen for or predict physical CAD, receiver operating characteristic (ROC) curve analyses were run for both cardiac endpoints (Table 11, Figs. 9 and 10). Across the board, the resulting area under the curve (AUC) values showed that these stress hormone metrics are weak-to-modest discriminators, with AUCs ranging from 0.39 to 0.59, and the 95% CI of every AUC included 0.50. Out of all the variables tested, the morning-to-evening cortisol ratio performed the best when trying to identify patients with multivessel disease, yielding the highest overall AUC of 0.586, with a 95% CI spanning from 0.427 to 0.743. In contrast, raw morning and evening cortisol yielded AUCs of 0.390 and 0.403 (95% CI 0.215–0.585 and 0.237–0.574), respectively, both below the 0.50 line expected by chance, indicating essentially no discriminatory ability for multivessel disease in this cohort. The values for the absolute morning–evening cortisol difference were not particularly good either, yielding an AUC of 0.468 (95% CI 0.296–0.656). Such poor results clearly signify the absence of effective diagnostic ability for each of the parameters in isolation.
Click to view | Table 11. Exploratory ROC/AUC Diagnostic Performance of Diurnal Serum Cortisol Parameters for Predicting Multivessel and Obstructive Coronary Artery Disease Presence (Cases Only, n = 50) |
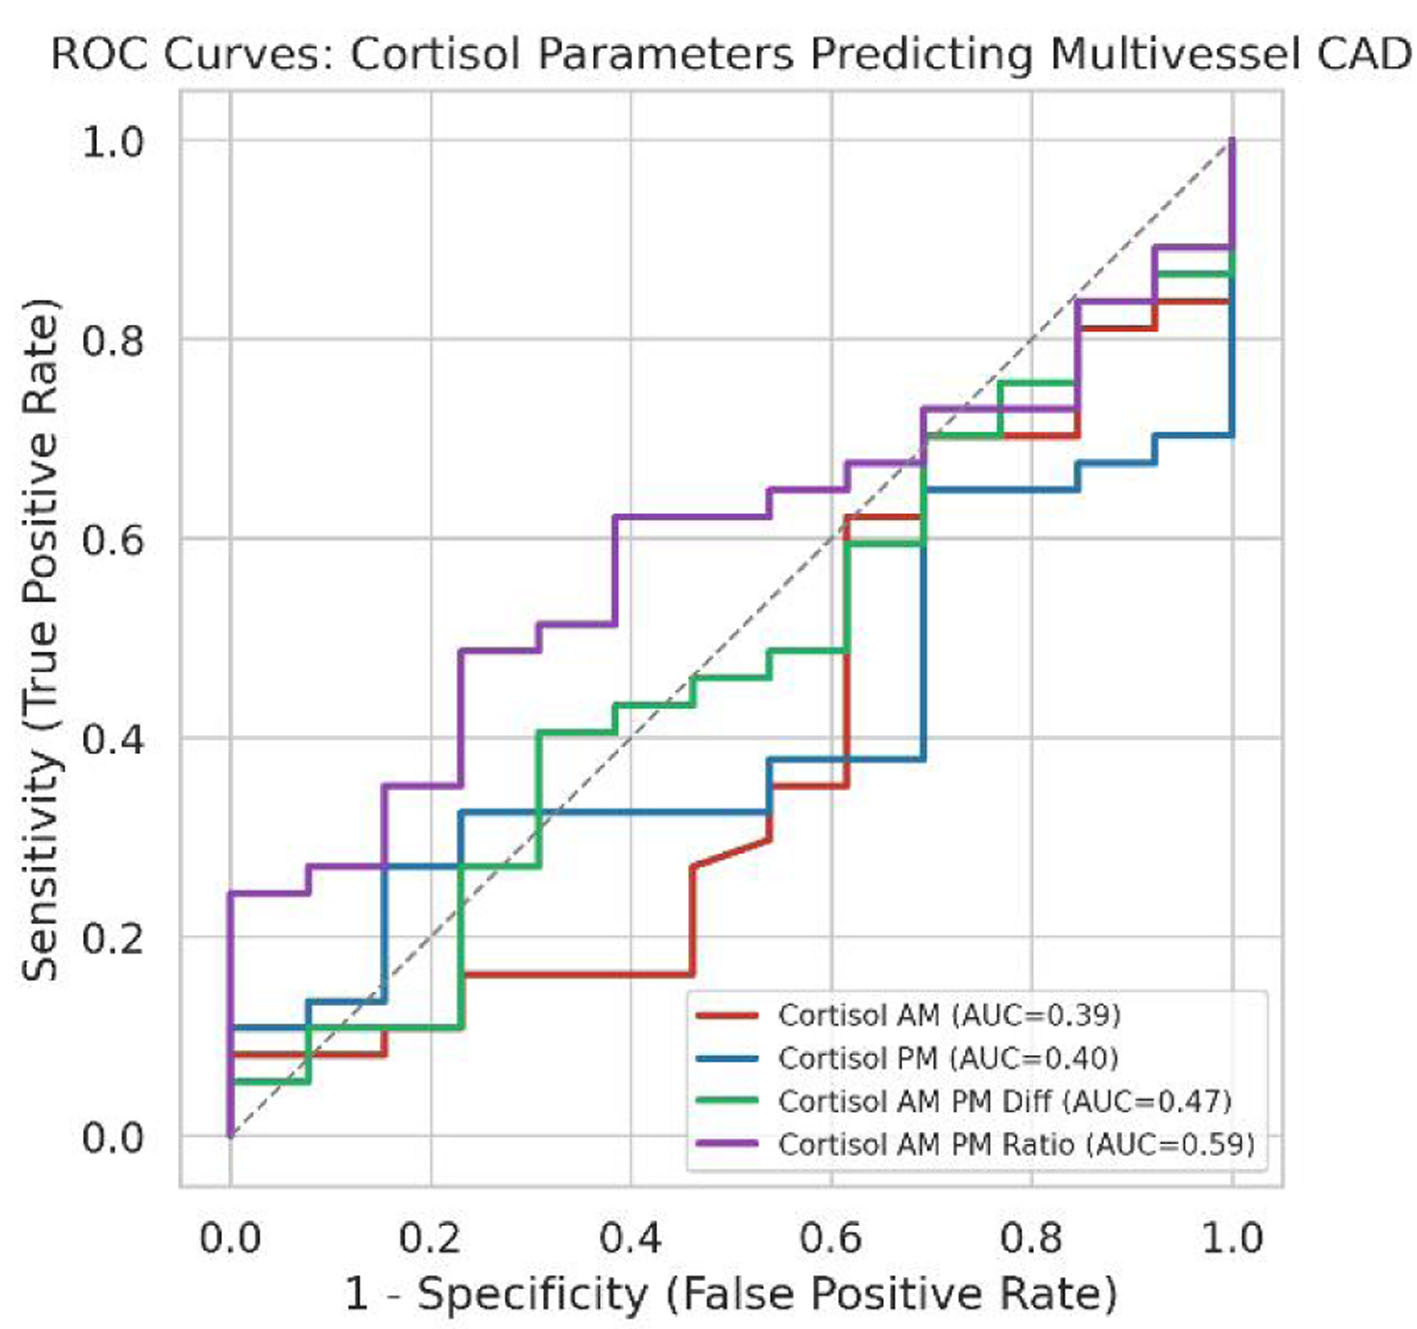 Click for large image | Figure 9. ROC curves for cortisol parameters predicting multivessel CAD. CAD: coronary artery disease; ROC: receiver operating characteristic. |
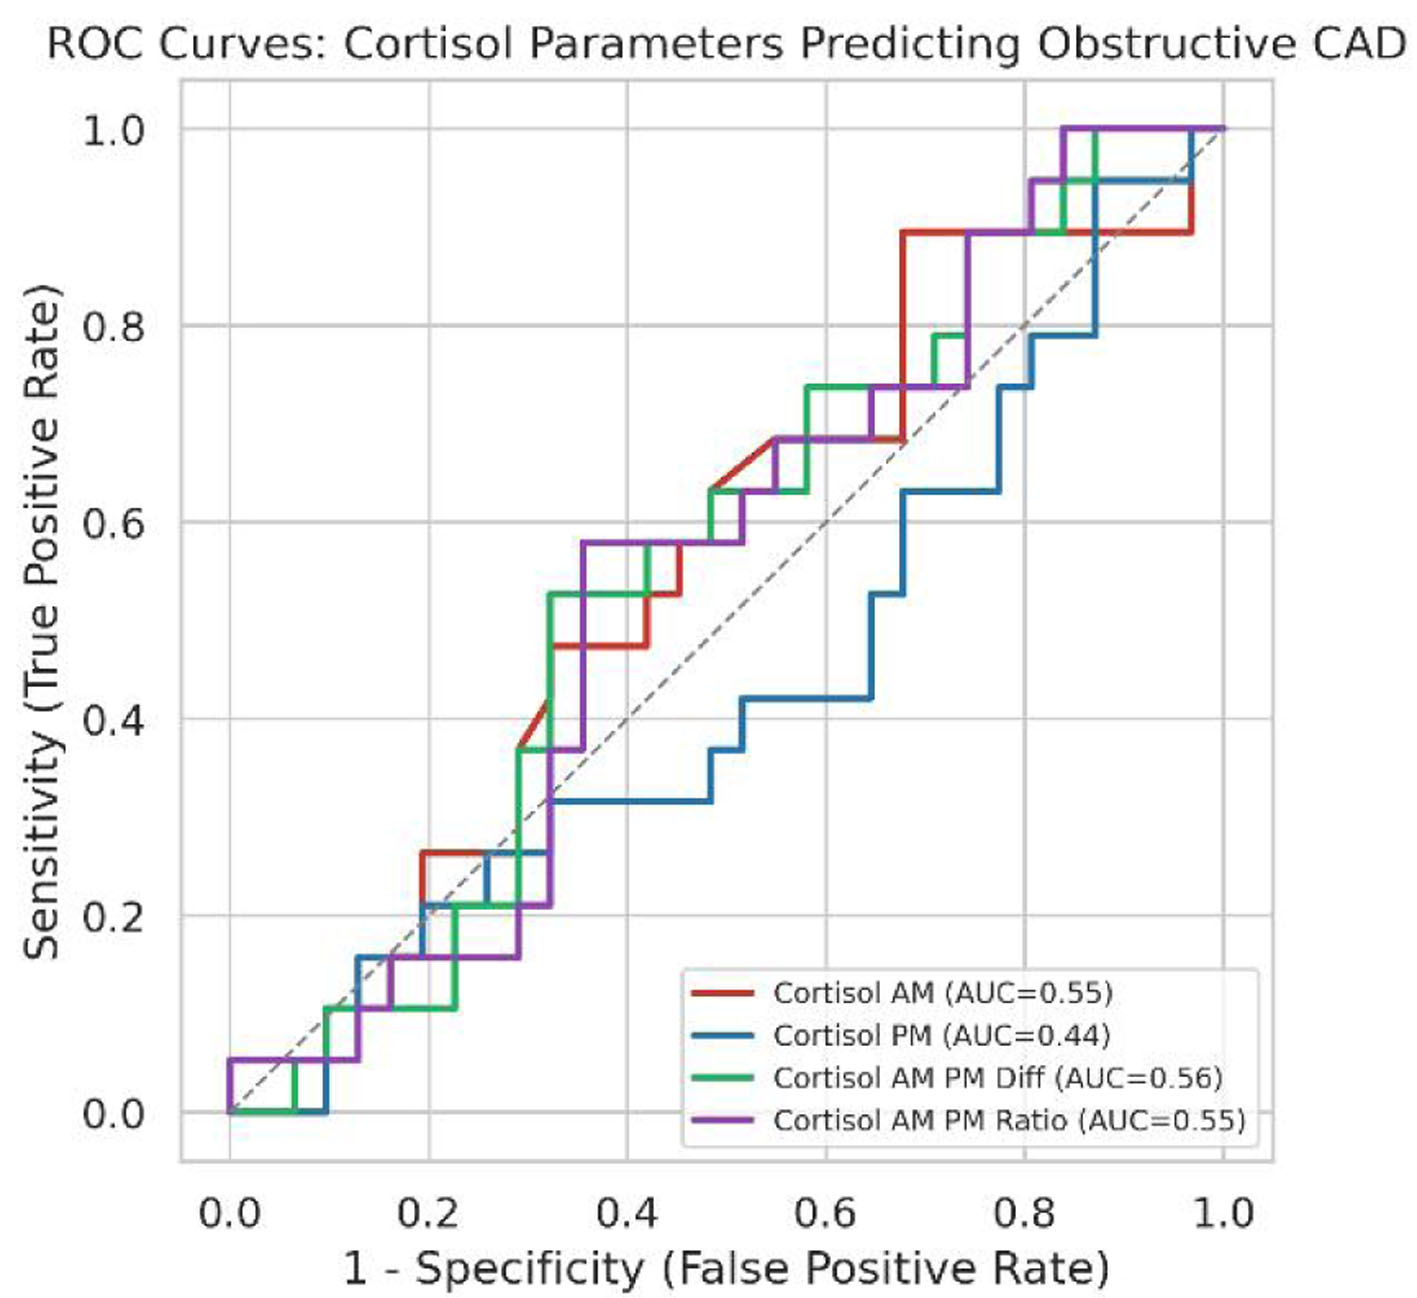 Click for large image | Figure 10. ROC curves for cortisol parameters predicting obstructive CAD. CAD: coronary artery disease; ROC: receiver operating characteristic. |
Considering the secondary endpoint of obstructive CAD, the discrimination metrics did not do very well, with AUCs close to 0.500, varying from the lowest score of 0.438 (95% CI 0.276–0.609) obtained with the evening cortisol analysis to the highest score of 0.557 (95% CI 0.389–0.715) obtained with the absolute difference between the morning and evening tests. Exploratory Youden-derived thresholds are presented for completeness, but as these have not been externally validated, the cut-offs described should not be read as reliable diagnostic profiles. For instance, applying a morning-to-evening ratio cut-off of 4.03 to predict multivessel disease is associated with a very low 48.6% sensitivity while keeping a specificity of 76.9% (95% CIs 33.4–64.1% and 49.7–91.8%, respectively). At the same time, with an evening cortisol cut-off of 2.87 µg/dL used to predict obstructive disease, one can achieve a very high 94.7% sensitivity, but at the expense of very low specificity of only 12.9% (95% CIs 75.4–99.1% and 5.1–28.9%, respectively). Because of these highly unbalanced sensitivities and specificities, none of these parameters can realistically support clinical use as standalone diagnostic tools. The small sample size of 50 case patients makes these metrics far too volatile for real-world diagnostic decision-making.
| Discussion | ▴Top |
Interpretation of findings
The main clinical takeaway from this analysis is that while HPA axis disruption is incredibly obvious when comparing the diabetic and depressed patients to healthy controls, this biological disruption does not map directly onto physical CAD burden. There is significant evidence that patients suffering from both chronic depression and diabetes experience subclinical hyperactivity, as reflected in their morning levels of cortisol, which stand at an average of 17.00 ± 3.00 µg/dL, while their evening cortisol levels are usually measured at a median of 4.72 µg/dL. Therefore, the lack of serious deviations in cortisol levels throughout the day is evident in this group’s daily ratio of only 3.56. However, close examination of the data of the examined 50 patients shows that none of these factors are linked to the presence of CAD, whether obstructive or multivessel. In the raw, univariable comparisons, morning cortisol, evening levels, the diurnal difference, and the ratio were all statistically indistinguishable between patients with and without significant coronary blockages. Shifting to the fully adjusted multivariate logistic regression models did not change this picture, as all cortisol parameters remained completely non-significant. In these exploratory models, the only variables showing any signal were dyslipidemia, which had a borderline positive association with multivessel disease (aOR of 5.18, 95% CI 0.84–31.8, P = 0.0757), and patient age, which showed a small, significant inverse association with obstructive disease (aOR of 0.912, 95% CI 0.84–0.99, P = 0.03). This finding about age is rather surprising and seems to indicate a possible referral bias in a retrospective chart analysis, where patients who are younger and suffer from severe psychiatric and metabolic comorbidities have been referred for angiography earlier than older and relatively stable patients.
Comparison with prior studies
Comparing these results to existing literature reveals some fascinating alignments and several key points of contrast. The elevated baseline morning cortisol of 17.00 µg/dL in the case group matches up perfectly with a recent study by Abbas et al [1], which reported that patients with type 2 diabetes and comorbid depressive symptoms have significantly higher morning cortisol levels that correlate directly with poorer glycemic control and lower insulin levels. This biochemical overlap makes perfect physiological sense, since cortisol is a potent glucocorticoid that opposes insulin action and promotes hyperglycemia, thus compounding metabolic stress. However, when moving from metabolic markers to actual physical vascular blockage, the clinical picture gets much more complicated. For instance, Degroote et al [16] demonstrated that lower diurnal daytime cortisol activity and a reduced cortisol awakening response predicted an increased future risk of coronary heart disease in hypertensive men. The high levels of hyperactive background patterns from the cohort who suffer from depression and diabetes are different from the low levels observed in the studies, but from both studies, the lower-than-normal diurnal rhythm is a risk factor for cardiovascular diseases. This pattern of subclinical hypercortisolism accompanied by a flattened daily decline is also heavily supported by Sagmeister et al [10] and Ortiz et al [11] who note that chronic, low-grade endocrine dysregulation is a common feature in progressive metabolic and inflammatory diseases. Additionally, Xu et al [2] have shown that chronic depression functions as an independent risk factor for coronary heart disease, potentially through prolonged autonomic nervous system and HPA axis dysfunction promoting vascular lesion development.
Implications of the study
The clinical and practical implications of this study are direct, particularly for clinicians trying to evaluate cardiovascular risk in high-risk populations. Given that the ROC analysis yielded weak-to-modest diagnostic performance across the board, with AUC values for every cortisol parameter hovering in a poor range between 0.39 and 0.59 (all 95% CIs including 0.50), these results indicate that isolated serum cortisol measurements have limited utility as standalone diagnostic tools for physical coronary artery blockages. Clinicians simply cannot rely on a spot morning or evening venous blood draw to predict whether a high-risk patient has extensive multivessel plaque or hemodynamically obstructive lesions [22]. This diagnostic mismatch suggests that the biological pathway linking psychological stress to physical coronary atherosclerosis is not as simple as having a high hormone level on a given day. In contrast, the vascular damage caused by stress is possibly an ongoing, progressive process that is influenced by metabolic syndrome, glucocorticoid-driven visceral adiposity, and autonomic and endothelial dysfunction [23, 24]. This is consistent with Oo et al [5], who noted that metabolic parameters also contribute to cortisol-related cardiovascular risk, and with Zhang and Qin [8], who reported that HPA axis dysfunction is often associated with chronic sleep disorders.
Future work and recommendations
Although the results are clinically relevant, there are significant shortcomings that need to be addressed to properly contextualize these findings. The first limitation is that the number of cases analyzed in the coronary endpoint section was only 50, which considerably limits the ability of the multivariate models to carry out reliable statistical analysis. That is why the results observed from the regression models are often accompanied by rather large CIs, especially for the dyslipidemia covariate, which has CIs varying from 0.84 to 31.8. Another serious limitation here is the fact that only single-day blood sampling has been performed to detect the cortisol levels in the blood, as the serum concentration of the substance is very likely to be affected by some short-term episodes of increased stress because of the blood collection. Thus, the acute stress blood measurement might have masked the long-standing diurnal rhythm. More fundamentally, two serum cortisol measurements obtained on a single day cannot capture cumulative cortisol exposure: they reflect total, largely protein-bound cortisol at only two time points, are sensitive to the timing of sampling relative to waking, recent stressors, and medication, and do not account for day-to-day variability in HPA-axis activity. In addition, the retrospective nature of this study meant that data about coronary CT angiography, including the Agatston calcium scores, calcium volumes, and specific plaque characteristics, were not available to researchers for the analysis [25]. Future prospective, multi-center studies adequately powered for multivariable modeling should therefore (1) use repeated salivary cortisol sampling over several consecutive days, including samples at awakening, 30–45 min after awakening (cortisol awakening response), and at bedtime, with objective verification of sampling times as recommended by expert consensus guidelines [26]; (2) measure hair cortisol, which integrates systemic cortisol exposure over the preceding months and provides a retrospective index of chronic glucocorticoid burden [27, 28]; and (3) characterize coronary atherosclerosis comprehensively with coronary CT angiography, including the Agatston coronary artery calcium score, total and non-calcified plaque volume, high-risk plaque features, and standardized CAD-RADS 2.0 categories of stenosis and plaque burden [29]. Coupling these cumulative endocrine measures with comprehensive coronary phenotyping would allow the transition from chronic stress physiology to coronary atherosclerosis to be mapped more definitively.
Limitations
Before making any broad clinical conclusions, some important limitations of the dataset need to be discussed. First and foremost, the major problem is the sample size of the endpoint for CAD, which included just 50 people in the case group. With only 50 patients, this limits the overall statistical power because multivariate models are run with this variable. This is why there are such large CIs for the regression models, and hence, clinical conclusions cannot be drawn easily. The second limitation is that there is an important absence of coronary imaging data as well. While the protocol of the study included an extensive evaluation of coronary CT angiography, some important parameters were missing from the dataset, such as Agatston calcium score, calcium volume, and characteristics of plaque per segment. Therefore, advanced plaque evaluation was not possible, and coronary burden assessment was based solely on traditional coronary angiography data. Sticking to these limited records means the true complexity of the coronary atherosclerotic burden could not be fully captured. These gaps make it clear that any clinical interpretations of the current modeling must remain strictly exploratory.
Third, body habitus was characterized only by BMI. Thoracic anthropometry and chest shape may also influence the cardiometabolic and CAD phenotype: in a cohort of 1,091 patients with suspected CAD referred for exercise stress echocardiography, a concave-shaped chest wall (modified Haller index > 2.5) was associated with younger age, smaller body surface area, a lower prevalence of conventional cardiovascular risk factors, and a lower risk of cardiovascular events during medium-term follow-up [30]. Chest wall conformation was not recorded in our retrospective records, so we could not assess whether it contributed to, or confounded, the borderline positive association between BMI and obstructive CAD observed in the exploratory adjusted model (aOR 1.208, 95% CI 0.995–1.466, P = 0.056). This possibility is hypothesis-generating only, and future studies could record a simple non-invasive index of chest shape, such as the modified Haller index, alongside BMI.
Fourth, cortisol exposure was characterized by only two serum measurements obtained on a single day, which cannot capture cumulative cortisol exposure or its day-to-day variability; this may have attenuated any true association between HPA-axis activity and coronary burden. Fifth, the small number of outcome events means that the adjusted and ROC analyses are exploratory; their CIs are wide and the estimates require external validation.
Strengths
However, there are several methodological strengths that contribute to the credibility of this analysis, despite its apparent limitations in terms of power. Firstly, the case–control matching design worked very well and eliminated the problems of demographic interference. Groups I and II turned out to be exceptionally well matched, with no significant differences found in the biological sex (P = 1.00) and median age (P = 0.6191) variables. Such demographic matching is important.
Other major strengths of the study include:
- Rigorous and objective clinical definitions: Instead of relying on subjective, self-reported symptom scales or active antidepressant prescriptions to define psychiatric status, the chronic depression history was verified strictly through clinician-documented psychiatric records on file. This approach eliminated the risk of recall bias or temporary mood fluctuations skewing the case group.
- Automated laboratory assay standards: All serum cortisol measurements were executed using the highly standardized, competitive Roche Elecsys Cortisol II electrochemiluminescence immunoassay on a Cobas e 411 analyzer. Sticking to this automated, manufacturer-certified assay platform kept the raw morning and evening hormone concentrations highly precise, consistent, and reproducible.
- Gold-standard anatomical endpoints: Rather than using soft surrogate clinical markers or patient-reported cardiac histories, the physical CAD burden was defined strictly using objective, retrospective catheter-based coronary angiography records on file. This ensured that the classification of multivessel and obstructive disease was grounded in direct, expert radiological interpretation.
- Multilayered statistical modeling: The analytical workflow went far beyond simple group comparisons by incorporating paired tests for the diurnal cortisol pattern, detailed demographic correlation screening, and adjusted (exploratory) multivariable logistic regression models. These adjusted models made it possible to evaluate the independent predictive value of the daily cortisol curve while simultaneously controlling for classic cardiovascular risk factors like smoking, BMI, hypertension, and dyslipidemia.
Conclusions
In summary, individuals with comorbid type 2 diabetes and chronic depression exhibit substantial diurnal cortisol disruption, but this disrupted stress signature does not directly predict physical CAD burden. When examined in comparison to healthy controls, there is a clear trend of subclinical hypercortisolism (with elevated peak morning level, abnormally high level at night, and the diurnal cortisol ratio is extremely reduced). But when analyzed within the comorbid population, all these disrupted endocrine parameters failed to correlate with the severity or anatomical distribution of coronary atherosclerosis. Patients with single vessel lesions as well as those with multivessel lesions or flow-limiting, obstructive lesions had no significant difference in either daily cortisol level or the computed AM/PM cortisol ratio. This disconnect indicates that hyperactivity of the HPA axis is a strong biomarker for the metabolic and psychiatric comorbid state and, as noted, does not translate in a simple, linear fashion into macrovascular arterial pathology.
As evidenced by the ROC analyses, a single day of cortisol measurement is not a reliable clinical screen for coronary blockages. Routine venous blood draws do not provide a way to determine physical cardiac risk because the AUC did not exceed values considered clinically acceptable, regardless of multivessel disease or obstructive disease. From chronic psychological stress to metabolic dysfunction to actual vascular plaque, the pathway is likely to be slow and cumulative, making it difficult to capture with a single measurement in time. Continuous, long-term measures of cortisol exposure (e.g., hair cortisol, or salivary cortisol sampled repeatedly over several days) would be valuable tools for future research in this area, as they do not rely on spot blood samples or other measures taken at one point only; hair cortisol in particular has emerged as a promising biomarker of chronic stress exposure and has been directly linked to CAD risk in prior cohorts [27, 28]. Longitudinal measures of these endocrines together with high-resolution, non-invasive imaging (such as coronary CT angiography) will prove to be important in allowing us to untangle in its entirety the role of long-term stress biology in the physical course of coronary atherosclerosis.
Acknowledgments
The authors thank Dr. Abdulmabod Omar for his support throughout the ethical approval process.
Financial Disclosure
None to declare. This research received no external funding.
Conflict of Interest
None to declare.
Informed Consent
Patient consent was waived by the Ethics Committee of the Faculty of Medicine, Al-Azhar University, because of the retrospective design of the study and the use of fully de-identified data extracted from existing medical records.
Author Contributions
Conceptualization: Yasmin Mahmoud, Mohamed A. Hegab, and Al Hussein Mustafa Zahran Ahmed. Methodology: Yasmin Mahmoud, Mohamed A. Hegab, Mohammed Mohammed Abdelkhalik Eldeeb, and Yasser Abdelgaleel Omar Ramadan. Software and formal analysis: Abdulrahman Ahmed Eid and Mohamed A. Hegab. Validation: Esmat Mohamed M. Fawzy and M. A. Ghazy. Investigation: Yasmin Mahmoud, Mohammed Mohammed Abdelkhalik Eldeeb, Reham Abdelmaksoud, Yasser Abdelgaleel Omar Ramadan, Mahmoud Ali, Nermin Mohamed Naguib Mahmoud, Esmat Mohamed M. Fawzy, Nagwa Roshdy Mohamed, Ahmed Ali Faheem Abdo, and Mona H. Hamadto. Resources: Nermin Mohamed Naguib Mahmoud, Esmat Mohamed M. Fawzy, and Ahmed Ali Faheem Abdo. Data curation: Esraa Abdelrahman, Abdulrahman Ahmed Eid, and Mona H. Hamadto. Writing – original draft: Yasmin Mahmoud and Mohamed A. Hegab. Writing – review and editing: Al Hussein Mustafa Zahran Ahmed, Reham Abdelmaksoud, Nagwa Roshdy Mohamed, M. A. Ghazy, Mahmoud Ali, and Esraa Abdelrahman. Visualization: Abdulrahman Ahmed Eid and Esraa Abdelrahman. Supervision: M. A. Ghazy and Al Hussein Mustafa Zahran Ahmed. Project administration: Al Hussein Mustafa Zahran Ahmed. Yasmin Mahmoud and Mohamed A. Hegab contributed equally to this work and share first authorship. All authors read and approved the final manuscript.
Data Availability
The data supporting the findings of this study are available from the corresponding author upon reasonable request. The data are not publicly available due to patient privacy and institutional restrictions.
Abbreviations
AM: morning; aOR: adjusted odds ratio; AUC: area under the curve; BMI: body mass index; CAD: coronary artery disease; CAD-RADS: Coronary Artery Disease-Reporting and Data System; CI: confidence interval; CT: computed tomography; DM: diabetes mellitus; HPA: hypothalamic–pituitary–adrenal; HTN: hypertension; IQR: interquartile range; OR: odds ratio; PHQ-9: Patient Health Questionnaire-9; PM: evening; ROC: receiver operating characteristic; SD: standard deviation; STROBE: Strengthening the Reporting of Observational Studies in Epidemiology
| References | ▴Top |
- Abbas U, Laghari RN, Tanveer M, Musawwir UA, Zafar AA, Khalid MU, Hadif M, et al. Elevated cortisol in patients with type 2 diabetes mellitus and comorbid depressive symptoms is associated with poor glycemic control and reduced insulin levels. Discov Ment Health. 2026;6(1).
doi pubmed - Xu L, Zhai X, Shi D, Zhang Y. Depression and coronary heart disease: mechanisms, interventions, and treatments. Front Psychiatry. 2024;15:1328048.
doi pubmed - Yang K, Fang Y, He J, Li J. Prevalence and risk factors of depression in patients with diabetes mellitus: a systematic review and meta-analysis. Front Endocrinol (Lausanne). 2025;16:1660478.
doi pubmed - Mosili P, Mkhize BC, Sibiya NH, Ngubane PS, Khathi A. Review of the direct and indirect effects of hyperglycemia on the HPA axis in T2DM and the co-occurrence of depression. BMJ Open Diabetes Res Care. 2024;12(1):e003218.
doi pubmed - Oo WJ, Lim CL, Goh MH, Koh RY. Serum cortisol and cardiovascular disease risk - a potential biomarker. Curr Cardiol Rev. 2025;21(3):e1573403X1328499.
doi pubmed - Mohd Azmi NAS, Juliana N, Azmani S, Mohd Effendy N, Abu IF, Mohd Fahmi Teng NI, Das S. Cortisol on circadian rhythm and its effect on cardiovascular system. Int J Environ Res Public Health. 2021;18(2):676.
doi pubmed - Marhefkova N, Sladek M, Sumova A, Dubsky M. Circadian dysfunction and cardio-metabolic disorders in humans. Front Endocrinol (Lausanne). 2024;15:1328139.
doi pubmed - Zhang C, Qin G. Irregular sleep and cardiometabolic risk: Clinical evidence and mechanisms. Front Cardiovasc Med. 2023;10:1059257.
doi pubmed - Vreeburg SA, Hoogendijk WJ, van Pelt J, Derijk RH, Verhagen JC, van Dyck R, Smit JH, et al. Major depressive disorder and hypothalamic-pituitary-adrenal axis activity: results from a large cohort study. Arch Gen Psychiatry. 2009;66(6):617-626.
doi pubmed - Sagmeister MS, Harper L, Hardy RS. Cortisol excess in chronic kidney disease - A review of changes and impact on mortality. Front Endocrinol (Lausanne). 2022;13:1075809.
doi pubmed - Ortiz R, Kluwe B, Lazarus S, Teruel MN, Joseph JJ. Cortisol and cardiometabolic disease: a target for advancing health equity. Trends Endocrinol Metab. 2022;33(11):786-797.
doi pubmed - Matthews K, Schwartz J, Cohen S, Seeman T. Diurnal cortisol decline is related to coronary calcification: CARDIA study. Psychosom Med. 2006;68(5):657-661.
doi pubmed - Ronaldson A, Kidd T, Poole L, Leigh E, Jahangiri M, Steptoe A. Diurnal cortisol rhythm is associated with adverse cardiac events and mortality in coronary artery bypass patients. J Clin Endocrinol Metab. 2015;100(10):3676-3682.
doi pubmed - Karl S, Johar H, Ladwig KH, Peters A, Lederbogen F. Dysregulated diurnal cortisol patterns are associated with cardiovascular mortality: findings from the KORA-F3 study. Psychoneuroendocrinology. 2022;141:105753.
doi pubmed - Crawford AA, Soderberg S, Kirschbaum C, Murphy L, Eliasson M, Ebrahim S, Davey Smith G, et al. Morning plasma cortisol as a cardiovascular risk factor: findings from prospective cohort and Mendelian randomization studies. Eur J Endocrinol. 2019;181(4):429-438.
doi pubmed - Degroote C, von Kanel R, Thomas L, Zuccarella-Hackl C, Messerli-Burgy N, Saner H, Wiest R, et al. Lower diurnal HPA-axis activity in male hypertensive and coronary heart disease patients predicts future CHD risk. Front Endocrinol (Lausanne). 2023;14:1080938.
doi pubmed - von Elm E, Altman DG, Egger M, Pocock SJ, Gotzsche PC, Vandenbroucke JP, Initiative S. The Strengthening the Reporting of Observational Studies in Epidemiology (STROBE) statement: guidelines for reporting observational studies. J Clin Epidemiol. 2008;61(4):344-349.
doi pubmed - Kroenke K, Spitzer RL, Williams JB. The PHQ-9: validity of a brief depression severity measure. J Gen Intern Med. 2001;16(9):606-613.
doi pubmed - Sianos G, Morel MA, Kappetein AP, Morice MC, Colombo A, Dawkins K, van den Brand M, et al. The SYNTAX Score: an angiographic tool grading the complexity of coronary artery disease. EuroIntervention. 2005;1(2):219-227.
pubmed - Chen S, Shen Y, Liu YH, Dai Y, Wu ZM, Wang XQ, Yang CD, et al. Impact of glycemic control on the association of endothelial dysfunction and coronary artery disease in patients with type 2 diabetes mellitus. Cardiovasc Diabetol. 2021;20(1):64.
doi pubmed - World Medical A. World medical association declaration of Helsinki: ethical principles for medical research involving human participants. JAMA. 2025;333(1):71-74.
doi pubmed - Yang SH. Relationship of coronary qualitative and quantitative plaque characteristics with hemodynamics and their integrative risk prediction model using machine learning [Doctoral thesis]. Seoul: Seoul National University Graduate School, 2025.
- Aydin Sunbul E, Sunbul M, Gulec H. The impact of major depression on heart rate variability and endothelial dysfunction in patients with stable coronary artery disease. Gen Hosp Psychiatry. 2017;44:4-9.
doi pubmed - Paredes S, Ribeiro L. Cortisol: the villain in metabolic syndrome? Rev Assoc Med Bras (1992). 2014;60(1):84-92.
doi pubmed - Napoli G, Tansella D, Savo MT, Alsergani A, Fusini L, Mushtaq S, Baggiano A, et al. Cardiac CT in the era of precision cardiology: from calcium scoring to comprehensive risk profiling. J Clin Med. 2026;15(13):5313.
doi pubmed - Stalder T, Kirschbaum C, Kudielka BM, Adam EK, Pruessner JC, Wust S, Dockray S, et al. Assessment of the cortisol awakening response: Expert consensus guidelines. Psychoneuroendocrinology. 2016;63:414-432.
doi pubmed - Iob E, Steptoe A. Cardiovascular disease and hair cortisol: a novel biomarker of chronic stress. Curr Cardiol Rep. 2019;21(10):116.
doi pubmed - Stomby A, Stromberg S, Theodorsson E, Olsen Faresjo A, Jones M, Faresjo T. Standard modifiable cardiovascular risk factors mediate the association between elevated hair cortisol concentrations and coronary artery disease. Front Cardiovasc Med. 2021;8:765000.
doi pubmed - Cury RC, Leipsic J, Abbara S, Achenbach S, Berman D, Bittencourt M, Budoff M, et al. CAD-RADS 2.0 - 2022 coronary artery disease-reporting and data system: an expert consensus document of the Society of Cardiovascular Computed Tomography (SCCT), the American College of Cardiology (ACC), the American College of Radiology (ACR), and the North America Society of Cardiovascular Imaging (NASCI). J Cardiovasc Comput Tomogr. 2022;16(6):536-557.
doi pubmed - Sonaglioni A, Rigamonti E, Nicolosi GL, Lombardo M. Prognostic Value of Modified Haller Index in Patients with Suspected Coronary Artery Disease Referred for Exercise Stress Echocardiography. J Cardiovasc Echogr. 2021;31(2):85-95.
doi pubmed
This article is distributed under the terms of the Creative Commons Attribution 4.0 International License (CC BY 4.0), which permits unrestricted use, distribution, and reproduction in any medium, including commercial use, provided the original work is properly cited.
Journal of Clinical Medicine Research is published by Elmer Press Inc.