| Journal of Clinical Medicine Research, ISSN 1918-3003 print, 1918-3011 online, Open Access |
| Article copyright, the authors; Journal compilation copyright, J Clin Med Res and Elmer Press Inc |
| Journal website https://jocmr.elmerjournals.com |
Original Article
Volume 18, Number 9, September 2026, pages 679-686

Nutritional Status in Multiple Sclerosis, Neuromyelitis Optica Spectrum Disorder, and Myelin Oligodendrocyte Glycoprotein Antibody-Associated Disease
Ekdanai Uawithyaa, b, Teerawat Koosiriratc, Natnasak Apiraksattayakula, d, Punchika Kosiyakulc, Sasitorn Sirithoa, c, e, Tatchaporn Ongphichetmethaa, f, Kusuma Chaiyasootg, Jerawat Uthankulh, Natthapon Rattanathamsakula, c, Jiraporn Jitprapaikulsana, c, i
aSiriraj Neuroimmunology Center, Division of Neurology, Department of Medicine, Faculty of Medicine, Siriraj Hospital, Mahidol University, Bangkok, Thailand
bDepartment of Neurology, Oklahoma University Health Science Center, Oklahoma City, OK, USA
cDepartment of Neurology, Faculty of Medicine, Siriraj Hospital, Mahidol University, Bangkok, Thailand
dDepartment of Psychiatry, Texas Tech Health Science Center, El Paso, TX, USA
eBumrungrad International Hospital, Bangkok, Thailand
fDivision of Clinical Epidemiology, Department of Research and Development, Faculty of Medicine, Siriraj Hospital, Mahidol University, Bangkok, Thailand
gDivision of Clinical Nutrition, Department of Medicine, Siriraj Hospital, Mahidol University, Bangkok, Thailand
hFaculty of Medicine, Siriraj Hospital, Mahidol University, Bangkok, Thailand
iCorresponding Author: Jiraporn Jitprapaikulsan, Division of Neurology, Department of Medicine, Faculty of Medicine Siriraj Hospital, Mahidol University, Bangkok 10700, Thailand
Manuscript submitted July 14, 2026, accepted September 8, 2026, published online September 26, 2026
Short title: Nutritional Status in MS, NMOSD, and MOGAD
doi: https://doi.org/10.14740/jocmr6676
| Abstract | ▴Top |
Background: The study aimed to assess the frequency of malnutrition and its associated factors among patients with central nervous system inflammatory demyelinating diseases (CNSIDDs) and to explore their relationship with quality of life (QoL).
Methods: A cross-sectional study at Siriraj Hospital included patients with CNSIDD aged > 18 years and matched healthy controls (HCs). Nutritional status and QoL were evaluated using the Mini Nutritional Assessment (MNA) and the 36-Item Short-Form Survey (SF-36), respectively. Spearman’s rank correlation was used to identify correlations between factors and SF-36 scores. Multivariate Poisson regression analyses utilized a combined “abnormal nutritional status” outcome (pooling “at-risk” and “malnourished” patients) to identify significant associated factors.
Results: The study included 222 patients (100 multiple sclerosis (MS), 105 neuromyelitis optica spectrum disorder (NMOSD), and 17 myelin oligodendrocyte glycoprotein antibody-associated disease (MOGAD)) with a mean age of 46.2 years (standard deviation (SD) 15.2). Overall, 102/222 (45.9%) CNSIDD patients were at risk of or actively experiencing malnutrition. Mean MNA scores were 23.25 (SD 3.76) for MS, 22.84 (SD 3.50) for NMOSD, and 22.03 (SD 3.03) for MOGAD, compared to 26.07 (SD 1.88) for HC (P < 0.001). Malnutrition was found in 7.0% of MS and 8.6% of NMOSD patients, but 0% of MOGAD patients. However, the proportion of patients at risk of malnutrition was highest in the MOGAD group (70.6%), compared to MS (35.0%) and NMOSD (37.1%). SF-36 scores showed a significant positive correlation with MNA scores (r = 0.463, P < 0.001). Initial regression analysis indicated that a MOGAD diagnosis, high Expanded Disability Status Scale (EDSS) scores, and low body mass index were associated with abnormal nutritional status, although these associations remain subject to unmeasured treatment and comorbidity confounders.
Conclusion: A significant proportion of CNSIDD patients face malnutrition or are at high risk, which correlates with poorer QoL and greater disease disability. Routine nutritional screening is an essential component of standard care for this population.
Keywords: MS; NMOSD; MOGAD; Malnutrition; Nutritional assessment; Quality of life
| Introduction | ▴Top |
Central nervous system inflammatory demyelinating diseases (CNSIDDs) are characterized by immune-mediated damage to myelin, encompassing multiple sclerosis (MS), neuromyelitis optica spectrum disorder (NMOSD), and myelin oligodendrocyte glycoprotein antibody-associated disease (MOGAD) [1]. Depending on locations and extent of demyelinating lesions, the clinical symptoms could range from sensory disturbances to severe motor, visual, and cognitive impairments [2–4], which can significantly impact the quality of life (QoL) [5, 6].
Previous assessments using the Global Leadership Initiative on Malnutrition (GLIM) criteria found that approximately 20% of MS patients were classified as malnourished, while 80% were at risk [7]. Other MS cohorts report overlapping challenges: while 63.4% of patients were classified as overweight, malnutrition was simultaneously observed in up to 67.1% [8, 9]. Similarly, in NMOSD, nutritional status, assessed using the Mini Nutritional Assessment (MNA), is significantly worse than in healthy controls (HCs) [10]. Because malnutrition is independently associated with worsening disability in MS, addressing nutritional imbalances is imperative to optimize disease outcomes and enhance patients’ overall QoL [10, 11].
Thai populations possess distinct body habitus and dietary patterns compared to Western cohorts, with the general population often consuming fewer calories than globally recommended [12]. As a result, exploring the nutritional status of Thai CNSIDD has become increasingly important. Currently, no studies have examined malnutrition in this specific demographic, and data on the nutritional status of NMOSD and MOGAD patients remain particularly sparse. This study aimed to assess the prevalence of malnutrition in patients with MS, NMOSD, and MOGAD, evaluate health-related QoL, and identify clinical factors associated with nutritional decline.
| Materials and Methods | ▴Top |
Data collection and ethical considerations
This questionnaire-based cross-sectional study was conducted at Siriraj Hospital, Mahidol University. Patients were recruited from June 10, 2023, to February 22, 2025. The study protocol was first approved by the Siriraj Institutional Review Board Committee (COA No. Si 453/2023) on June 8, 2023 and was conducted in compliance with the Declaration of Helsinki.
Participant selection
The inclusion criteria comprised patients aged over 18 years with MS, NMOSD (including both seropositive and seronegative AQP4 patients), or MOGAD. Patients were excluded if they lacked a definitive diagnosis or were unable to complete the nutritional and QoL questionnaires. To capture a representative, real-world clinical cohort, patients were not explicitly excluded based on concurrent medical or psychiatric comorbidities that are independently associated with malnutrition. Instead, these conditions were documented as baseline characteristics, and their potential confounding effects on nutritional status are addressed in the limitations.
For the HC group, we recruited 100 individuals at a 2:1 patient-to-control ratio. These controls were age-matched (within 5 years) and sex-matched to the patient cohort, and were recruited from hospital personnel and patient relatives. Exclusion criteria for controls included any history of neurological disorders, severe uncontrolled chronic illnesses, or conditions significantly impacting daily function or dietary habits.
Nutritional status definitions
Nutritional status was defined and categorized using the full Mini Nutritional Assessment (MNA) questionnaire (maximum score of 30). Patients were classified into three standard categories based on their total MNA score: normal nutritional status (24.0–30.0 points), at risk of malnutrition (17.0–23.5 points), and malnourished (less than 17.0 points). Body mass index (BMI) was recorded as a baseline demographic variable and analyzed as an associated factor, but it was not used as the sole determinant of malnutrition.
Clinical outcomes
The primary objective was to assess the prevalence of malnutrition among patients with MS, NMOSD, and MOGAD. Secondary objectives included: (1) comparing malnutrition rates and QoL across CNSIDD subtypes, and (2) identifying clinical factors associated with abnormal nutritional status.
Statistical analysis
Frequencies are reported as percentages. The one-way analysis of variance (ANOVA) test was used to compare normally distributed continuous variables, and the Kruskal–Wallis test was applied for non-normally distributed variables. Categorical variables were analyzed using the chi-square test or Fisher’s exact test. Associations between parameters were evaluated using Spearman’s rank correlation.
“At risk” and “malnourished” MNA scores were pooled into a single “abnormal nutritional status” outcome for regression modeling. Univariate Poisson regression analysis with robust variance identified relevant factors (cutoff P < 0.10). Subsequently, variables meeting this threshold were entered into a backward stepwise multivariate Poisson regression model to determine significant independent factors associated with abnormal nutritional status (cutoff P < 0.05). Analyses were conducted using PASW Statistics version 26.0 and Stata BE version 19.5. A P-value < 0.05 was considered statistically significant.
| Results | ▴Top |
Demographic and baseline patient characteristics
We sequentially included 222 patients with an average age of 46.2 ± 15.2 years, of whom 188 (84.7%) were females. Nine patients (4.1%) had concurrent tumors or malignancies (two meningiomas, one acute myeloid leukemia, one diffuse large B-cell lymphoma, one myelodysplastic syndrome, one dermoid cyst, one myoma uteri, and two breast cancer), 11 (5.0%) had concurrent psychiatric diagnosis (six major depressive disorders, two psychosis, one bipolar disorder, one adjustment disorder, and one schizophrenia), and 54 (24.3%) patients had cardiometabolic risk factors. The HC group comprised 100 patients with an average age of 46.3 ± 3.2 years, of whom 85 (85.0%) were females. The mean age at disease onset was 35.7 ± 14.9 years. The median disease duration was 8.5 years (interquartile range (IQR): 3.9–14.5), and the median Expanded Disability Status Scale (EDSS) was 2.0 (IQR: 1.0–4.0). Demographic data are shown in Table 1.
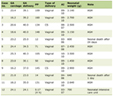 Click to view | Table 1. Demographic Data and Baseline Characteristics Among Patients With Central Nervous System Demyelinating Diseases |
MNA scores of patients with MS, NMOSD, and MOGAD compared with HC
The average MNA scores for all MS, NMOSD, and MOGAD patients were 22.96 ± 3.59. A total of 120/222 (54.05%) had normal nutritional status, 86/222 (38.74%) were at risk of malnutrition, and 16/222 (7.21%) were malnourished. The mean MNA scores were 23.25 ± 3.76 in MS, 22.84 ± 3.50 in NMOSD, and 22.03 ± 3.03 in MOGAD. The prevalence of malnutrition was 7/100 (7.0%), 9/105 (8.6%), and 0/17 (0%), and the risk of malnutrition was 35/100 (35.0%), 39/105 (37.1%), and 12/17 (70.6%) in MS, NMOSD, and MOGAD, respectively. However, the mean MNA score for the control population was significantly higher than that for the CNSIDD population (26.07 (SD 1.88); P < 0.001). The proportion of control participants with normal nutritional status was 89/100 (89.0%), and the risk of malnutrition was 11/100 (11.0%). There were differences in the proportions at risk of malnutrition and experiencing malnutrition, with the highest proportions in MOGAD patients (P = 0.019) and NMOSD patients (P = 0.020), respectively. Comparisons among the groups are shown in Figure 1.
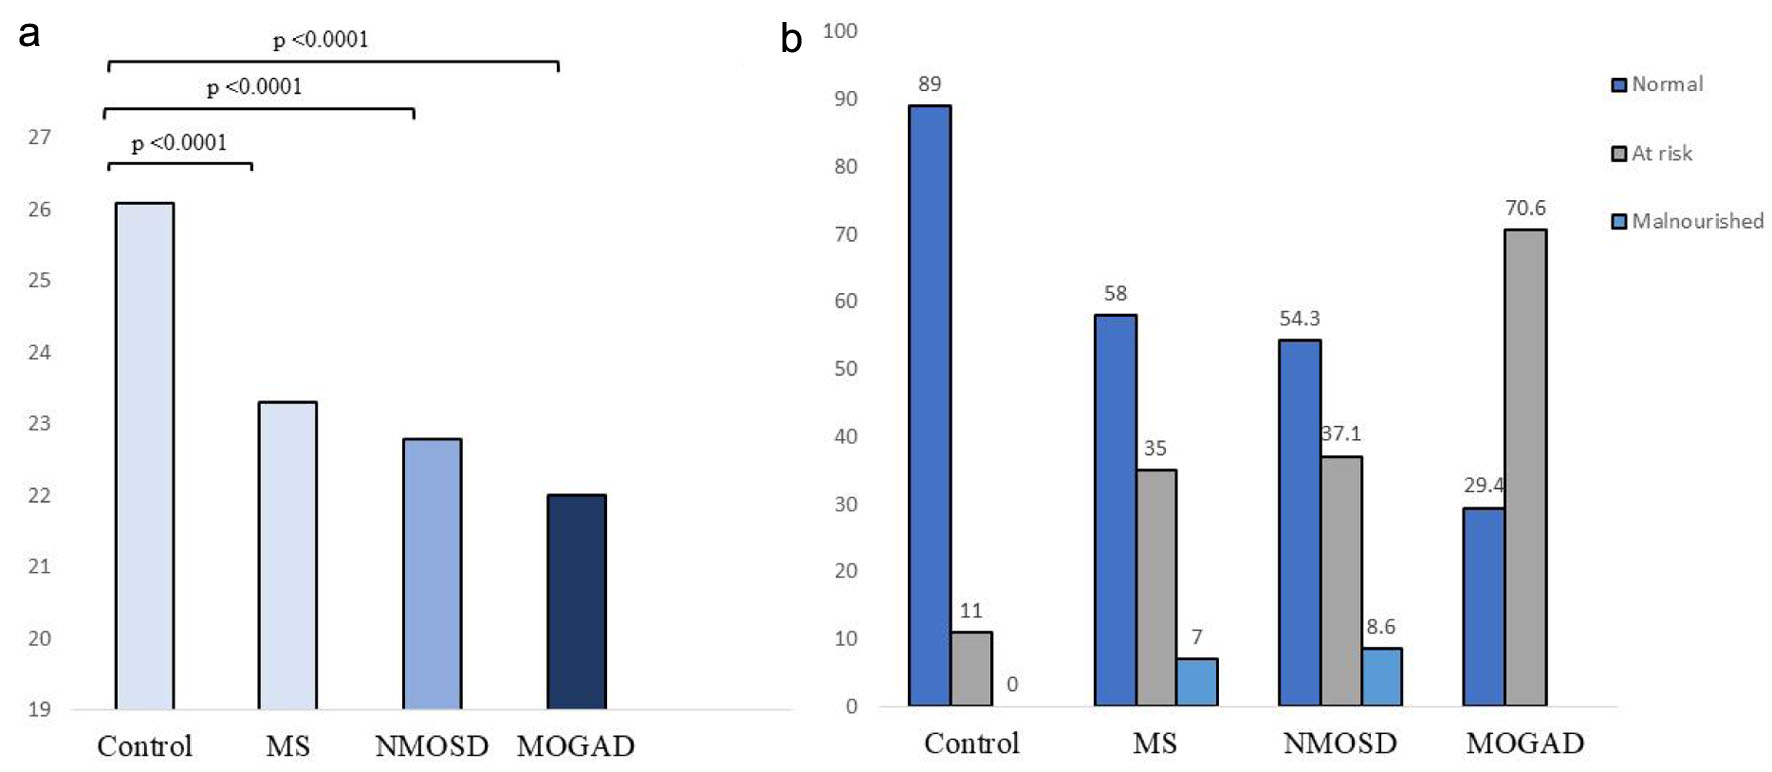 Click for large image | Figure 1. The nutritional status of patients is categorized by the MNA score. (a) Bar graph of the mean MNA score between each group. (b) Bar graph of the proportions of nutritional status of healthy controls, MS, NMOSD, and MOGAD patients. MNA: Mini Nutritional Assessment; MOGAD: myelin oligodendrocyte glycoprotein antibody-associated disease; MS: multiple sclerosis; NMOSD: neuromyelitis optica spectrum disorder. |
QoL status in CNSIDD patients
The overall 36-Item Short-Form Survey (SF-36) score was similar across groups, with a mean of 58.7 ± 15.5. There were no differences in the SF-36 subscores, including general health, physical function, physical role, bodily pain, vitality, social function, role emotion, and mental health. Full details of the SF-36 score were demonstrated in Supplementary Material 1 (jocmr.elmerjournals.com).
Baseline and clinical factors associated with either at risk of malnutrition or malnutrition
The results demonstrated that patients with MOGAD had a significantly higher risk of abnormal nutritional status than MS patients (prevalence ratio (PR) = 2.02, 95% confidence interval (CI) 1.49–2.93). Additionally, higher EDSS scores (PR = 1.13, 95% CI 1.08–1.19) and lower BMI (PR = 1.09, 95% CI 1.06–1.14) were significantly associated with abnormal nutritional status. Furthermore, visual analysis was consistent with an inverse relationship between physical disability and nutritional status, with MNA scores declining as EDSS increased (Fig. 2; Table 2).
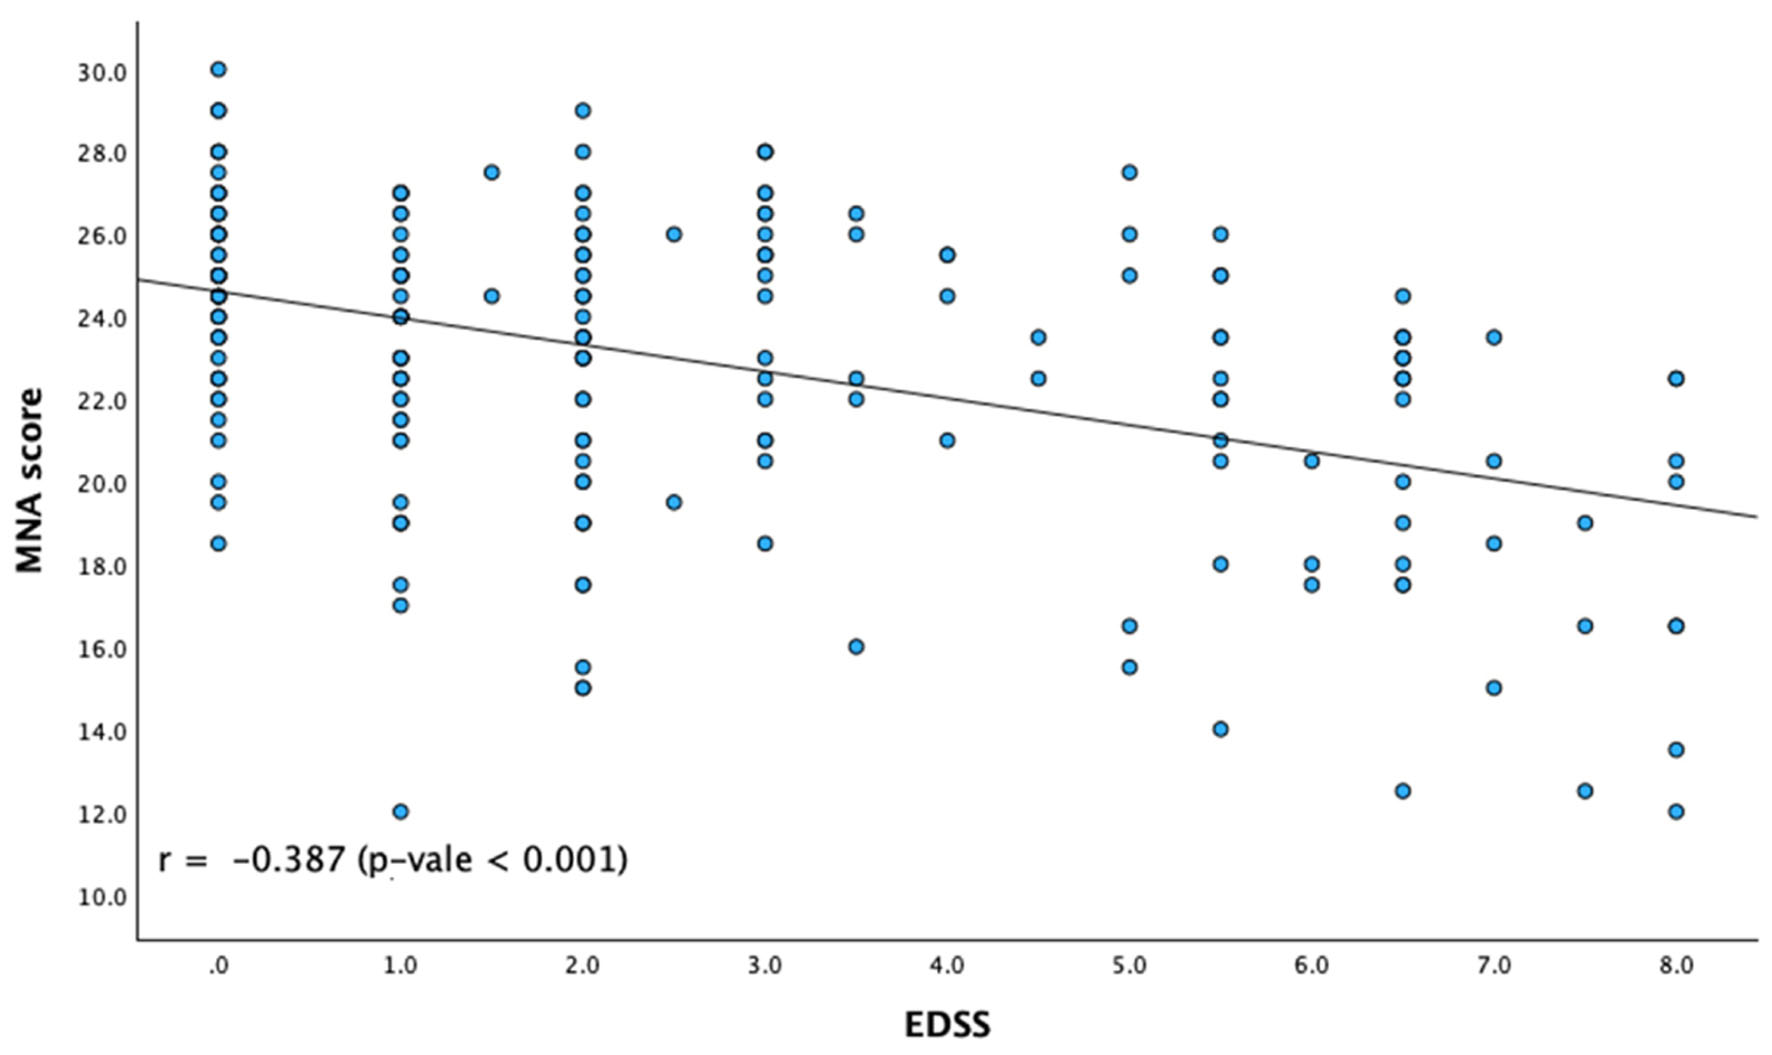 Click for large image | Figure 2. Correlation between clinical disability and nutritional status. The scatter plot demonstrates the relationship between EDSS scores and MNA scores across the demyelinating disease cohorts. EDSS: Expanded Disability Status Scale; MNA: Mini Nutritional Assessment. |
Click to view | Table 2. Univariate and Multivariate Poisson Regression to Predict the Risk of Malnutrition and Patients at Risk of Malnutrition |
| Discussion | ▴Top |
This study evaluated the nutritional status of patients with MS, NMOSD, and MOGAD. Nearly 46% of CNSIDD patients were at risk of or diagnosed with malnutrition compared to 11% of HCs. MNA scores were significantly lower in CNSIDD patients than in HCs. SF-36 scores also showed significant correlations with MNA scores suggesting that lower nutritional status tracks with poorer QoL with nutritional status. Initial regression analysis suggested that a MOGAD diagnosis, high EDSS, and low BMI were associated with abnormal nutritional status; however, these findings must be interpreted with caution, as the model did not fully control for treatment-related confounders or comorbidity burden.
In this cohort, the disease group had a higher proportion of patients with at-risk malnutrition and malnutrition than the control group. The prevalence of nutritional risk in our cohort (45.9%) is notably lower than the 67.1% reported in Egyptian MS patients [9] and the 87.8% reported in Turkish cohorts [8, 13, 14]. The rate of NMOSD is similarly high, at approximately 85% [10]. Several factors may explain this variance. First, the assessment tools differed; while we utilized the MNA, other studies employed the GLIM [14] or Subjective Global Assessment (SGA) [9], which may have different sensitivity thresholds. Second, our cohort consisted entirely of outpatients with a relatively low median EDSS of 2.0. In contrast, studies reporting higher rates often included hospitalized patients or those with more advanced disability, where dysphagia and limited mobility significantly exacerbate nutritional decline. Finally, dietary habits and the lower average BMI in the general Thai population compared to Western or Middle Eastern cohorts may influence the baseline captured by the MNA.
Our study revealed that NMOSD patients have the highest proportion of malnutrition status. The findings could be due to their more severe clinical presentation, both of which are associated with a higher risk of malnutrition [15, 16]. Similarly, MOGAD patients exhibited the highest proportion of “at-risk” malnutrition. We hypothesize that this may be related to shorter durations since their last attack in our cohort and differing acute management strategies.
Improved nutritional status was associated with lower disability levels and higher QoL in our cohort, while some evidence suggests that dietary interventions might influence symptom severity [17]. For MS patients, neurodegeneration could be present even in the early stage of the disease, which could lead to long-term disability and worsening of the disease [18]. Therefore, implementing strategies to mitigate neurodegeneration is essential. One approach involves dietary control, which may help reduce oxidative stress and protect against chronic demyelination [19–21]. Furthermore, maintaining an optimal diet can alleviate fatigue and enhance patients’ QoL [20]. Previous studies have suggested that adopting a Mediterranean diet is beneficial for individuals with MS [22, 23]. Regarding micronutrients, MS and NMOSD patients often have vitamin D deficiency, which could result in further disease progression and disability [24–26]. Nevertheless, conflicting data still exist regarding the role of vitamin D supplementation in MS patients [27].
Given the study’s significant findings, implementing a health policy to address nutritional disorders is crucial. The 2017 ESPEN Guideline on Clinical Nutrition in Neurology recommends screening for malnutrition at the time of MS diagnosis. This includes screening for dysphagia in high-risk groups, such as patients with severe disabilities, cerebellar dysfunction, or prolonged disease duration. However, standard screening tools for these patients have not yet been recommended [28]. Therefore, adapting nutritional intake recommendations to the Thai population’s diet and implementing methods to improve compliance could potentially benefit Thai CNSIDD patients [29].
The nutritional deficits could reflect systemic involvement described across chronic immune-mediated diseases. Systemic manifestations have similarly been reported in other organ autoimmune diseases, including gastrointestinal disorders such as celiac disease [30] and diseases affecting other primary target organs, such as psoriasis [31] and Hashimoto thyroiditis [32]. Therefore, inflammatory pathways, instead of a demyelination-specific process, may also contribute to nutritional decline across chronic autoimmune conditions.
Our study has several limitations. First, the cross-sectional design and small sample sizes within subgroups (particularly the 17 MOGAD patients) limit generalizability and prevent the establishment of strict causation. Second, our multivariable models were not adjusted for several clinically important determinants of nutritional status. Specifically, patients with conditions independently associated with malnutrition, such as concurrent malignancies or psychiatric disorders, were included without appropriate statistical adjustment. Furthermore, the majority of patients had histories of varied immunotherapies. We did not adjust the regression model for cumulative corticosteroid exposure or duration of steroid therapy, as our registry only captured a binary metric of current use at the time of the questionnaire. This is a significant potential confounder, given the systemic glucocorticoid requirements in MOGAD patients.. As dose and duration data were not available for any subgroup, a corresponding sensitivity analysis could not be performed; prospective collection of cumulative glucocorticoid exposure is recommended. Additionally, dietary habits and the lower average BMI in the general Thai population compared to Western or Middle Eastern cohorts may influence the baseline captured by the MNA, which was developed and validated primarily in elderly Western populations. Therefore, the lower baseline MNA scores observed in our study may partially reflect the baseline population rather than pathological malnutrition alone. Finally, while highly validated, the MNA lacks comprehensive dietary tracking, which may have led to the oversight of specific micronutrient deficiencies.
In conclusion, this study explicitly highlighted the risk and evidence of malnutrition in patients with MS, NMOSD, and MOGAD. However, the overall MNA scores did not reveal significant differences between patient subtypes. The alarming prevalence of malnutrition risk necessitates targeted interventions. Regular monitoring and individualized nutritional support are essential components of comprehensive care for individuals with demyelinating diseases to potentially improve their health outcomes and QoL. Future studies should explore the underlying causes of nutritional deficiencies in these populations and develop customized diet strategies to mitigate these risks.
| Supplementary Material | ▴Top |
Suppl 1. The 36-Item Short-Form Survey comparing health-related quality of life in NMOSD, MS, and MOGAD.
Acknowledgments
We thank Ms. Khemajira Karnketklang for her invaluable contributions to statistical analysis.
Financial Disclosure
This study received funding from the Routine to Research Siriraj Unit.
Conflict of Interest
The authors declare that they do not have any competing interests.
Informed Consent
All patients signed a written informed consent before participation.
Author Contributions
Conceptualization: Teerawat Koosirirat, Jiraporn Jitprapaikulsan; data curation: Ekdanai Uawithya, Teerawat Koosirirat, Natnasak Apiraksattayakul, Punchika Kosiyakul, Jerawat Uthankul; formal analysis: Ekdanai Uawithya, Teerawat Koosirirat; investigation: Ekdanai Uawithya, Teerawat Koosirirat, Natnasak Apiraksattayakul, Punchika Kosiyakul, Jerawat Uthankul; methodology: Ekdanai Uawithya, Teerawat Koosirirat, Jiraporn Jitprapaikulsan; project administration: Ekdanai Uawithya, Jiraporn Jitprapaikulsan; resources: Ekdanai Uawithya; software: Ekdanai Uawithya; supervision: Jiraporn Jitprapaikulsan; validation: Sasitorn Siritho, Tatchaporn Ongphichetmetha, Kusuma Chaiyasoot, Natthapon Rattanathamsakul, Jiraporn Jitprapaikulsan; visualization: Ekdanai Uawithya, Teerawat Koosirirat; writing – original draft: Ekdanai Uawithya, Teerawat Koosirirat; writing – reviewing and editing: Ekdanai Uawithya, Teerawat Koosirirat, Natnasak Apiraksattayakul, Punchika Kosiyakul, Sasitorn Siritho, Tatchaporn Ongphichetmetha, Kusuma Chaiyasoot, Jerawat Uthankul, Natthapon Rattanathamsakul, Jiraporn Jitprapaikulsan.
Data Availability
The data supporting the findings of this study are available from the corresponding author (Dr. Jiraporn Jitprapaikulsan) upon reasonable request..
Abbreviations
AQP4: aquaporin-4; ARR: annualized relapsed rate; BMI: body mass index; CI: confidence interval; CNSIDD: central nervous system inflammatory demyelinating diseases; DMT: disease-modifying therapy; EDSS: Expanded Disability Status Scale; ESPEN: European Society for Clinical Nutrition and Metabolism; GLIM: Global Leadership Initiative on Malnutrition; HC: healthy controls; IQR: interquartile range; MNA: Mini Nutritional Assessment; MOGAD: myelin oligodendrocyte glycoprotein antibody-associated disease; MS: multiple sclerosis; NA: not available; NMOSD: neuromyelitis optica spectrum disorder; PR: prevalence ratio; QoL: quality of life; SD: standard deviation; SF-36: 36-Item Short Form Survey; SGA: Subjective Global Assessment
| References | ▴Top |
- Hoftberger R, Lassmann H. Inflammatory demyelinating diseases of the central nervous system. Handb Clin Neurol. 2017;145:263-283.
doi pubmed - Sechi E, Cacciaguerra L, Chen JJ, Mariotto S, Fadda G, Dinoto A, Lopez-Chiriboga AS, et al. Myelin oligodendrocyte glycoprotein antibody-associated disease (MOGAD): a review of clinical and MRI features, diagnosis, and management. Front Neurol. 2022;13:885218.
doi pubmed - Gelfand JM. Multiple sclerosis: diagnosis, differential diagnosis, and clinical presentation. Handb Clin Neurol. 2014;122:269-290.
doi pubmed - Huda S, Whittam D, Bhojak M, Chamberlain J, Noonan C, Jacob A. Neuromyelitis optica spectrum disorders. Clin Med (Lond). 2019;19(2):169-176.
doi pubmed - Berrigan LI, Fisk JD, Patten SB, Tremlett H, Wolfson C, Warren S, Fiest KM, et al. Health-related quality of life in multiple sclerosis: direct and indirect effects of comorbidity. Neurology. 2016;86(15):1417-1424.
doi pubmed - Meca-Lallana JE, Gomez-Ballesteros R, Perez-Miralles F, Forero L, Sepulveda M, Calles C, Martinez-Gines ML, et al. Impact of neuromyelitis optica spectrum disorder on quality of life from the patients' perspective: an observational cross-sectional study. Neurol Ther. 2022;11(3):1101-1116.
doi pubmed - de van der Schueren MAE, Keller H, Consortium G, Cederholm T, Barazzoni R, Compher C, Correia M, et al. Global Leadership Initiative on Malnutrition (GLIM): Guidance on validation of the operational criteria for the diagnosis of protein-energy malnutrition in adults. Clin Nutr. 2020;39(9):2872-2880.
doi pubmed - Mogilko N, Malgorzewicz S. Prevalence of poor nutrition status in multiple sclerosis patients assessed by different diagnostic tools. Acta Biochim Pol. 2023;70(2):343-345.
doi pubmed - Afifi ZE, Shehata RI, El Sayed AF, Hammad ESM, Salem MR. Nutritional status of multiple sclerosis (MS) patients attending Kasr Alainy MS unit: an exploratory cross-sectional study. J Egypt Public Health Assoc. 2021;96(1):20.
doi pubmed - Huang R, Huang X, Wang Y, Xie Y, Chen K, Ma S, Zhou X, et al. The nutritional risk in patients with neuromyelitis optica spectrum disorder. Mult Scler Relat Disord. 2023;77:104900.
doi pubmed - Bromley L, Horvath PJ, Bennett SE, Weinstock-Guttman B, Ray AD. Impact of nutritional intake on function in people with mild-to-moderate multiple sclerosis. Int J MS Care. 2019;21(1):1-9.
doi pubmed - Ivanovitch K, Klaewkla J, Chongsuwat R, Viwatwongkasem C, Kitvorapat W. The intake of energy and selected nutrients by thai urban sedentary workers: an evaluation of adherence to dietary recommendations. J Nutr Metab. 2014;2014:145182.
doi pubmed - Atabilen B, Akdevelioglu Y, Acar Ozen P, Tuncer A. Examining dietary habits in the context of multiple sclerosis: a comprehensive investigative approach. Mult Scler Relat Disord. 2024;83:105467.
doi pubmed - Sorgun MH, Yucesan C, Tegin C. Is malnutrition a problem for multiple sclerosis patients? J Clin Neurosci. 2014;21(9):1603-1605.
doi pubmed - Akaishi T, Takahashi T, Misu T, Abe M, Ishii T, Fujimori J, Aoki M, et al. Progressive patterns of neurological disability in multiple sclerosis and neuromyelitis optica spectrum disorders. Sci Rep. 2020;10(1):13890.
doi pubmed - Bichuetti DB, Oliveira EM, Souza NA, Tintore M, Gabbai AA. Patients with neuromyelitis optica have a more severe disease than patients with relapsingremitting multiple sclerosis, including higher risk of dying of a demyelinating disease. Arq Neuropsiquiatr. 2013;71(5):275-279.
doi pubmed - Tryfonos C, Chrysafi M, Vadikolias K, Berberoglou L, Vorvolakos T, Dimoliani S, Tsourouflis G, et al. Nutritional interventional studies in patients with multiple sclerosis: a scoping review of the current clinical evidence. J Neurol. 2024;271(4):1536-1570.
doi pubmed - Mey GM, Mahajan KR, DeSilva TM. Neurodegeneration in multiple sclerosis. WIREs Mech Dis. 2023;15(1):e1583.
doi pubmed - Katz Sand I. The role of diet in multiple sclerosis: mechanistic connections and current evidence. Curr Nutr Rep. 2018;7(3):150-160.
doi pubmed - Bagur MJ, Murcia MA, Jimenez-Monreal AM, Tur JA, Bibiloni MM, Alonso GL, Martinez-Tome M. Influence of diet in multiple sclerosis: a systematic review. Adv Nutr. 2017;8(3):463-472.
doi pubmed - Noormohammadi M, Ghorbani Z, Naser Moghadasi A, Saeedirad Z, Shahemi S, Ghanaatgar M, Rezaeimanesh N, et al. MIND diet adherence might be associated with a reduced odds of multiple sclerosis: results from a case-control study. Neurol Ther. 2022;11(1):397-412.
doi pubmed - Ertas Ozturk Y, Helvaci EM, Sokulmez Kaya P, Terzi M. Is Mediterranean diet associated with multiple sclerosis related symptoms and fatigue severity? Nutr Neurosci. 2023;26(3):228-234.
doi pubmed - Abbasi H, Shakouri F, Mosaddeghi-Heris R, Gholipour-Khalili E, Jahanshahlou F, Sanaie S, Naseri A, et al. Mediterranean-like diets in multiple sclerosis: a systematic review. Rev Neurol (Paris). 2024;180(10):1021-1030.
doi pubmed - Rodney C, Rodney S, Millis RM. Vitamin D and demyelinating diseases: Neuromyelitis Optica (NMO) and Multiple Sclerosis (MS). Autoimmune Dis. 2020;2020:8718736.
doi pubmed - Martinelli V, Dalla Costa G, Colombo B, Dalla Libera D, Rubinacci A, Filippi M, Furlan R, et al. Vitamin D levels and risk of multiple sclerosis in patients with clinically isolated syndromes. Mult Scler. 2014;20(2):147-155.
doi pubmed - Jitprapaikulsan J, Siritho S, Prayoonwiwat N. Vitamin D level status in Thai neuromyelitis optica patients. J Neuroimmunol. 2016;295-296:75-78.
doi pubmed - Feige J, Moser T, Bieler L, Schwenker K, Hauer L, Sellner J. Vitamin D supplementation in multiple sclerosis: a critical analysis of potentials and threats. Nutrients. 2020;12(3).
doi pubmed - Burgos R, Breton I, Cereda E, Desport JC, Dziewas R, Genton L, Gomes F, et al. ESPEN guideline clinical nutrition in neurology. Clin Nutr. 2018;37(1):354-396.
doi pubmed - Russell RD, Black LJ, Begley A. Navigating dietary advice for multiple sclerosis. Health Expect. 2021;24(3):853-862.
doi pubmed - Poddighe D, Zhubanova G, Galiyeva D, Mussina K, Forss A. Prevalence of joint complaints in patients with celiac disease: a systematic review and meta-analysis. J Clin Med. 2025;14(11).
doi pubmed - Campanati A, Marani A, Martina E, Diotallevi F, Radi G, Offidani A. Psoriasis as an immune-mediated and inflammatory systemic disease: from pathophysiology to novel therapeutic approaches. Biomedicines. 2021;9(11).
doi pubmed - Li J, Huang Q, Sun S, Zhou K, Wang X, Pan K, Zhang Y, et al. Thyroid antibodies in Hashimoto's thyroiditis patients are positively associated with inflammation and multiple symptoms. Sci Rep. 2024;14(1):27902.
doi pubmed
This article is distributed under the terms of the Creative Commons Attribution 4.0 International License (CC BY 4.0), which permits unrestricted use, distribution, and reproduction in any medium, including commercial use, provided the original work is properly cited.
Journal of Clinical Medicine Research is published by Elmer Press Inc.