

Nutritional Status in Multiple Sclerosis, Neuromyelitis Optica Spectrum Disorder, and Myelin Oligodendrocyte Glycoprotein Antibody-Associated Disease
DOI:
https://doi.org/10.14740/jocmr6676Keywords:
MS, NMOSD, MOGAD, Malnutrition, Nutritional assessment, Quality of lifeAbstract
Background: The study aimed to assess the frequency of malnutrition and its associated factors among patients with central nervous system inflammatory demyelinating diseases (CNSIDDs) and to explore their relationship with quality of life (QoL).
Methods: A cross-sectional study at Siriraj Hospital included patients with CNSIDD aged > 18 years and matched healthy controls (HCs). Nutritional status and QoL were evaluated using the Mini Nutritional Assessment (MNA) and the 36-Item Short-Form Survey (SF-36), respectively. Spearman’s rank correlation was used to identify correlations between factors and SF-36 scores. Multivariate Poisson regression analyses utilized a combined “abnormal nutritional status” outcome (pooling “at-risk” and “malnourished” patients) to identify significant associated factors.
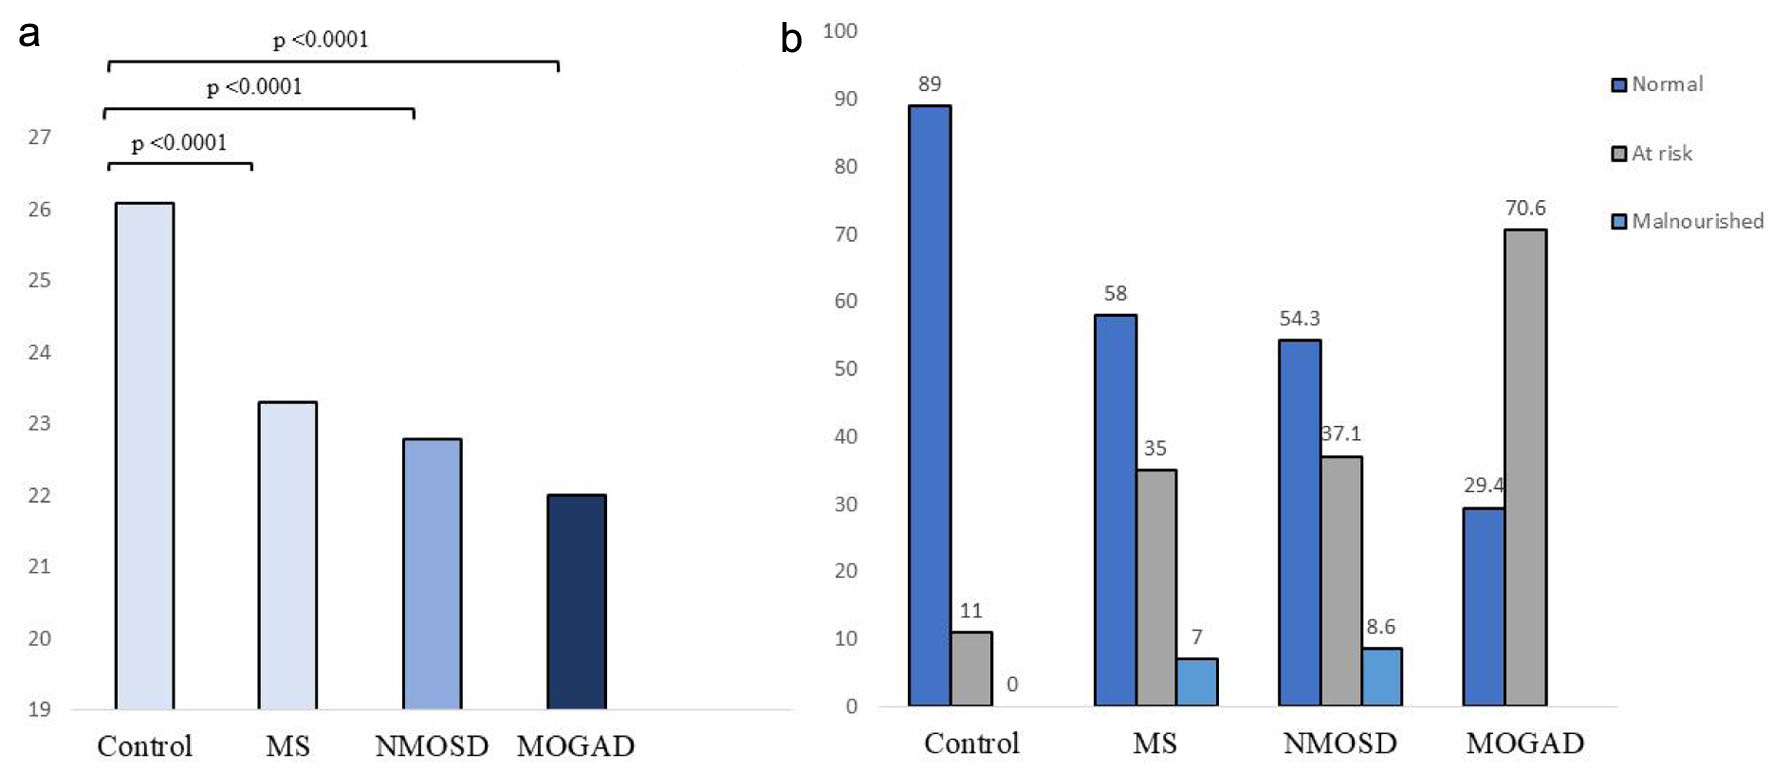
Results: The study included 222 patients (100 multiple sclerosis (MS), 105 neuromyelitis optica spectrum disorder (NMOSD), and 17 myelin oligodendrocyte glycoprotein antibody-associated disease (MOGAD)) with a mean age of 46.2 years (standard deviation (SD) 15.2). Overall, 102/222 (45.9%) CNSIDD patients were at risk of or actively experiencing malnutrition. Mean MNA scores were 23.25 (SD 3.76) for MS, 22.84 (SD 3.50) for NMOSD, and 22.03 (SD 3.03) for MOGAD, compared to 26.07 (SD 1.88) for HC (P < 0.001). Malnutrition was found in 7.0% of MS and 8.6% of NMOSD patients, but 0% of MOGAD patients. However, the proportion of patients at risk of malnutrition was highest in the MOGAD group (70.6%), compared to MS (35.0%) and NMOSD (37.1%). SF-36 scores showed a significant positive correlation with MNA scores (r = 0.463, P < 0.001). Initial regression analysis indicated that a MOGAD diagnosis, high Expanded Disability Status Scale (EDSS) scores, and low body mass index were associated with abnormal nutritional status, although these associations remain subject to unmeasured treatment and comorbidity confounders.
Conclusion: A significant proportion of CNSIDD patients face malnutrition or are at high risk, which correlates with poorer QoL and greater disease disability. Routine nutritional screening is an essential component of standard care for this population.
Published
Issue
Section
License
Copyright (c) 2026 The authors

This work is licensed under a Creative Commons Attribution 4.0 International License.